R E S E A R C H
Open Access
Transition effect detection for extracting
highlights in baseball videos
Po-Chyi Su
*, Chi-Heng Lan, Chin-Song Wu, Zi-Xin Zeng and Wei-Yu Chen
Abstract
In this research, a transition effect detection scheme for identifying possible highlight segments in baseball videos will be presented. The effects that are inserted manually by the broadcasters for signaling the slow-motion segments will be extracted and the frames containing such effects can serve as anchor positions for further processing. A set of video segments will first be chosen to construct the ‘transition effect template’ for the archived video. The candidate frames will be compared with this template for searching the slow-motion video segments. In baseball videos, we further construct the ‘pitching view template’ so that the starting positions of the video segments of interest can be located. By processing these segments only, we may further employ such method as hidden Markov model to classify their content. The major contribution of this research is the usage of compressed-domain features to achieve the efficiency. The experimental results show the feasibility of the proposed scheme.
Introduction
Watching sportscast has been a popular past-time activ-ity worldwide and many viewers may choose to record their favorite games for archiving or time-shifting pur-poses. Thanks to the superior perceptual quality, the convenience of storing, transmitting, and even processing of digital visual content, digital recording facilities with lower cost and more computational power are becoming widely available nowadays. When the users set to enjoy their archived digital videos, they may be more interested in watching only the game highlights, which will save them substantial amount of time without sacrificing too much excitement. Therefore, efficient and effective sports video highlight extraction from digital content raises a lot of research activities [1-10] in recent years.
The approaches to extracting highlights from sports videos may be roughly classified into four categories. The first approach is to identify the unique visual and/or audio characteristics that may exist in game highlights. When an impressive performance occurs in the sportscast, a typical scene or sound may appear. By combining the audio-visual features with the domain-specific knowledge, we may obtain a better understanding of the content.
*Correspondence: [email protected]
Department of Computer Science and Information Engineering, National Central University, Jhongli, 32001 Taiwan
Such visual features as the color histogram, types of cam-era shots, motion information, and such audio features as zero-crossing rate, frequency spectrum, and signal energy level help to identify the special events [11]. Wang et al. [12] presented a soccer goal extraction algorithm by analyzing the correlations among scenes to extract the ones that contain the goal shot attempts. A graphic rep-resentation is proposed by Ren et al. [13] to facilitate the analysis of temporal saliency in soccer videos. In base-ball videos, the combination of certain court views may be useful in determining the play of home runs or base hits [8]. The higher-level understanding of the baseball game for highlight detection can also be achieved by the delicate scene analysis [14]. The sound processing is also applied quite often in video highlight extraction [15-19]. In sports videos, the sound from the crowds at the stadium or the speaking tone of the anchorman/commentators will reflect the exciting moments of the games. The identifi-cation of such sounds as the whistles from the referees or ball hitting will be beneficial. The major drawback of sound processing may be the higher false identification rate. For example, the crowds in the stadium may not cheer for the visiting team. Additional processing may be needed to increase the accuracy. The second approach is to analyze the text data shown in the sports videos. The caption sent along with the transmitted video surely provides more accurate information. If the caption is not
available, the so-called video optical character recognition can be applied to identify the content of score boxes super-imposed on the sides of the screen [20-24]. The moment when the score changes in a game will be what the audi-ences care so the message conveyed in the score boxes will assist the browsing of sports videos. The major challenge of this approach may be the inconsistent forms of score boxes in different sports games as their sizes/types may be different. The third approach is to determine the slow motion replays in sports videos [25-27]. After a special event happens in a ball game and the broadcasters iden-tify that the audience may be interested in viewing it again, the video segment will be replayed in a slower pace. It has been observed that the replayed video segments may demonstrate certain visual representations, such as the repeated fields in TV broadcasting [28], the unique statis-tics of motion vectors in MPEG video [29], and the scene transitions [30]. These characteristics may be used to dif-ferentiate the slow-motion segments from normal scenes. Some slow-motion replays are shown after fading in/out [31] or dissolving effects [32], so the successful detec-tions of them may help to identify the replays. Giusto et al. [33] viewed slow-motion replays as special effects and employed the fractal/wavelet decomposition to detect them. However, the accuracy of slow-motion detection may be affected by the way that the replays are processed since they are broadcaster dependent. In addition, some slow-motion scenes are quite difficult to be differentiated from the normal ones, even by the human eye. Certain replays may even be displayed with varying speeds to attract the viewers’ attention, and this inconsistent struc-ture of slow-motion replays may complicate the process of extraction.
The fourth approach is to employ the methodology of multimodal fusion [34-40] to build highlight extrac-tion/classification systems, which may bridge the gap between the extracted low-level features and the seman-tics of the data. Bertini et al. [41] employed the camera motion, play-field zone and players’ positions to fuse for highlight annotation. Shih et al. [42] employed the maps of spatial/temporal features and face information to con-struct the attention model for identifying the highlights. Zhu et al. [43] proposed a multimodal approach to orga-nize the highlights extracted from racket sports videos by using a nonlinear ranking model. They also proposed to fuse text, time, and view types to extract attack events for tactics classification in soccer videos [44]. Niu et al. [45] further proposed a real-world trajectory extraction method based on field line detection to recognize six typ-ical soccer attack patterns for tactic analysis. The hidden Markov model (HMM) is utilized quite often in extracting highlights from sports videos. Cheng et al. [9] developed a baseball highlight extraction scheme based on HMM by fusing video and audio features. Papadopoulos et al. [46]
utilized the motion vectors, and Kijak et al. [47,48] made use of the structure of video shots in the training phase of their HMM-based schemes. Nguyen et al. [49] employed principal component analysis and the frame features for data fusion. Wang et al. [50] proposed to convert the low-level features into a keyword sequence for their HMM classifier by using Viterbi algorithm. Delakis et al. [51] employed HMM and segment models for audio-visual integration in video indexing. Chang et al. [8] applied HMM by using scene shots and visual features in base-ball games. Chen et al. [52] further employed HMM to analyze the details of ball hitting events. Ouazzani et al. [53] combined Bayesian inferences and HMM in soccer games. Instead of using the general HMM, Ding et al. [54] employed the multi-channel segmental HMM for video mining in football videos. Tang et al. [55] made use of MPEG2 features and HMM to detect highlights in cricket games.
should not be computationally expensive. As videos are often archived in MPEG format these days, the schemes directly working in the compressed domain will be pre-ferred in manufacturing electronic products. Therefore, we further simplify and extend our early work [58] to develop a compressed domain transition effect detection scheme for highlight extraction. We make use of both the characteristics of effects and their repeated appearances to construct the associated templates in the investigated video so that we may reduce the challenges of using a set of fixed parameters or rules to identify all kinds of effects correctly. The classification of highlights, which can also be operated in the compressed domain, will then be facilitated by analyzing the video segments of interest only. We will describe the details of the proposed scheme, including the feature extraction, the construction of tem-plates, and the classification of highlights in the following sections. Experimental results will show the feasibility of our method.
The proposed scheme
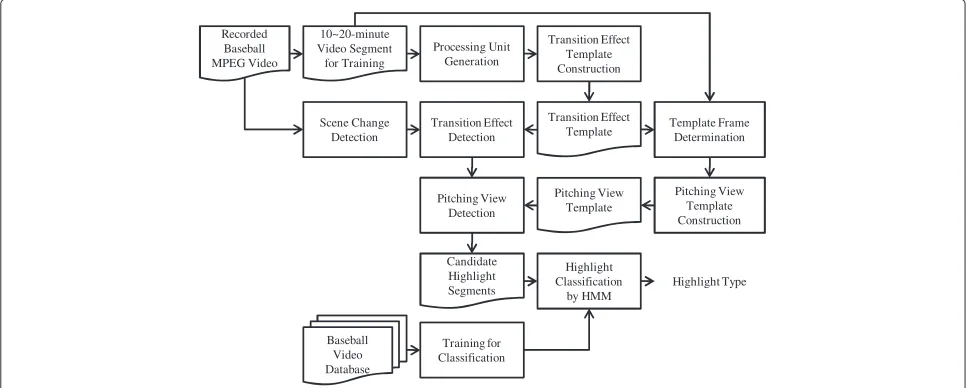
Figure 1 shows the block diagram of the proposed scheme. The input of the system is a compressed video in either MPEG-1 or MPEG-2 format, from which the representa-tive features are extracted for the subsequent processing. We will use a longer video segment, which can cover a few transition effects, to train the ‘templates’ of transi-tion effects and pitching views in baseball videos for more accurately locating these segments. The so-called process-ing units that may include the transition effects are formed from this training video segment for constructing the transition effect template by the methodology of majority voting. Then we start to construct the pitching view tem-plate. Since the transition effects always come with scene
changes, the compressed-domain scene-change detection is applied and the frames around the scene changes will be compared with the effect template. Once the frames with transition effects are identified, the pitching views associated with the plays will be extracted by using the pitching view template. The contents of the plays can then be classified by such method as HMM, which is trained off-line. In the following subsections, we will examine the procedures of each step in details.
Data preparation
In this subsection, we describe the procedures of gen-erating the data for effective processing, including the extraction of features from the MPEG stream and the detection of scene changes.
Features from the MPEG bit stream
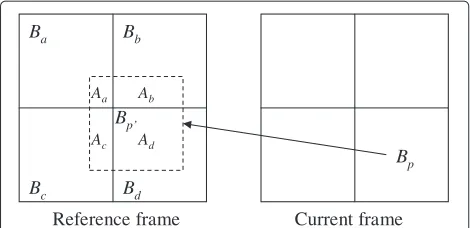
The features for the subsequent processing are extracted from the MPEG-compressed bit stream. The coding modes and motion vectors, which can be acquired con-veniently, are employed to determine the variation of content in adjacent frames. The mean values of blocks, which are derived from the lowest frequency coefficients, i.e., ‘DC’ coefficients in DCT (discrete cosine transform) blocks, will provide the color information in the frames. The ‘DC frames,’ which are the coarse down-sampled frames with size equal to 1/8×1/8 of the original frame resolution, will be constructed as follows: In I frames, we can retrieve the DC coefficients without any problem as they are only differentially Huffman-coded. For P frames, Figure 2 shows the four 8×8 blocks, includingBa, Bb,
Bc, and Bd in the reference frame and the block Bp in
the currently processed frame. The best match of Bp in
the reference frame,Bp, has been found by the motion
Recorded Baseball MPEG Video
10~20-minute Video Segment
for Training
Processing Unit Generation
Transition Effect Template Construction
Scene Change Detection
Transition Effect Detection
Transition Effect
Template Template Frame Determination
Pitching View Template Construction Pitching View
Template Pitching View
Detection
Candidate Highlight Segments
Highlight Classification
by HMM
Baseball Video Database
Training for Classification
Highlight Type
Ba Bb
Bc Bd
Aa Ab
Ac Ad
Bp
Reference frame Current frame
Bp’
Figure 2Constructing the DC frames for inter-coded frames.
estimation and marked by the dashed line in Figure 2. Given thatBpcovers parts ofBa,Bb,Bc, andBdwith areas
Aa,Ab,Ac, andAd, respectively, the DC coefficient ofBp,
i.e., DCBp, is estimated by
DCBp = 1 64
n∈{a,b,c,d}
{DCBn×An}. (1)
The DC coefficient of the residual blocks in Bp is
then decoded from the MPEG-compressed bit stream and added onto DCBp to form the estimated DC coefficient ofBp, i.e., DCBp, whose value is limited in [ 0, 255]. The similar procedure can be applied on B frames and we can acquire the estimated DC frames of the video segment of interest. Special care has to be paid on boundaries of a frame. After applying this process to all the blocks in inter-coded frames, we can obtain every DC frame of the video.
Scene changes
The procedure of our scene-change detection by using the MPEG features is as follows. We first extract the DC frames of I frames, Ii andIj, from the two adjacent
GOP’s, GOPi, and GOPj, respectively. We compute the
histograms ofIiandIjto form two vectors,hIiandhIj. The
distance ofhIiandhIjis calculated by
D(hIi,hIj)= 1−
255 c=0
hIi(c)hIj(c) 255
c=0hIi(c)255c=0hIj(c)
. (2)
IfD(hIi,hIj)is larger than a threshold TI, a scene change
is identified as occurring betweenIiandIj. Next, we
cal-culate the percentage of macroblocks that are intra-coded, denoted by Pr(pI), in all the P frames in GOPi. The P frame
with the largest Pr(pI), denoted byPm, is chosen and Pr(pmI)
is compared to the other threshold TP. If Pr(pmI) >TP, we
calculateD(hIi,hPm)to ensure thatIiandPmare not
sim-ilar frames. IfD(hIi,hPm) is larger than a threshold TD,
Pm will be chosen as the frame with scene change,Fc.
Otherwise,Ijwill be chosen asFc. We do not process B
frames at this stage because the accuracy is already good enough and the complexity can thus be reduced. In other words, the percentage of intra-coding in P frames serves as a pretty good indication of content fluctuations with smaller computational cost.
Template construction
Two templates will be constructed for each baseball game video, i.e., the transition effect template and pitching view template.
Transition effect template
Figure 3The percentage of intra-coding in P frames in one typical video segment containing transition effects and a slow-motion replay. The circles indicate the recorded percentages of intra-coding.
similar because the effects usually dominate in the frames and affect the coding in a similar manner.
After the compressed-domain shot boundary detection helps to determine the frame of shot change, the for-ward/backward extensions will then be made to establish the processing unit with several frames by the following procedures. From the scene-change frame,Fc, we search
backward and forward to find the temporary starting frame, Fs, and ending frame, Fe, of the processing unit.
We have to include more frames than necessary to expect that the entire transition effect is covered. Since the tran-sition effect is usually inserted when a play stops and that the scenes before and after the transition effect seldom contain large content variations, we select the frame as Fs (Fe) after we meet consecutiveN = 5 P frames with
Pr(PI) smaller than a threshold,Tu = 13, in the backward
(forward) search. A refinement process is then applied on
the constructed DC frames as follows: A transition effect is visually different from the scenes before and after it so we can remove a frame at the beginning (end) of the cur-rent processing unit if it is similar to the frame right before (after) it. To be more specific, in order to determine a suit-able starting frame of a processing unit, we check the color difference of the first two framesF1andF2by
D(F1,F2)= M
m=1
|DC
BF1
m −DCB F2
m| (3)
where BF1
m
BF2
m is the mth 8 × 8 block of F1(F2) and
Mis the number of blocks in a frame. If the difference is not large, we delete F1 from the processing unit and
make F2 become the starting frame to repeat the
pro-cess. The same procedure is applied at the end of the processing unit in the reverse order. We can thus ensure
(a)
(b)
(c)
(d)
(e)
(f)
(g)
(h)
(i)
(j)
(k)
(l)
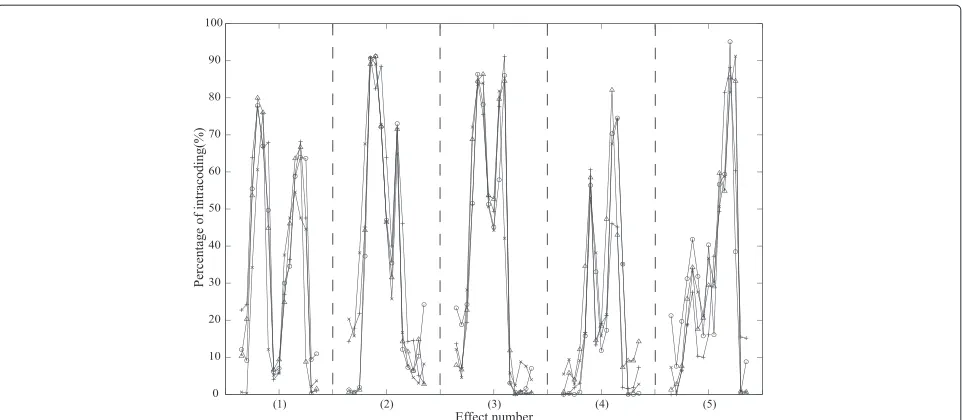
Figure 5The percentage of intra-coded macroblocks in the five transition effects.The circle, triangle, cross and plus signs indicate the data of different video segments of the same effect.
that the resulting first frame and last frame of the pro-cessing unit can be quite different from the preceding and following frames respectively after the refinement. In addition, we will remove/ignore the unit once the number of frames in the unit becomes less than a threshold value, Tl=60, to remove some normal scene changes and even
zoom-in/out shots. Finally, we will check the current and previous processing units and may merge the two units if they are overlapping.
Most transition effects are usually superimposed objects/logos on the video frames so when the artificial effect appears in a frame, certain parts of the scene in the ball game will also be revealed. The revealed ‘background’ pixels will complicate the identification of the ‘foreground’ transition effect so the pixels associated with the effect should be identified. In most of the cases, the background scenes before or after the effect may look quite different from the frames of the replay. Therefore, given that the starting and ending frames of the processing unit areFs
andFe respectively, we will pick the frame precedingFs
and the frame followingFeas the background frames. We
then compare the luminance DC values of all frames in the processing unit with those in the two background frames. If the DC difference at the same location in a frame and either one of the background frames is large, we mark this location as being covered by the transition effect. We can thus form a binary mask called ‘effect mask’ which indicates the pixel associated with the effect.
Next we will employ the refined processing units that are assumed to include transition effects for training the template. The cross-correlation and majority-voting approaches will be adopted to obtain the template, which
will be used to track all the slow-motion replays in the video. To be more specific, after marking the spatial loca-tions of an effect in each frame in the candidate processing units, we calculate the cross-similarity of mask positions and colors among these units for grouping. This process may be time-consuming since we need to not only calcu-late the similarity of masks/colors between each pair of the units but also temporally synchronize each pair. We choose to simplify this process by exploiting the probabil-ity of intra-coding, as shown in Figure 5, in which the same effects tend to have similar curves of intra-coding rates in P frames. In other words, the peaks in the curves will appear at the same frames in the processing units cover-ing the effects. We thus apply a one-dimensional matchcover-ing on these curves of intra-coding rates first. For each pair of processing units, (PUi,PUj), after recording the
intra-coding rates in P frames as vectors,siandsj, we zero-pad the vectors so that their lengths are the same and equal to a power of 2. Their (circular) cross-correlation [64] can be calculated efficiently via fast Fourier transform (FFT) by
Cintra(PUi, PUj)=IFFT(FFT(si)FFT(ˆsj)), (4)
whereindicates the point-by-point multiplication, and ˆ
sj is the flipping of sj. IFFT indicates the inverse fast Fourier transform. If Cintra(PUi, PUj) is larger than a
threshold, PUi and PUj are viewed as a candidate pair
and the index of the largest Cintra will help to roughly
synchronize PUiand PUj.
For a selected and roughly synchronized pair, PUiand
Figure 6The procedure of matching processing units.
to achieve a more accurate matching. The procedure is shown in Figure 6. We first extract the frame at the center of PUi,FC,0, and its adjacent frames, fromFC,K toFC,−K.
From these 2K+1 frames, the frame with the largest fore-ground,FL,0, will be picked as the anchor frame, which
will be compared or matched with the frames in PUj. This
strategy comes from the fact that a transition effect usu-ally looks more clearly and occupies a larger portion in the middle of its appearance.Kis empirically set as 8 to select one frame from the span of around half a second. One may think that a largerKshould provide us the better chance of obtaining a larger logo. Nevertheless, in many transition effects designed these days, the logo may occupy larger areas in frames at the end of its appearance but, at this moment, the logo is usually semi-transparent and can-not help to construct a good template. Therefore, we still prefer to find the logo in the middle of its appearance. Fur-thermore, since the contents of consecutive frames may be similar, in order to increase the accuracy of synchro-nization, we also include the other two frames,FL,Q and
FL,−Q, to form the three anchor frames for matching.Qis
set as 8 so that the three anchor frames can be slightly dif-ferent from each other and contain the logo as well. Then, we shift PUj ±8 frames, one frame at a time, and count
the matched foreground pixels in the corresponding three anchor frames. The mask/color matching is applied on the DC frames. The pixels are viewed as being matched if they are both in the foreground area and the difference of their colors is within 8. The largest number of matched pixels
will determine whether PUi and PUjare a synchronized
pair.
In the sportscast nowadays, slow-motion replays are usually sandwiched by two transition effects, which may be different. Therefore, one group (if a single logo is used) or two groups (if two different logos exist) of matched pro-cessing units will have obviously more propro-cessing units. Then, we choose one unit from the largest group and check the corresponding pixels of other units in the group. If the pixels in DC frames are both in the foreground areas and their luminance values are close, the location is ruled as being matched. The frame with the largest number of matched pixels is selected as the template frame, and the luminance mean at these matched positions in the units will be calculated to form the template. In fact, we adopt a more efficient way by iteratively forming the groups during the process of making processing units. In other words, a new processing unit will be compared with the existing ones to see if a synchronized pair can be found. We keep track of the numbers of matched units in groups and when this value in a certain group is larger than the threshold Tg = 4, we stop the collection of processing
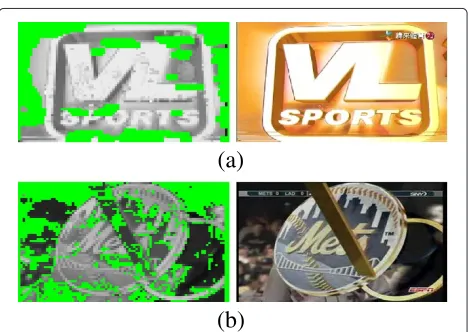
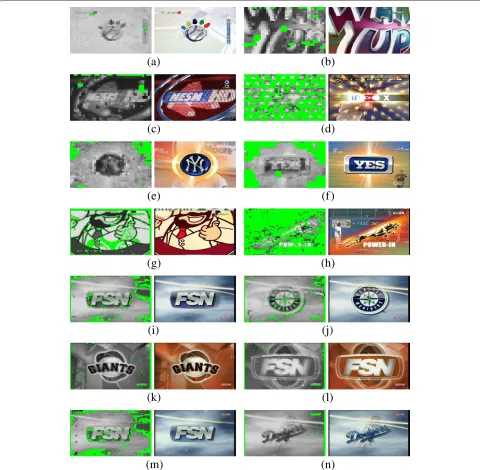
units and then simply construct the template by using the matched units. Two examples are shown in Figure 7, including the constructed template frames and the associ-ated video frames. The green pixels indicate the locations of background, which are not supposed to be related to the effect.
After the template frame is constructed, detecting all the transition effects for locating slow-motion replays can be done effectively. One possible way is to gener-ate the processing units by the similar procedures in the template training phase, that is, some refined process-ing units are extracted, and their DC frames are com-pared with the template frame based on the similarity of
(a)
(b)
colors and masks. Nevertheless, the misses of detecting the effects may occur. In order to find all the transition effects related to the slow-motion replays, we choose a rather conservative way by matching the frames near the detected scene-change frames with the template. Because the number of scene changes is large in a video, we employ the intra-coding rate of P frames to reduce such cases of matching. According to Figure 5, the intra-coding rate in a P frame is usually quite high. Therefore, when we con-struct the template of the transition effect in this video, we also calculate the average of the largest intra-coding rate in the effect and scale this value by a factor (0.7) as the threshold. Given a scene-change frame, we check the intra coding rates of P frames in around 2 seconds’ span. If the intra-coding rate of P frame is higher than this threshold, the matching of these DC frames with the template frame will be done to determine whether a transition effect hap-pens here. This method can effectively avoid skipping the possible transition effects and an efficient implementa-tion can also be achieved. Again, the matching is basically executed by comparing the luminance values of pixels covering the effect in the template frame.
Pitching view template
When the viewers browse the video, they may prefer to watch the plays displayed with a normal speed, instead of slow motion. Therefore, an appropriate starting posi-tion of real/normal plays of a game highlight should be located. Since a play in a baseball game always starts with the pitching view consisting of the pitcher, catcher, bat-ter, and umpire, we will try to locate the pitching view right before the detected transition effect, that is, after the transition effect is identified, we will trace back to find the pitching view by matching the data with a pitching view template, which will be again established for this spe-cific ball game. The other motivation of finding pitching views is related to the content analysis. It should be noted that designing a common model for the content identifi-cation/classification directly from slow-motion segments is challenging since the camera angles or the ways of dis-playing replays may vary considerably in ball games. In contrast, the video segments of real/normal plays exhibit more unified structures so the their analysis may lead to better results.
By observing that a pitching view shot usually appears within a few shots before a transition effect, we will collect a few scene-change frames before the transition effects. Because of the facts that the scenes of pitching views are almost the same in one game and that other views are essentially different from each other, we can apply the majority-voting strategy again to construct the pitching view template. We make use of the same training video segment in the construction of the effect template. To be more specific, after the transition effects are located, we
search backward from each transition effect to find several scene-change frames with the associated scene being rea-sonably long (longer than 1 s). The closest I frame within the scene will be selected, and the spatial feature will be extracted for the comparison. For anM×NDC frame of an I frame, the singular value decomposition is applied on the mean-removed block,XM×N, as
X=UVT =iN=1λiuivTi , (5)
whereui,viare the columns ofU,V, representing
eigen-vectors ofXXTandXTX, respectively, andis a diagonal matrix withλ1 ≥λ2 ≥...≥λN on the diagonal line. We
choose the first eigenvectors,u1andv1, as the extracted
feature of the block. As mentioned before, the pitching views of the same game tend to have a similar struc-ture. Therefore, we will group the features of selected shot change frames to build the template of pitching view. For each pair of candidate scene-change frames,Fci andFcj,
we calculate the correlation of ui and uj (vi and vj) to
obtain corUij(corVij).FciandFcjwill be in the same group
if the following conditions are satisfied:
|corUij| ≥ Ts
|corVij| ≥ Ts
|corUij+corVij| ≥ 2×Ts,
(6)
where Ts is empirically set as 0.9. The group with the
largest number of pairs will be employed to calculate the representative feature,umandvm, which are the median
values of the features in this group. In addition, the mean of these frames in the group, DCmean, will be calculated as
the threshold for rough screening.
The determination of the pitching view can then be applied in a straightforward manner. Our scheme simply searches the pitching view frame before a detected transi-tion effect as the starting positransi-tion of a possible highlight. If a given scene-change I frame has the mean color close to DCmean, its spatial features, ui/vi, will be extracted.
The correlation between ui/vi and um/vm is calculated
to determine whether the frame shows a pitching view according to the conditions of Equation 6. Since the pitch-ing view usually lasts for a while, to improve the accuracy, our scheme will identify the pitching view frame if at least three consecutive I frames are recognized as such frames. Figure 8 shows an example of detected pitching views from a one-inning video. We can see from this example that the template has to be resilient to the movements and uniforms of players, and such varying information as texts/numbers on the captions/score boxes.
Highlight classification
(a)
(b)
(c)
(d)
(e)
(f)
(g)
(h)
(i)
(j)
(k)
(l)
(m)
(n)
(o)
Figure 8Example of detected pitching views (a-o).
classifying the data so that more accurate game high-lights can be extracted. Our content analysis is based on HMM and the compressed-domain features will be employed for training our high-level semantic models, which help us to analyze the content more precisely. We collect several baseball videos and train the models off-line for the content classification in the investigated video. In our viewpoint, the content analysis here mainly serves as an illustration to show that if the transition effects can be retrieved reliably and the slow-motion replays are located, we should be able to analyze the contents more easily to determine the parts that the viewers really care. Many existing algorithms may also be employed and our method can help to further improve their performances since more suitable data are selected for processing.
After locating the transition effect and the associated pitching view, we will first examine the number of scene changes in the replay segment. If only one or two scenes exist, the event will be ruled as thenon-highlight event. Four types of highlight events are considered in our scheme, including base hit, score, out and special. The base hit events include base hits without scoring while the score events may contain hits with scoring, home runs and sacrifice hits, etc. The out events may repre-sent good defensive plays. Other plays such as double plays and errors are categorized in thespecialevents. We adopt the supervised training by HMM to classify the content, that is, we extract the video segments, each of which starting from the shot next to the pitching view to the shot right before the transition effect, from some
(a)
(b)
(c)
(d)
(e)
(f)
(g)
(h)
Figure 9Eight types of shots.(a) infield, (b) outfield, (c) home-base, (d) defense-infield, (e) player close-up, (f) player walking, (g) player running, and (h) others.
and several such frames indicate that the shot has zoom-ing operations. Again, the features we use are extracted from the data of MPEG bit stream to avoid the complex operations, such as object detection or complicated image processing procedures.
In the training phase of HMM, we have to evaluate the initial state probability,πi, theprioriprobability of each
view type, Pr(Si), and the conditional observation
proba-bility, Pr(Ok|Si), where 1≤i≤8 and 1 ≤k≤16. These
items can be estimated from the training data via the his-togram analysis. There are 16 observations since the shot will be classified into a long or short shot, a fast or slow shot, a shot containing the dominant color or not, and a shot with zooming or without. The thresholds are care-fully set according to the training videos. Given Pr(Si)and
Pr(Ok|Si), we can determine Pr(Si|Ok)by
Pr(Si|Ok)=
Pr(Ok|Si)×Pr(Si)
iPr(Ok|Si)×Pr(Si)
. (7)
The transition matrixAis an 8×8 matrix since eight states are defined. Each element,ai,jindicates the probability for
the model evolution from the stateSitoSj, i.e.,
ai,j=Pr[S(t)=Sj|S(t−1)=Si] , 1≤i,j≤8, (8)
wheretis the state or shot index and8j=1ai,j = 1. Due
to the fact that the shot types of training videos have been manually set, Acan also be computed in a rather auto-matic manner. A HMM model can thus be depicted by = (A,B,), in which the element ofB(the matrix of conditional observation probability) is bi,k = Pr(Ok|Si),
1 ≤i≤8 and 1≤k≤16. We will construct four HMM models for the four highlight types. Given an observation sequence,O = O(1)O(2) . . .O(T), whereT is the num-ber of states in the investigated video segment, we employ Viterbi algorithm to compute Pr(O|). To be more spe-cific, Viterbi algorithm considers the probability of the partial observation sequenceO(1)O(2) . . .O(t)(until the
timet), the state at the timet, S(t) = Si, and the given
model,, to compute a functionδi(t)as
δi(t)=Pr(O(1)O(2) . . .O(t),S(t)=Si|). (9)
We can then solveδi(t)inductively as follows:
• Initialization
δi(1)=πi×Pr(S(1)=Si|O(1)), 1≤i≤8. (10)
ϕi(1)=0, 1≤i≤8. (11)
• Induction
δj(t)=max
1≤i≤8[δi(t−1)ai,j]Pr(S(t)=Sj|O(t)), 2≤t≤T, 1≤i,j≤8. (12)
ϕj(t)=arg max
1≤i≤8[δi(t−1)aij] , 2≤t≤T, 1≤i≤8.
(13) • Termination
Pr(O|)= max
1≤i≤8[δi(T)] . (14)
S∗(T)=Sm, wherem=arg max
1≤i≤8[δi(T)] . (15)
• Track back
S∗(t)=Sϕm(t+1),givenS∗(t+1)=Sm,t=T−1,T−2, ..., 1.
(16)
Equation 10 initializes the functionδas the joint prob-ability of state Si and the initial observation O(1). The
induction step is illustrated in Figure 10, which shows the most probable path to stateSjthat is passed at the time
t from the 8 possible states, Si, 1 ≤ i ≤ 8, at the time
t−1. Sinceδi(t−1)is the probability of the joint event
S
11(t 1)
δ −
S
22(t 1)
δ −
S
N( 1) N t
δ −
S
11( )t
δ
S
j( ) j t δ
S
N( ) N t δ
…
…
…
…
…
…
S
i( ) i t δ
t-1
t
Figure 10Viterbi algorithm for HMM.
event thatO(1)O(2) . . .O(t)are observed, and stateSjis
reached att. Finding the maximal product over all the pos-sible statesSi, 1≤i≤8 att−1 results in the probability
ofSjat the time twith all the previous partial
observa-tions.δj(t)is then obtained by examining the observation O(t)in stateSj, i.e., by multiplying the maximal quantity
with the probability Pr(S(t) =Sj|O(t)). The computation
of Equation 12 is performed for all the statesj, 1≤j≤8, and is iterated fort=2, 3, ...,T. Finally, Equation 14 shows that Pr(O|)is the maximal of the terminal probabilities, δi(T). It is straightforward to determine which HMM can
best describe the observation sequence for the four s, that is, Viterbi algorithm is evaluated for each HMM and the one achieving the highest probability will be selected.
Experimental results
We collect ten baseball games recorded from the TV broadcasts of Chinese Professional Baseball League (CPBL) and Major League Baseball (MLB). The test videos have varying effects such as fading in/out, moving logos, deforming objects and full-frame transitions. We use these various forms of effects from different sources to verify the generality of the proposed method. The videos are compressed into MPEG-2 video streams with the res-olution of either 352×240 (videos 1 to 5) or 720×480 (videos 6 to 10). The frame rate is set as 30 fps (frames per second). In each video, we use the first inning of ball game
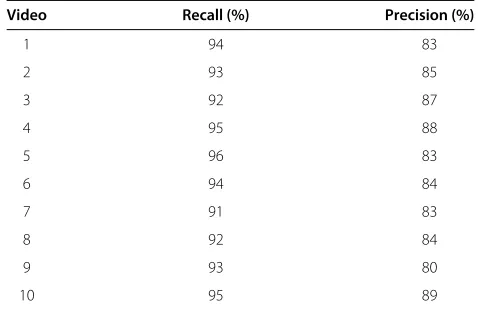
Table 1 The results of the scene-change detection
Video Recall (%) Precision (%)
1 94 83
2 93 85
3 92 87
4 95 88
5 96 83
6 94 84
7 91 83
8 92 84
9 93 80
10 95 89
to train the templates. Commercials are removed from the training segment to avoid building the templates based on repeatedly displayed advertisements. It should be noted that this issue may be settled by applying the automatic detection of commercials beforehand [65]. Then, we test our scheme in the first 60 min of the ball games, in which commercials are also removed to facilitate the analysis of data.
Scene-change detection
We first show the performances of our compressed-domain scene-change detection, which is important to the accuracy of template and pitching view extraction. To save time of examining scene changes by eyes, we use the first innings of videos for testing and the results are shown in Table 1. The precision rate is defined as the number of correct detections divided by the sum of correct and false detections. The recall rate is defined as the number of cor-rect detections divided by the sum of corcor-rect detections and misses. We can find that the recall probability of each
Table 2 The processing of transition effect detection
Video Number of Training time Number of Detection
number processing (second) candidates time
unit (second)
1 47 29 770 129
2 48 29 740 131
3 16 8 798 138
4 66 53 636 104
5 39 16 600 130
6 27 25 672 249
7 59 81 645 224
8 19 27 510 261
9 38 26 640 260
(a)
(b)
(c)
(d)
(e)
(f)
(g)
(h)
(i)
(j)
(k)
(l)
(m)
(n)
Figure 11Template frames.(a) Video 1 (CPBL, single logo), (b) video 2 (CPBL, single logo), (c) video 3 (MLB, single logo), (d) video 4 (MLB, single logo), (e) video 5 (MLB, logo 1), (f) video 5 (MLB, logo 2), (g) video 6 (CPBL, single logo), (h) video 7 (CPBL, single logo), (i) video 8 (MLB, logo 1), (j) video 8 (MLB, logo 2), (k) video 9 (MLB, logo 1), (l) video 9 (MLB, logo 2), (m) video 10 (MLB, logo 1), and (n) video 10 (MLB, logo 2).
video is higher than the precision probability. The high recall rates indicate that the misses of scene-change detec-tions are rare in this scheme. Although we may detect some wrong scene changes, it does not affect our scheme much, since the features of the additional shots will be further analyzed.
Transition effect detection
Table 2 shows some information of applying transition effect detection. The second column lists the numbers
Table 3 The results of the transition effect detection
Video Number Correct False Precision (%) Recall (%)
of effect
1 50 48 0 100 96
2 90 86 0 100 96
3 84 80 2 98 95
4 42 41 2 95 98
5 80 76 3 96 95
6 84 79 0 100 94
7 42 40 0 100 95
8 60 56 1 98 93
9 64 60 2 97 94
10 32 29 1 97 91
2 GB RAM (Intel, Sta. Clara, CA, USA). Although it is not easy to compare the efficiency of our scheme with other existing ones since the information of execution time was seldom reported, we think our scheme is pretty efficient as both the training and detection processes can be finished in a reasonably long period of time. The extracted tem-plate frames, along with the corresponding video frames, are demonstrated in Figure 11. The detection results of transition effect are then shown in Table 3. The second column shows the number of transition effects that appear in the test data, which are determined by the human eye. The third and fourth columns demonstrate the numbers of correct and false detections of transition effects, respec-tively. The average precision rate is as high as 98%, since the template is accurately determined, and the recall rate is 95%. Given that there are so many kinds of materials in baseball videos, the performance is quite good to ful-fill the requirements of our targeted application. The cases of misses come from the fact that the associated process-ing units are not included for the subsequent examination
because their scene changes are not detected. More flex-ible thresholds may reduce the number of misses at the expense of spending more time investigating the video data. The cases of false detections are usually the tran-sition effects that do not relate directly to slow-motion replays but to certain statistical information about the ball game. These effects may have a similar outlook with the targeted ones so the removal of these effects needs further content analysis. Furthermore, the uses of semi-transparent logos in the sportscast these days may make the constructed template less reliable, so the resulting errors may be increased a bit.
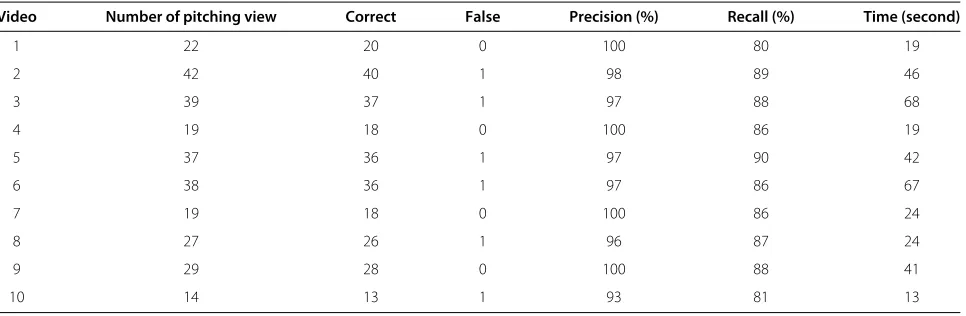
Pitching view detection
The experimental results of the pitching view detection are shown in Table 4. We tested the ten baseball games, in which the colors of the players’ jerseys, positions of the players, and textures of fields are different. The second column in Table 4 lists the numbers of traceable pitch-ing views in the test data, which are extracted accordpitch-ing to the detected transition effects. The third and fourth columns show the numbers of correct and false detections of pitching views, respectively. The misses happen when the targeted pitching view frames are not detected in the reverse search from the transition effects. The false detec-tions indicate that certain scenes are wrongly identified as the pitching view frames so the reverse search stops before reaching the targeted ones. We can see that the precision and recall rates are both high since the trained pitching view template effectively represents such scenes in the video. It is worth noting that the detection of pitch-ing views can also be done efficiently. The execution time is listed in the last column of Table 4 as the reference and it is around 36 s in average.
Highlight detection
The results of the highlight classification are shown in Table 5. The average precision and recall rates are 83%
Table 4 The results of the pitching view detection
Video Number of pitching view Correct False Precision (%) Recall (%) Time (second)
1 22 20 0 100 80 19
2 42 40 1 98 89 46
3 39 37 1 97 88 68
4 19 18 0 100 86 19
5 37 36 1 97 90 42
6 38 36 1 97 86 67
7 19 18 0 100 86 24
8 27 26 1 96 87 24
9 29 28 0 100 88 41
Table 5 The results of the highlight detection
Highlight Total Correct False Precision(%) Recall(%)
type
Base hit 40 35 8 81 89
Score 25 20 8 71 83
Out 57 43 9 83 80
Special 20 10 9 53 66
Non-highlight 130 118 12 91 91
and 85% respectively, which demonstrate that the HMM-based method can achieve reasonably good results. About 90% of thenon-highlightevents are correctly determined by checking the number of scenes in the replay segment. A brief comparison is shown in Table 6. Compared with the performances of existing HMM-based schemes [8,52], although our results may not be much superior, most of the other methods exploit the pixel-domain information or such high-level features as extracted objects/faces so that their computational complexity will be higher. We do believe that a more delicate training process in our scheme should help to improve the performance. In our opinion, HMM here serves as one potential approach for effec-tive highlight classification. The major contribution of this
Table 6 The comparison with other HMM-based highlight extraction schemes
Type Precision(%) Recall(%)
Our scheme Base hit 81 89
Score 74 83
Out 83 80
Special 50 66
Non-highlight 91 91
Chang et al. [8] Home run 71 83
Catch 68 75
Base hit 66 83
Infield play 40 67
Chen et al. [52] Single 83 80
Double 67 25
Pop-up 78 100
Fly-out 75 82
Foul-out 100 50
Ground-out 87 93
Two-base out 100 50
Foul ball 86 100
Double play 67 100
Home run 83 83
Home-base out 100 75
research is to extract the more meaningful video segments for analysis so that a practical implementation of high-light extraction is possible. More advanced methods for content classification can surely be coupled well with our scheme based on the transition effect detection.
Discussions
Some comments about our experiments are as follows: The detections of transition effects can provide us the video segments of interest, which have more unified struc-tures, so we can use low-level or MPEG-domain features for the effective content classification. Our research objec-tive is to design a practical highlight extraction scheme for digital video recorders so we still prefer to adopt the compressed-domain approach and employ the transition effect detection to exclude less possible data from process-ing. If the restrictions of complexity/cost are a bit relaxed, we may choose to expand/decode some frames and make use of high-level features to improve the performance of our content classification. The other concern is the several empirically set thresholds, which may be affected by such factors as bit rates and resolutions of videos. The prob-lem may become less serious if the manufacturer can test many videos, probably with different levels of compres-sion, recorded by this specific video recorder to decide suitable thresholds. In addition, since the same transi-tion effect will appear repeatedly in the recorded video, the methodology of majority voting is quite effective. We may also adjust the thresholds during the training pro-cess to ensure that a template can be sucpro-cessfully made. Nevertheless, commercials have to be excluded from the training process because the same commercial may also appear several times. These commercials may not cause problems in the detection phase though. Finally, there exists a trade-off between execution speed and accuracy. To avoid missing the detections of effects, we may select more candidate frames for testing with the cost of more computation. The same issue exists in the template con-struction. The more processing units are considered when constructing the template, the better quality the tem-plate frame will be and the more execution time will be expected. The major drawback of this work is that our scheme only works on the sports videos with transition effects, although we think that the usage of transition effects is a trend in sportscast nowadays.
Conclusions
used to detect the effects in the entire game. After the transition effects are identified, the positions of slow-motion replays can be located and the suitable starting positions of possible video highlights before the replay will be detected by our pitching view model. The video seg-ments of interest can be further analyzed by the trained HMMs to determine which type of highlights the seg-ments belong to. Experimental results demonstrate this promising research direction. We believe that the pro-posed scheme can be coupled with many existing content analysis algorithms in sports videos to either speed up or improve the performance. The feasibility of the research is illustrated by using baseball videos, and the idea should be applicable to other sports. Since the proposed scheme only utilizes the features extracted/calculated from the MPEG bit stream, we believe that a cost-effective imple-mentation in consumers’ digital video recorders could be achievable.
Competing interests
The authors declare that they have no competing interests.
Acknowledgements
This research is supported by the National Science Council in Taiwan, under grants NSC97-2221-E-008-072 and NSC101-2221-E-008-121.
Received: 6 August 2012 Accepted: 10 April 2013 Published: 4 May 2013
References
1. A Hanjalic, Adaptive extraction of highlights from a sport video based on excitement modeling. IEEE Trans. Multimedia.7(6), 1114–1122 (2005) 2. D Tjondronegoro, YP Chen, B Pham, inThe 5th International ACM
Multimedia Information Retrieval Workshop. Sports video summarization
using highlights and play-breaks, (ACM, New York, 7 November 2003) 3. A Kokaram, N Rea, R Dahyot, M Tekalp, P Bouthemy, P Gros, I Sezan,
Browsing sports video: trends in sports-related indexing and retrieval work. IEEE Signal Process. Mag.23(2), 47–58 (2006)
4. J Assfalg, M Bertini, C Colombo, A del Bimbo, W Nunziati, Semantic annotation of soccer videos: automatic highlights identification. Comput. Vis. Image Unders.92(2-3), 285–305 (2003)
5. D Tjondronegoro, YP Chen, B Pham, Integrating highlights for more complete sports video summarization. IEEE Multimedia.11(4), 22–37 (2004)
6. M Petkovic, V Mihajlovic, W Jonker, S Djordjevic-Kajan, inIEEE
International Conference on Multimedia and Expo. Multi-modal extraction
of highlights from TV Formula One programs, (Lausanne, 26–29 Aug 2002), pp. 817–820
7. J Assfalg, M Bertini, ABimbo, W Nunziati, P Pala, inIEEE International
Conference on Multimedia and Expo. Soccer highlights detection and
recognition using HMMs, (Lausanne, 26–29 August 2002), pp. 825–828 8. P Chang, M Han, Y Gong, inIEEE International Conference on Image
Processing, vol. 1. Extract highlights from baseball game video with
Hidden Markov models, (Rochester, 22–25 September 2002), pp. 609–612 9. CC Cheng, CT Hsu, Fusion of audio and motion information on
HMM-based highlight extraction for baseball games. IEEE Trans Multimedia.8(3), 585–599 (2006)
10. HT Chen, CL Chou, WC Tsai, SY Lee, BSP Lin, HMM-based ball hitting event exploration system for broadcast baseball video. J Vis. Commun. Image Representation.23(5), 767–781 (2012)
11. LY Duan, M Xu, Q Tian, C Xu, JS Jin, A unified framework for semantic shot classification in sports video. IEEE Trans. Multimedia.7(6), 1066–1083 (2005)
12. X Wang, S Xie, H Chen, inInternational Conference on Computational
Intelligence and Software Engineering. An algorithm of soccer goal
extraction by using shot features (Wuhan, 11–13 December 2009), pp. 1–4 13. R Ren, JM Jose, in16th IEEE International Conference on Image Processing.
Temporal salient graph for sports event detection (Cairo, 7–10 November 2009), pp. 4313 – 4316
14. HC Shih, CL Huang, MSN: statistical understanding of broadcasted baseball video using multi-level semantic network. IEEE Trans. Broadcasting.51(4), 449–459 (2005)
15. L Lu, H Jiang, H Zhang, inthe ninth ACM international conference on
Multimedia. A robust audio classification and segmentation method (ACM
Multimedia, Ottawa, 30 September 2001–5 October 2001), pp. 203–211 16. Y Rui, A Gupta, A Acero, inThe 8th ACM International Conference on
Multimedia. Automatically extracting highlights for TV baseball programs
(ACM Multimedia, Los Angeles, 30 October 2000–3 November 2000), pp. 105–115
17. Z Xiong, R Radhakrishnan, A Divakaran, TS Huang, inIEEE International
Conference on Acoustics, Speech, and Signal Processing, vol. 5. Audio events
detection based highlights extraction from baseball, golf and soccer games in a unified framework, (Hong Kong, April 2003), pp. 401–404 18. D Zhang, D Ellis, Detecting sound events in basketball video archive.
Technical Report, Electrical Engineering Department of Columbia University, 2001
19. J Liu, Y Dong, J Huang, X Zhao, H Wang, in2nd IEEE International
Conference on Broadband Network and Multimedia Technology. Sports
audio classification based on MFCC and GMM, (Beijing, October 2009), pp. 482–485
20. Y Zhong, H Zhang, AK Jain, Automatic caption localization in compressed video. IEEE Trans. Pattern Anal. Mach. Intell.22(4), 385–392 (2000) 21. D Zhang, RK Rajendran, SF Chang, inIEEE International Conference on
Image Processing, vol. 1. General and domain-specific techniques for
detecting and recognizing superimposed text in video, (Rochester, 2002), pp. 593–596
22. D Zhang, SF Chang, inProceedings of the tenth ACM international
conference on Multimedia. Event detection in baseball video using
superimposed caption recognition, Juan Les, Pins (ACM Multimedia, New York, 1–6 December 2002)
23. GG Lee, HK Kim, WY Kim, inIEEE International Conference on Multimedia
and Expo. Highlight generation for basketball video using probabilistic
excitement, (New York, 28–June 2009 to 3 July 2009), pp. 318–321 24. C Jung, J Kim, Player information extraction for semantic annotation in
golf videos. IEEE Trans. Broadcasting.55, 79–83 (2009)
25. JC Boulton, Two mechanisms for the detection of slow motion. J. Opt. Soc. Am.: Optics, Image Science, and, Vision.4(8), 1634–1642 (1987) 26. L Wang, X Liu, S Lin, GY Xu, HY Shum, inIEEE International Conference on
Image Processing. Generic slow-motion replay detection in sports video,
Singapore, (24), pp. 1585–1588
27. X Ruan, S Li, Y Dong, J Feng, inChinese Conference on Pattern Recognition. Study on highlights detection in soccer video based on the location of slow motion replay and goal net recognition, (Beijing, 22–24 October 2008), pp. 1–6
28. H Pan, PV Beek, MI Sezan, inIEEE International Conference on Acoustics,
Speech and Signal Processing. Detection of slow-motion replay segments
in sports video for highlights generation, (Salt Lake City, 7–11 May 2001), pp. 1649–1652
29. V Kobla, D Dementhon, D Doermann, inIEEE Workshop on Multimedia
Signal Processing. Detection of slow-motion replay sequences for
identifying sports videos, (Copenhagen, 13–15 September 1999), pp. 135–140
30. J Wang, E Chng, C Xu, inIEEE International Conference on Acoustics, Speech,
and Signal Processing. Soccer replay detection using scene transition
structure analysis, (18–23 March 2005), pp. 433–436
31. EJ Farn, LH Chen, JH Liou, A new slow-motion replay extractor for soccer game videos. Int. J. Pattern Recognit, Artif. Intell.17, 1467–1481 (2003) 32. R Lienhart, A Zaccarin, inIEEE International Conference on Image Processing.
A system for reliable dissolve detection in videos, (Thessaloniki, 7–10 October, 2001), pp. 406–409
34. C Snoek, M Worring, Multimodal video indexing: a review of the state-of-the-art. Multimedia Tools and Appl.25, 5–35 (2005) 35. Y Song, W Wang, inThird International Conference on Multimedia and
Ubiquitous Engineering. Unified sports video highlight detection
based on multi-feature fusion, (Qingdao, 4–6 June 2009), pp. 83–87 36. HG Kim, J Jeong, JH Kim, JY Kim, Real-time highlight detection in baseball
video for TVs with time-shift function. IEEE Trans Consum. Electron.54(2), 831–838 (2008)
37. LC Chan, YS Chen, RW Liou, CH Kuo, CH Yeh, BD Liu, inIEEE International
Symposium on Circuits and Systems. A real time and low cost hardware
architecture for video abstraction system, (Los Angeles, 27–30 May 2007), pp. 773–776
38. J Shen, D Tao, X Li, Modality mixture projections for semantic video event detection. IEEE Trans. Circuits Syst. Video Technol.18(11), 1587–1596 (2008)
39. D Xu, SF Chang, Video event recognition using kernel methods with multilevel temporal alignment. IEEE Trans. Pattern Anal. Mach. Intell. 30(11), 1985–1997 (2008)
40. X Zhou, X Zhuang, S Yan, SF Chang, M Hasegawa-Johnson, TS Huang, in
Proceedings of the 16th ACM international conference on Multimedia.
SIFT-bag kernel for video event analysis, Vancouver, British Columbia (ACM Multimedia, New York, 2008), pp. 229–238
41. M Bertini, R Cucchiara, AD Bimbo, A Prati, Semantic adaptation of sport videos with user-centred performance analysis. IEEE Trans. Multimedia. 8(3), 433–443 (2006)
42. HC Shih, JN Hwang, CL Huang, Content-based attention ranking using visual and contextual attention model for baseball videos. IEEE Trans. Multimedia.11(2), 244–255 (2009)
43. G Zhu, Q Huang, C Xu, L Xing, W Gao, H Yao, Human behavior analysis for highlight ranking in broadcast racket sports video. IEEE Trans on, Multimedia.9(6), 1167–1182 (2007)
44. G Zhu, C Xu, Q Huang, Y Rui, S Jiang, W Gao, H Yao, Event tactic analysis based on broadcast sports video. IEEE Trans. on Multimedia.11, 49–67 (2009)
45. Z Niu, X Gao, Q Tian, Tactic analysis based on real-world ball trajectory in soccer video. Pattern Recognit.45(5), 1937–1947 (2012)
46. GT Papadopoulos, A Briassouli, V Mezaris, I Kompatsiaris, MG Strintzis, Statistical motion information extraction and representation for semantic video analysis. IEEE Trans. Circuits and Syst. for Video Technol.19(10), 1513–1528 (2009)
47. E Kijak, L Oisel, P Gros, inIEEE International Conference on Image Processing, vol. 2. Hierarchical structure analysis of sport videos using HMMs, (Barcelona, 14–17 September 2003), pp. 1025–1028
48. K Namuduri, inFirst International Communication Systems and Networks
and Workshops. Automatic extraction of highlights from a cricket video
using MPEG-7 descriptors, (Bangalore, 5–10 January 2009), pp. 1–3 49. NH Bach, K Shinoda, S Furui, in2005 International Conference on Image
Processing. Robust highlight extraction using multi-stream hidden Markov
models for baseball video, (Genoa, 11–14 September 2005), pp. 173–176 50. J Wang, C Xu, E Chng, Q Tian, in2004 IEEE International Conference on
Multimedia and Expo, vol. 1. Sports highlight detection from keyword
sequences using HMM, (Taipei, 30 June 2004), pp. 599 – 602 51. M Delakis, G Gravier, P Gros, in2006 IEEE 8th Workshop on Multimedia
Signal Processing. Score oriented Viterbi search in sport video structuring
using HMM and segment models, Cairns, (3), pp. 484–487
52. HT Chen, CL Chou, WC Tsai, SY Lee, BSP Lin, HMM-based ball hitting event exploration system for broadcast baseball video. J Vis. Commun. Image Representation.23, 767–781 (2012)
53. RE Ouazzani, ROH Thami, inInternational Conference on Multimedia
Computing and Systems. Highlights recognition and learning in soccer
video by using Hidden Markov Models and the Bayesian theorem, (Ouarzazate, 2–4 April 2009), pp. 304–308
54. Y Ding, G Fan, Sports video mining via multichannel segmental Hidden Markov Models. IEEE Trans. on Multimedia.11(7), 1301–1309 (2009) 55. Tang H, V Kwatra, ME sargin, U Gargi, inIEEE International Conference on
Multimedia and Expo. Detecting highlights in sports videos: cricket as a
test case, (Palo Alto, California, 11–15 July 2011)
56. H Pan, B Li, MI Sezan, inIEEE International Conference on Acoustics, Speech,
and Signal Processing. Automatic detection of replay segments in
broadcast sports programs by detection of logos in scene transitions, (Orlando, Florida, 13–17 May 2002), pp. 3385–3388
57. X Tong, H Lu, Q Liu, H Jin, inThird International Conference on Image and
Graphics (ICIG). Replay detection in broadcasting sports video, (Hong
Kong, 18–20 December 2004), pp. 337–340
58. PC Su, YW Wang, CC Chen, inSPIE Optics East. Transition logo detection for sports videos highlight extraction, (Boston, Massachusetts, 1–5 October 2006), pp. 63910S1–63910S9
59. Z Zhao, J Shuqiang, H Qingming, Z Guangyu, inProceedings in the IEEE
International Conference on Multimedia and Expo. Highlight summarization
in sports video based on replay detection, (Toronto, Ontario, 9–12 July 2006), pp. 1613–1616
60. Z Dang, J Du, Q Huang, S Jjiang, inFourth International Conference on
Image and Graphics. Replay detection based on semi-automatic logo
template sequence extraction in sports video, (Chengdu, 22–24 August 2007), pp. 839–844
61. W Li, S Chen, H Wang, inInternational Conference on Computational
Intelligence and Software Engineering. A rule-based sports video event
detection method, (Wuhan, 11–13 December 2009), pp. 1–4 62. W Xu, Y Yi, A robust replay detection algorithm for soccer video. IEEE
Signal Process. Lett.18(9), 509–512 (2011)
63. F Zhao, Y Long, Z Wei, H Wang, inIEEE International Conference on
Acoustics, Speech and Signal Processing. Matching logos for slow motion
replay detection in broadcast sports video, (Kyoto, 25–30 March 2012), pp. 1409–1412
64. RA Roberts, CT Mullis,Digital Signal, Processing. (Addison Wesley, Reading, MA, 1987)
65. B Satterwhite, O Marques, Automatic detection of TV commercials. IEEE Potentials.23(2), 9–12 (2004)
doi:10.1186/1687-5281-2013-27
Cite this article as:Suet al.:Transition effect detection for extracting high-lights in baseball videos.EURASIP Journal on Image and Video Processing2013
2013:27.
Submit your manuscript to a
journal and benefi t from:
7Convenient online submission
7Rigorous peer review
7Immediate publication on acceptance
7Open access: articles freely available online
7High visibility within the fi eld
7Retaining the copyright to your article