NOTE
Y. Sudiyani
Research and Development Center for Applied Physics, LIPI, Serpong, Tangerang 13510, Indonesia
Y. Imamura
Wood Research Institute, Kyoto University, Kyoto 611-0011, Japan S. Doi · S. Yamauchi (*)
Institute of Wood Technology, Akita Prefectural University, Kaieisaka, Noshiro, Akita 016-0876, Japan
Tel. ⫹81-185-52-6984; Fax ⫹81-185-52-6976 e-mail: sigeru@iwt.akita-pu.ac.jp
Yanni Sudiyani · Yuji Imamura · Shuichi Doi Shigeru Yamauchi
Infrared spectroscopic investigations of weathering effects on the surface of
tropical wood
Received: October 22, 2001 / Accepted: February 20, 2002
Introduction
Rapid deterioration with outdoor exposure is a major disad-vantage to the use of wood and wood-based materials for engineering and structural applications. Indoors, the char-acteristic appearance of wood surfaces changes little in the short term. Outdoors, however, changes in color and tex-ture proceed rapidly. The weathering of wood is caused by the combined effects of sunshine, rainfall, oxygen and other reactive species, dust, and variations of temperature and moisture.1,2
Solar irradiation containing ultraviolet (UV) rays is a dominant factor causing depolymerization of lignin in the cell wall matrix, and the subsequent washing away of decomposition products by rainfall facilitates erosion.
Clarification of the changes in wood properties caused by weathering is of fundamental importance to improved weatherability. We have investigated the weathering effects on sugi (Cryptomeria japonica D. Don), a softwood spe-cies cultivated in Japan, and albizia (Paraserianthes falcata
Becker), a fast-growing hardwood species in the tropics.3,4
To explore the chemical changes of wood constituents near the weathered surface, infrared and electron spin resonance (ESR) spectroscopic techniques were employed in addi-tion to chemical analysis. Significant findings have been reported.4
However, better use could not be made of in-frared spectroscopy for analysis of wood surfaces, as the infrared spectra were obtained by a transmission method.
With improved spectrometers and accessories and estab-lishment of a mathematical process utilizing the Fourier transformation, several infrared spectroscopic tech-niques such as diffuse reflectance,5–10 attenuated total reflec-tance,11,12
and photoacoustic method9,13
have been applied to studies of wood and wood-based materials.
In this study the infrared spectra of five tropical wood species were measured by photoacoustic and diffuse reflec-tance techniques to obtain more information about the wea-thered surfaces of wood. Reported herein are the infrared spectra for tropical wood species weathered in Indonesia. Also presented are line maps of the diffuse reflectance spectra in the vertical direction obtained by microscopy.
Abstract Two Fourier transform infrared spectroscopic
techniques, photoacoustic and diffuse reflectance spectros-copy, were utilized to explore the physical and chemical changes in wood caused by weathering. Five tropical wood species (albizia, kapur, mahoni, nangka, puspa) were ex-posed to natural weathering for various periods. The con-tents of extracts, phenolics, and Klason lignin in unexposed samples of these wood species were determined by chemical analysis. Infrared spectra of the weathered surfaces were recorded by the two techniques. The photoacoustic spectra exhibited rapid decomposition and elusion of wood con-stituents containing benzene rings in the region closest to the exposed surface. Line maps of infrared spectra in the vertical direction obtained by diffuse reflectance infrared microspectroscopy were consistent with the view that the additive effects of water and ultraviolet irradiation play an important role in destroying the lignin-hemicellulose matrix of the cell wall. The infrared spectroscopic techniques are available for the analysis of weathered wood.
Key words Weathering · Surface · Infrared spectroscopy ·
Materials and methods
Wood samples
Twenty-four heartwood blocks measuring 45 mm (L) ⫻
45 mm (T) ⫻ 3 mm (R) were cut from each tropical wood
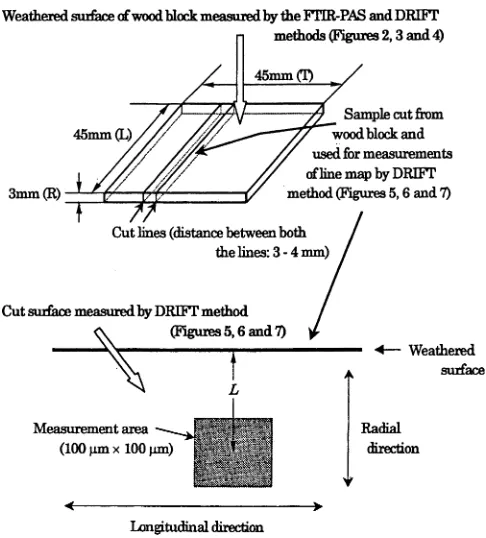
species. Table 1 summarizes the common, scientific, and family names, densities, and original colors of wood species used in this study. The tangential surface of the blocks was flattened and smoothed with a planer machine and subse-quently exposed to natural weathering. Figure 1 depicts the wood block and a sample cut from the block that was used for measuring the line map by diffuse reflectance infrared Fourier transform (DRIFT) microspectroscopy.
Chemical analysis
Hot water extractions of wood samples were carried out
according to ASTM-D 110–84.14
Wood powder passed
through an 80-mesh sieve was introduced together with deionized water into a flask attached to a reflux condenser. The flask was gently heated for 3 h. The yield of hot water extracts was calculated from the weight loss of the wood powder after the extraction.
Ethanol–benzene extracts were obtained by successive extraction of the wood powder in a Soxhlet extractor using an ethanol–benzene (1 : 2, v/v) mixture as a solvent for more than 24 h until the eluent became colorless. The yield of the extracts was measured after oven-drying at 105°C for 6 h.
For determining Klason lignin, the wood powder re-maining after extraction by ethanol–benzene was hydro-lyzed with sulfuric acid at ambient temperature for 2 h. The resulting mixture was diluted with water and autoclaved at 120°C for 2 h. Subsequently, the insoluble substance was separated with a glass filter and then dried at 105°C for 6 h. The wood powder extracted by benzene was refluxed in water for 3 h, filtered, and then washed with boiling water six times. The whole filtrate was boiled with hydrochloric acid and formaldehyde solution for 30 min. To determine the phenolics content, the precipitate that resulted after boiling was filtered and dried at 105°C for 2 h. The mean value for each chemical analysis was obtained from three replications.
Natural weathering conditions
Test blocks of all the tropical wood species were exposed in Serpong, Indonesia for 2–32 weeks (September 2000 to April 2001) at an inclination of 5° from the horizontal facing east, at a height of 1 m above the ground. The meteoro-logical data obtained during the exposure test are given in Table 2. The test blocks were set outside without any cover from the rain and wind. All the exposure tests started on September 1, 2000.
Infrared analysis
Fourier transform infrared photoacoustic spectroscopy
Fourier transform infrared photoacoustic spectroscopy (FTIR-PAS) spectra were measured using a JEOL JIR 7000 W spectrometer connected to an IR-PAS module (IR/ PAS 1000). All the spectra were obtained at 100 times accu-mulation and with a spectral resolution of 4 cm⫺1
. A circular piece 9 mm in diameter (thickness about 1 mm) was cut from the midsection of the weathered surface of each wood block and set in a thin cell of 10 mm diameter. Photo-acoustic signals were collected on purging a cell bench with
Table 1. Names, densities, and original colors of heartwood samples
Common name Scientific name Family name Air-dried density (g/cm3) Original color
Albizia Paraserianthes falcata Becker Leguminoceae 0.38 Light brown
Kapur Dryobalanop lanceolata Burck Dipterocarpaceae 0.77 Dark brown
Mahoni Switenia macrophylla King Meliaceae 0.65 Bright brown
Nangka Artocarpus heterophyllus Lamk Moraceae 0.69 Yellow
Puspa Schima wallichii Korth Theaceae 0.70 Pale brown
dry nitrogen. The velocity of the moving mirror was fixed at 1.6 mm/s through all the measurements. Carbon black was used as a reference sample.
DRIFT microspectroscopy
DRIFT spectra were recorded using the spectrometer equipped with a liquid nitrogen-cooled MCT detector and through a Nikon optical microscope (total magnification 400⫻). The apertures and step size were set at 100 ⫻ 100µm
and 50µm, respectively. Fifty scans were summed in each
spectrum at 4 cm⫺1
resolution. The spectra were obtained by measuring the center of the weathered surface of the circu-lar piece used for the PAS measurement. The line map of diffuse reflectance spectra was measured on a cut surface in the vertical direction (Fig. 1). The spectra were ratioed against an Au mirror background.
Results and discussion
FTIR-PAS
The FTIR-PAS technique probes mainly wood samples within a short distance from the surface. The distance is determined by the shorter of two lengths (thermal and optical wave decay lengths). The former (thermal sensing depth d) is controllable by the moving mirror velocity and
for an opaque sample such as wood is calculated9,13 by
d ⫽ 1/as⫽ (D/pgv) 1/2
, where as is the thermal wave decay
coefficient, D is the thermal diffusivity of the sample, g is the moving mirror velocity, and v is the frequency. The velocity of the moving mirror in this study was adjusted to 1.6 mm/s, and the typical thermal diffusivity of wood is 2.0 ⫻ 10⫺3
cm2
/s.13
According to calculations with these
values, the thermal sensing depth ranges between 14µm
(2000 cm⫺1) and 22µm (800 cm⫺1).
The latter length, the optical sensing depth (1/α), is rep-resented as a reciprocal of the optical wave decay
coeffi-cient (α) depending on the wavenumber; it ranges from
about 5µm (2000 cm⫺1) to 12–13µm (800 cm⫺1) for a typical
wood sample.13
In practice, it is difficult to evaluate the actual thermal and optical sensing depths accurately be-cause wood is a porous, anisotropic material and the D
value varies with weathering in the neighborhood of the surface. It is possible, however, to use the d and 1/α values as tentative criteria for surface analysis of weathered wood. Thus the weathering effects were investigated on the as-sumption that the FTIR-PAS spectra in the wavenumber
region probed the samples within a depth of about 20µm
from the weathered surface.
The results of chemical analysis of the unexposed wood samples are summarized in Table 3. Nangka and mahoni have more extracts and phenolics than the other three species, so the tropical wood species used in this study can roughly be divided into two groups based on extract contents.
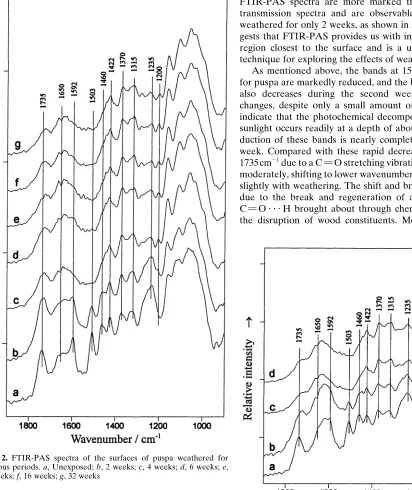
Figures 2 and 3 show the FTIR-PAS spectra of the sur-faces of puspa and nangka weathered for various periods, respectively. The unexposed samples were similar to each other in terms of spectral contour except for the relative intensity of the bands at about 1650 cm⫺1
, which are
attrib-uted to a stretching vibration of C⫽O conjugated with an
aromatic ring,15,16 and at 1460 cm⫺1, which is assigned to
deformation of CH3 and CH2. Other wood species closely
resembled puspa in terms of the spectral outline, and their bands at 1650 cm⫺1
were not as strong as that of nangka. The large total amount of ethanol–benzene extract, lignin, and phenolics in nangka (Table 3) is presumably one reason for such a strong band at 1650 cm⫺1
.
Inspection of the spectra in Figs. 2 and 3 reveals that the two wood species show the same spectral changes on weathering. The intensities of the bands at 1735, 1592, 1503, 1460, and 1235 cm⫺1
apparently decrease; and some nearly disappear as exposure proceeds. According to previous studies,17–19
the band at 1735 cm⫺1
is mainly due to xylan, the
bands at 1460 and 1235 cm⫺1
are caused by both lignin and xylan, and the bands at 1592 and 1503 cm⫺1
are attributed to the benzene ring in lignin. By contrast, the vibrations at 1422, 1370, and 1315 cm⫺1, which are primarily due to cellu-lose, demonstrate no marked change in the FTIR-PAS spectra. In addition, a weak band seems to appear at about 1200 cm⫺1
.
The same spectral changes were also observed for other wood species and are compatible with the results of the infrared analysis by the transmission method for weathered albizia.4
Hence the chemical changes of wood constituents indicated in our previous report fundamentally apply to all the wood species in this study. However, the changes in
Table 2. Meteorological data at Serpong, Indonesia during the exposure test
Measurement duration Temperature(°C) Average Rainfall (mm) UV irradiation (kJ/m2)
Min. Max. Ave.
RH (%)
Total Per week Total Per week
Sept. 1–14, 2000 (2 weeks) 26.6 28.0 27.3 85.0 4 2 8 125 4063
Sept. 15–28, 2000 (2 weeks) 26.0 27.4 26.7 87.3 108 52 15 508 3692
Sept. 29–Oct. 12, 2000 (2 weeks) 25.7 27.0 26.4 90.1 211 52 23 248 3870
Oct. 13–26, 2000 (2 weeks) 26.0 27.6 26.9 89.0 296 43 31 638 4195
Oct. 27–Dec. 21, 2000 (8 weeks) 25.9 27.2 26.6 90.8 656 45 67 317 4460
Dec. 22, 2000–April 12, 2001 (16 weeks) 25.5 26.6 26.0 92.8 1807 72 135 265 4247
Table 3. Chemical analysis of five wood species
Wood Hot water EtOH–benzene Klason Phenolics
species extracts (%) extracts (%) lignin (%) (%)
Albizia 4.30 (0.15) 2.28 22.69 (1.82) 1.16 (0.05)
Kapur 4.62 (0.38) 2.30 29.79 (0.51) 1.77 (0.10)
Mahoni 8.06 (0.08) 5.73 25.73 (0.04) 7.16 (0.18)
Nangka 8.63 (0.28) 12.08 28.01 (0.11) 7.98 (0.35)
Puspa 4.38 (0.51) 1.98 24.28 (0.85) 0.25 (0.05)
Values in parentheses are standard deviations Ethanol–benzene extracts have no replication Fig. 2. FTIR-PAS spectra of the surfaces of puspa weathered for various periods. a, Unexposed; b, 2 weeks; c, 4 weeks; d, 6 weeks; e, 8 weeks; f, 16 weeks; g, 32 weeks
Fig. 3. FTIR-PAS spectra of the surfaces of nangka weathered for various periods. a, Unexposed; b, 8 weeks; c, 16 weeks; d, 32 weeks
FTIR-PAS spectra are more marked than those in the transmission spectra and are observable in the samples weathered for only 2 weeks, as shown in Fig. 2b. This sug-gests that FTIR-PAS provides us with information on the region closest to the surface and is a useful, convenient technique for exploring the effects of weathering on wood.
As mentioned above, the bands at 1503 and 1460 cm⫺1
for puspa are markedly reduced, and the band at 1592 cm⫺1
also decreases during the second week. Such spectral changes, despite only a small amount of rainfall (4 mm), indicate that the photochemical decomposition caused by
sunlight occurs readily at a depth of about 20µm. The
re-duction of these bands is nearly completed by the fourth week. Compared with these rapid decreases, the band at 1735 cm⫺1
due to a C⫽O stretching vibration17–19
diminishes moderately, shifting to lower wavenumbers and broadening slightly with weathering. The shift and broadening may be due to the break and regeneration of a hydrogen bond
C⫽O . . . H brought about through chemical change and
shapes at 1735 and 1235 cm⫺1
seem to vary continuously with outdoor exposure after the fourth week.
The bands at 1592, 1503, and 1460 cm⫺1
for albizia and kapur were observed to disappear rapidly with weathering.
For albizia, even the bands at 1735 and 1235 cm⫺1
showed little spectral change after the eighth week.
It is well known that a band position at about 1600 cm⫺1
due to skeletal stretching vibration of the benzene ring is not particularly susceptible to substituent groups. There-fore, reduction of the band intensity at 1592 cm⫺1
indicates removal or decomposition of an aromatic ring rather than a chemical change in atomic groups on or around the aro-matic ring. By contrast, the variations of line shapes at 1735
and 1235 cm⫺1 correspond to the various changes at the
molecular level, decomposition, disordering, rearrange-ment, and elusion of wood constituent polymers because they show not only a reduction of band intensity but also a shift in band position.
The FTIR-PAS spectra of nangka (Fig. 3) demonstrate the same changes as those of puspa, described earlier. In contrast to puspa, however, the bands at 1503 and
1460 cm⫺1, prominently due to lignin and phenolics, still
decrease clearly from the 8th to the 16th week. During this period a similar but smaller decrease in the bands was ob-served for mahoni.
Based on the results of FTIR-PAS, the order in terms of spectrum-changing duration by weathering can be assumed
to be as follows: nangka ⬎ mahoni ⬎ puspa, kapur ⬎
albizia. This order is almost in agreement with that for the total amount of lignin, phenolics, and extracts summarized in Table 3. Albizia presumably has the smallest amount because it has by far the lowest density (Table 1). Thus it can be presumed that the primary spectral changes corre-spond to the elusion of extracts and phenolics and the par-tial decomposition of a lignin polymer at a relatively early stage of weathering because FTIR-PAS spectra provide information on only the region closest to the weathered surface, although the chemical changes in other wood constituents certainly have some effect on the spectra.
DRIFT microspectroscopy
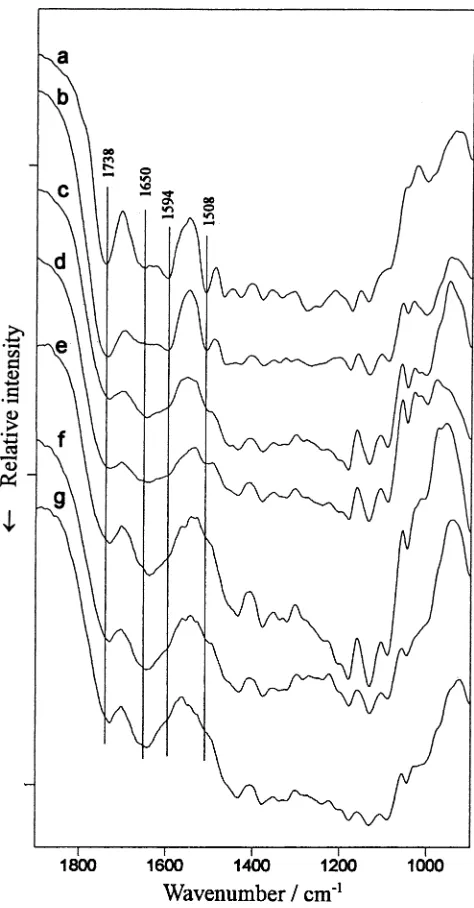
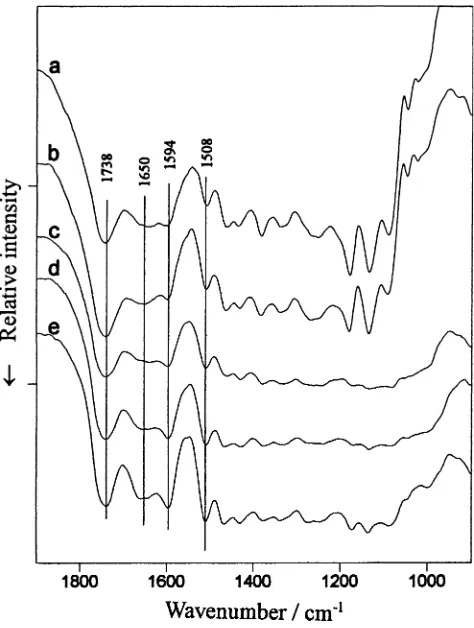
Figure 4 shows the DRIFT spectra of the weathered surface of puspa for various durations. Some of the DRIFT spectra,
especially in the 1450–1200 cm⫺1
region, are not well re-solved owing to spectral collapse, making it difficult to rec-ognize a delicate spectral change by visual inspection. It was therefore mainly the bands at 1738, 1594, and 1508 cm⫺1
that distinctly showed the same changes with weathering as the corresponding bands in the FTIR-PAS spectra.
Line maps in the depth direction of the DRIFT spectra of puspa weathered for 2, 4, and 32 weeks are depicted in Figs. 5, 6, and 7, respectively. For the sample at the second week, the spectral features seem to be independent of the depth from the surface; furthermore, there is no distinct difference between the spectra of the weathered and unex-posed puspa. In other words, the spectral contour is little influenced by weathering even in the spectrum obtained at
the point nearest the surface (the first spectrum, L ⫽ 50).
Because the first spectrum provides information from the surface to a depth of 100µm, it is evident that the physical and chemical changes of wood constituents stopped at a
depth much less than 100µm.
The effects of weathering in the sample exposed for 4
weeks appear clearly in the first and second (L ⫽ 100µm)
spectra as a decrease in the bands at 1594 and 1508 cm⫺1
, respectively; It is likely that the same spectral changes occur
even in the third (L ⫽ 150µm) spectrum, although to a
lesser degree. This reveals that the weathering effects reach much deeper during the fourth week than during the second week.
Most notable from the meteorological data is the marked increase in rainfall from the second to the fourth week. The
Fig. 5. Line map of DRIFT spectra of puspa weathered for 2 weeks in the vertical direction. a, Unexposed; b, L ⫽ 50µm; c, L ⫽ 100µm; d, L ⫽ 150µm
rainfall was only 4 mm for the first 2 weeks (September 1–14, 2000) compared with 104 mm for the second period (September 15–28, 2000), although there was no significant difference in UV irradiation between the two periods. These results support the idea that water flashing acceler-ated the degradation of lignin polymer, causing further de-struction of the lignin–hemicellulose matrix in cell walls.
The band intensities at 1594 and 1508 cm⫺1
in the first spectrum decrease more notably in the sample weathered for 32 weeks than in that weathered for 4 weeks (Figs. 6a, 7a). This proves that the chemical change and decomposi-tion of wood constituents proceeded in the region closest to the surface. However, for both weathered samples, there appears to be no obvious change in the intensity of either
band measured at deeper points (L ⱖ 200µm) than in the
unexposed puspa. The same tendency was observed in the other four species. A possible explanation for the unex-pected results is the absence of UV light in deeper regions. It can be assumed that decomposition of lignin polymer does not proceed rapidly in regions UV rays cannot reach. The weathering of wood is a complicated phenomenon involving many factors. In the present study this phenom-enon was investigated using two infrared spectroscopy tech-niques: FTIR-PAS and DRIFT microspectroscopy. Based on the infrared measurements, further evidence was ob-tained that the combined effects of UV irradiation and water flashing play an important role in the destruction of
Fig. 6. Line map of DRIFT spectra of puspa weathered for 4 weeks in the vertical direction. a, L ⫽ 50µm; b, L ⫽ 100µm; c, L ⫽ 150µm; d, L ⫽ 200µm; e, L ⫽ 250µm
the cell wall matrix. Moreover, it was demonstrated that these spectroscopic techniques are suitable for analyzing weathered wood.
To obtain more information on the effects of weathering, we are currently studying depth profiling by FTIR-PAS and exploring refinement and two-dimensionalization of map-ping by DRIFT microspectroscopy.
References
1. Hon DNS (1991) Photochemistry of wood. In: Hon DN-S, Shiraishi N (eds) Wood and cellulosic chemistry. Marcel Dekker, New York, pp 525–555
2. Evans PD, Michell AJ, Schmalzl KJ (1992) Studies of the degrada-tion and protecdegrada-tion of wood surface. Wood Sci Technol 26:151– 163
3. Sudiyani Y, Takahashi M, Imamura Y, Minato K (1999) Physical and biological properties of chemically modified wood before and after weathering. Wood Res 86:1–6
4. Sudiyani Y, Tsujiyama S, Takahashi M, Imamura Y, Minato K, Kajita H (1999) Chemical characteristics of surface of hardwood and softwood deteriorated by weathering. J Wood Sci 45:348– 353
5. Yamauchi S, Matsuki Y, Ohta S, Okuno T, Tamura Y (2000) Vibrational spectroscopic studies on wood and wood-based mate-rials. V. Infrared spectroscopic investigation for penetration be-havior of isocyanate adhesives at wood-dowel joints (in Japanese). J Adhes Soc Jpn 36:250–258
6. Evans PD, Wallis AFA, Owen NL (2000) Weathering of chemi-cally modified wood surfaces: natural weathering of Scots pine acetylated to different weight gains. Wood Sci Technol 34:151– 165
7. Zanuttini M, Citroni M, Martinez MJ (1998) Application of diffuse reflectance infrared Fourier transform spectroscopy to the quanti-tative determination of acetyl groups in wood. Holzforschung 52:263–267
8. Pandey KK, Khali DP (1998) Accelerated weathering of wood surfaces modified by chromium trioxide. Holzforschung 52:467–471 9. Pandey KK, Theagarajan KS (1997) Analysis of wood surface and ground wood by diffuse reflectance (DRIFT) and photoacoustic (PAS) Fourier transform infrared spectroscopic technique. Holz Roh Werkst 55:383–390
10. Kataoka Y, Kiguchi M (2001) Depth profiling of photo-induced degradation in wood by FT-IR microspectroscopy. J Wood Sci 47:325–327
11. Jensen ES, Gatenholm P, Sellitti C (1992) An ATR-FTIR study on penetration of resins in wood. Angew Makromol Chem 200:77–92 12. Denes AR, Tshabalala MA, Rowell R, Dens F, Young RA (1999) Hexamethyl-disiloxane-plasma coating of wood surface for creat-ing water repellent characteristics. Holzforschung 53:318–326 13. Kuo ML, McClelland JF, Luo S, Chien PL, Walker RD, Hse CY
(1988) Applications of infrared photoacoustic spectroscopy for wood samples. Wood Fiber Sci 20:132–145
14. ASTM standard D 1110–84 (1981; reproved 1990) Annual book of ASTM, Philadelphia
15. Bolker NI, Somerville NG (1963) Infrared spectroscopy of lignins. Part II. Lignins in unbleached pulps. Pulp Pap Mag Can 64: T187–193
16. Sarkanen K, Chang HM, Ericsson B (1967) Species variation in lignins. I. Infrared spectra of guaiacyl and syringyl models. TAPPI 50:572–575
17. Harrington KJ, Higgins HG, Michell AJ (1964) Infrared spectra of Eucalyptus regnans F. Muell and Pinus radiata D. Don. Holzforschung 18:108–113
18. Michell AJ, Watson AJ, Higgins HG (1965) An infrared spec-troscopic study of delignification of Eucalyptus regnans. TAPPI 48:520–532