O R I G I N A L A R T I C L E
Comparison analysis of nonlinear segmentation methods
for selected wood features in sugar maple
Camilo Reyes•Sebastia´n Ossando´n
Received: 24 July 2011 / Accepted: 7 November 2011 / Published online: 5 January 2012
ÓThe Japan Wood Research Society 2011
Abstract Two classification methods, a feed-forward neural network and a fuzzy logic algorithm, were used for the automatic identification of CT images for selected wood features in sugar maple, one of the most important hard-woods in eastern Canada. Three wood characteristics were selected for automatic identification together with the background as a default. Local features, such as position and local pixel values were used as the neural networks inputs. The fuzzy sets consisted of four different possible pixel values and four possible distances from the center of the log. The fuzzy method used in this study was of the Mamdani type. Five sugar maple logs were randomly selected for this study. One of the logs is used for the training of the neural network and the others for validation and comparison. The structure of the neural network was optimized and was used for the segmentation of the other logs. An efficiency func-tion, consisting of the number of pixels correctly labeled, was defined for the evaluation of the segmentation process. This study shows that a segmentation based on a fuzzy method has better capabilities for generalization than one based on a feed-forward method.
Keywords Hardwood featuresComputer tomography Image analysis and segmentationNeural networks Fuzzy logic
Introduction
The value of hardwood lumber is inversely proportional to the quantity and size of its defects, both internal and external. Hardwood, therefore has an appearance-based value. Due to this, log breakdown strategies tend to mini-mize defects in the resulting boards. Therefore, knowledge of internal defects in hardwood logs prior to log breakdown can be useful. It is in the log yard where the first important decision is made regarding the final use of the log. Based upon the external log characteristics, logs may be sorted as veneer logs, saw logs or pulpwood.
Different sawing strategies affects greatly the lumber value [1]. Traditionally, the sawyer, based on his experi-ence, chooses the first opening face by visually examining the external characteristics of the log and then dynamically adjusts the cutting face as the sawing exposes the logs interior. This type of sawing method is information limited in the sense that the sawyer has knowledge of only some external indicators of internal wood defects or character-istics [2]. This limits the ability to maximize the value recovery. Therefore, the development of non-destructive sensing methods that can accurately detect and characterize internal wood features becomes critical for the improve-ment value recovery in hardwoods.
Among the non-destructive method, computer tomog-raphy (CT) is used to infer the internal structure of the log. CT scanning calculates the attenuation of small volumes of the log, to an X-ray beam. Because the X-ray attenuation is dependent on the material density, the result will be a set of images representing the density maps of the log. In CT images, less dense matter has lower pixel values, and the scanner is set so that air (the least dense material) will be shown as black. Thus, the brighter a point, the denser it is.
C. Reyes
Centro de Modelacio´n y Simulacio´n, Eje´rcito de Chile, Valenzuela Llanos 623, La Reina, Santiago, Chile e-mail: [email protected]
S. Ossando´n (&)
Instituto de Matema´ticas, Pontificia Universidad Cato´lica de Valparaı´so, Blanco Viel 596, Cerro Baro´n, Valparaı´so, Chile e-mail: [email protected]
Early works on automatically labeling internal defects using CT images has proved its feasibility. The use of an operational CT scanner in a log industrial environment has shown to be a serious limitation due to the difference between the CT scanning time, the log production line, and the heavy duty industrial requirements. However, in terms of scanning speeds, there has been a great development in high speed scanners as the ones used in airports. In this case, the segmentation and identification require the use of a large data base to label the different objects that may appear in front of the scanner. The creation of signature-based algorithms is mostly used [3]. Ying et al. [4] pro-poses the use of a dual energy CT scanner technique to reduce errors in the identification process for security proposes. Schmoldt et al. [5] reviews the use of techniques based on CT scanners to improve log breakdown.
Image segmentation methods are used to interpret or label the log features. Although these efforts have shown some success, they have serious limitations. Reports on labeling accuracy are based on training sets. There has been slow progress to achieve real-time operability of the developed algorithms. Bhattacharyya [6] shows a review of the latest image segmentation algorithms, however, there is no discussion about the real-time applications. Computer vision algorithms for real-time target tracking and identi-fication have shown some success [7]. Kumar [8] discusses the use of templates (signatures) to develop a real-time vehicle tracking system. In medical fields, there has been a great effort to employ automatic image segmentation for disease identification. Jaffar et al. [9] makes use of a genetic fuzzy method for an automatic lung segmentation of CT scan images.
Recent works have demonstrated highly accurate labeling in CT images using local information. In Wei et al. [10], a feed-forward neural network using a back propa-gation algorithm is used to identify and classify different characteristics of black spruce species of wood. In Rojas [11], a neural network method is used in order to identify different features of the radiata pine species after using a confusion matrix. The use of fuzzy logic method for image segmentation has been used in Hata et al. [12]; however, there is little bibliography about the use of these methods in wood analysis. Nevertheless, both approaches have dem-onstrated feasibility for image segmentation in other areas. Other types of research have been related to areas, such as breakdown strategies and external log scanning or focused on optimal breakdown strategies [13, 14]. Most of these efforts have involved computer simulations to evaluate increased value recovery from optimized breakdown. The objective is to create a computer vision system for auto-matic hardwood log processing to reduce cost, increase product volume and increase value recovery. A tacit assumption for eventual application of internal scanning to
log sawing is that knowledge of the internal defects will lead to greater sawyer productivity. This information should improve breakdown strategies selected, making it possible to optimize bucking. Furthermore, it may improve assessing the impact of logging damages on log quality and define an integrated hardwood management strategy.
There are several ways of studying defects, since there is no forward knowledge of the types of defects that a log may have, a characterization of the regions that are known in the log is done. By this method, anything that is not part of the three regions segmented is identified as a defect that can be parameterized later.
Today, sawing industries have important tools for log breakdown optimization like Optitek, which uses external features. On the other hand, the use of CT scanners in industries is still an academic subject due to the speed of the actual scanners and the variability of characteristics in logs of the same species. The analysis will focus on the generalization capabilities and comparison of different methods.
Materials and methods
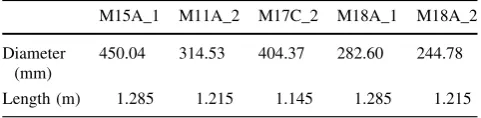
Different Acer Saccharum logs (from now called sugar maple logs) were used: one for training and the others for validation. The characteristics of the logs are enumerated in the following table (see Table1). The training log used is the one with the denomination M15A_1. The CT scanner produces an average of 250 images per log for the training of the neural network and the generation of the fuzzy rules. A set of 20 images were selected randomly from the log M15A_1 in order to create a training set. For the val-idation of the methods, the logs used are denominated as M17C_2, M18A_1, M18A_2 and the log M11A_2. The scanning conditions, however, were not the same for the sets of logs, since they were scanned on different dates, these delays result in different moisture content in the logs. As a result of these changes, the pixel values may vary even for the same log over time [15].
Preprocessing
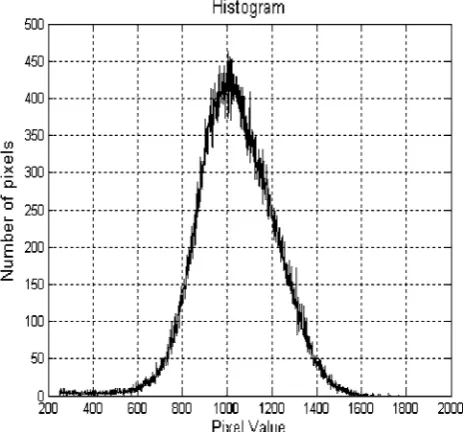
A typical CT image is shown in Fig.1, while its histogram is shown in Fig.2. The scanner has a gray resolution level
Table 1 Physical features of the logs
M15A_1 M11A_2 M17C_2 M18A_1 M18A_2 Diameter
(mm)
450.04 314.53 404.37 282.60 244.78
of 12 bits. The images used have a 16-bit gray resolution level to preserve the same amount of information.
The preprocessing module removes the background and all the pixels having a value below a global threshold. The global threshold of the module was set at a pixel value of 300, thereby eliminating useless information.
Table2 shows the characterization of the pixel infor-mation due to the distance and intensity for a CT scan image of a sugar maple, as seen the pixel intensity is not enough to have an accurate segmentation of zones. Feature selection
The features extracted play an important role in the clas-sification process. These have been derived to enhance the separation between the different regions. They consist of:
1. The gray intensity value of a pixel. However, one pixel value is not enough to make an accurate identifica-tion. For this reason, we define a volume of first neighbors around a pixel which creates a vector of 27 components.
2. The mean value of the volume region analyzed. 3. The variance of the pixel value inside the volume
region.
4. The distance of the pixel from the center of the log.
Neural networks
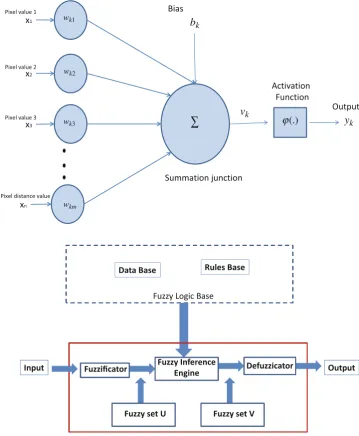
An artificial neural network is a collection of elements called neurons that simply mimic the behavior of biological neurons. A neuron is a mathematical model of a biological neuron used to gain an understanding of its biological behavior. These systems are used in a wide variety of tasks such as function approximation, regression analysis, time series prediction, classification, pattern recognition and data processing. Figure3shows a typical flow diagram for a feed-forward neural network. Through Fig.3, the ele-ments of the neural network can define the inputsXi, where
fori=1:n-3 (n=30) are the pixel values of the volume that surrounds the pixel to be segmented, Xn-2the mean pixel value of the volume analyzed, Xn-1the variance of the pixel value inside the volume analyzed and Xnis the
distance to the center of the log, wkj (k=1:3) are the
neural weights that emulate the memory and learning process and bk is the threshold that prevents the neural
network from learning spurious noise. The output weights vk provide a signal amplification to obtain a normalized
signal allowing the use of standard activation functions. The activation functions characterize the level of numerical approximation of the neural network designed. The output, of the activation function, yk is labeled according to the
values ofk. Thus, ifk=1 thenykis bark, ifk=2 thenyk
is sapwood, and ifk=3 thenykis heartwood. One of the
factors that make neural networks so attractive is their capacity to characterize the nonlinear functions; this makes them a very useful method for identification [16]. This
Fig. 1 A typical CT wood scan
Fig. 2 Typical histogram of the gray levels of a CT scan image
Table 2 Characteristics of the pixel in the intensity and position Mean PV SD RMD to center DSD Heartwood 1176.9 118.57 0.36 0.04 Sapwood 952.61 92.288 0.81 0.01 Bark 720.99 125.51 0.87 0.14 The mean relative distance is the absolute distance of the pixel from the center of the log divided by the radius of the log, i.e. as the distance grows (it cannot grow beyond the radius of the log) the relative distance tends to the unit
Mean PVmean pixel value,SDstandard deviation,RMD to center
study will focus on the feed-forward neural network with back propagation algorithm. This type of neural network has been chosen due to its robustness and generalization capacity. The network will classify each pixel into three different regions, being heartwood, sapwood and bark; background will be the default.
The classification was done by a multilayer feed-forward neural network with 30 neurons in the input layer. The structure of the neural network is optimized using the per-formance index defined by the mean square error. Using the training log, two sets were created: a training set for the neural network, and a validation set for the optimization of the structure. These sets of vectors were created by manual thresholding. This manual threshold allows identifying each region of the image as bark, sapwood or heartwood. For each region, the features defined previously are selected.
Fuzzy logic
This theory is an extension of Boolean logic dealing with the concept of partial truth. Whereas classical logic holds that everything can be expressed in binary terms (0 or 1, black or white, yes or no), fuzzy logic replaces Boolean truth values with degrees of truth. Degrees of truth are often confused with probabilities, although they are distinct, because fuzzy truth represents membership in vaguely defined sets, not likelihood of some event. Fuzzy logic allows for set mem-bership values between and including 0 and 1, shades of gray as well as black and white, and in its linguistic form, imprecise concepts like ‘‘slightly’’, ‘‘quite’’ and ‘‘very’’. Figure4describes the fuzzy scheme. Specifically, it allows partial membership in a set. It is related to fuzzy sets and possibility theory. It was introduced in 1965 by Zadeh [17].
wk1
wk2
wk3
wkm
v
kb
ky
kϕ(.)
∑
Fig. 3 Information flow diagram of a feed-forward neural network
An image can be seen as a three-dimensional map, where the columns and the rows are thexandyaxes and the pixel values falls on thezaxis. For each type of wood, there will be different pixel values and different distances to the center of the log.
Using an expert knowledge, we can separate the heights and the distances into groups, and then establish rules to identify each feature of the log.
The programs used were developed in a MATLAB using the neural network and fuzzy logic toolbox that are part of a MATLAB environment. Since the number of training vectors is more than twice of the number of parameters to optimize and to evaluate the performance of the neural network a regular mean square error (MSE) is used. The classifier is a simple four-dimensional vector where each component represents each region.
For the fuzzy logic method, a Mamdani type of fuzzy rule set was used. As seen in Table3, each pixel was evaluated according to its value and its distance from the center of the log. According to Rule, Ri (a typical fuzzy Mamdami rule) has the following statement:
If pixel2NCL and pixel2HPV then pixel2H:
The result must be one of the three possible regions or by default the background.
Results
For the optimization of the neural network structure, the mean square root of the error was used as a measure of the ability of the neural network to classify the validation set. Figure5shows the result of the optimization as a function of the number of neurons in the hidden layer. As the number of neurons in the hidden layer increases the error decreases, a result that was expected. The tradeoff is that if too many neurons are used in the hidden layer, the gen-eralization capabilities diminish. The training set has 1000 vectors, and too many neurons in the hidden layer will cause overtraining, i.e. too many parameters and not enough data. Figures6,7and8show the segmentation of an image, using both methods based, fuzzy logic and the
Table 3 Map of the fuzzy rules
ZPV LPV MPV HPV
NCL B S H H
NNCL B S H H
NFCL B S H S
FCL B S H S
whereNCLnear center of log,NNCLnot near center of log,NFCLnot far from center of log,FCLfar from center of log,ZPVzero pixel value,LPVlow pixel value, MPVmedium pixel value, HPVhigh pixel value,Bbark,Ssapwood,Hheartwood
Fig. 5 Error versus number of neurons in the hidden layer. The MSE was obtained using a different set from the one used in the training process
Fig. 6 Transversal image of M15A_1
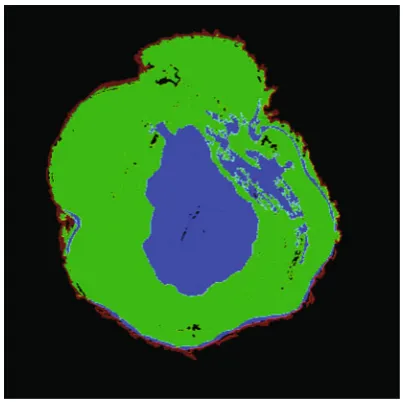
neural network, using the training log. From Figs.9,10and 11 it is possible to see the segmentation done, for log M18A_1, using both methods. The images were randomly picked to show the segmentation and classification process As it can see, both methods give a similar result and in some cases it is diffcult to evaluate the methods by com-paring the images. To compare them quantitatively, a measurement of the efficiency was determined as defined in Eq.1:
e¼1X Z
NINNRZ
NZ R
ð1Þ
whereNIZis the number of pixels that are labeled as Z, and the NRZ is the real number of pixel of the class Z. To determine NRZ, a manual segmentation was made of each
region of interest. The merit figuree, indicates how far is the segmentation process from an ideal segmentation. The ideal situation would be the merit figureeclose or equal to 1, because in that case that would indicate that 100% of pixels recognized as class Z really does belong to class Z.
Analysis of results
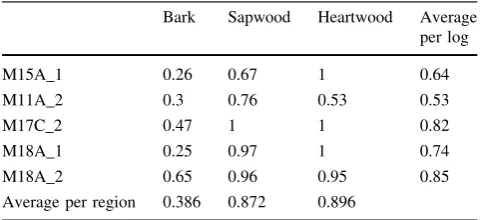
Tables4and5show the results obtained using the different methods. As observed for each log evaluated, Tables4and 5 shows the performance for each segmented zone. For example, in Table4 and for log M15A_1, only 56% the bark was successfully identified as bark. The last column shows the overall performance for the entire log regardless
Fig. 8 Region segmentation of M15A_1 using a neural network
Fig. 9 Transversal image of M18A_1
Fig. 10 Region segmentation of M18A_1 using a fuzzy method
of the zone; the last row shows the performance for each region regardless of the log. As the results show, the fuzzy method has scarcely a better performance than the neural network in all regions with the exception of the bark, however the overall performance shows an improvement of the fuzzy method over the neural network for the total segmentation process in the regions more valuable of the log. These results are for the total of the 250 images that the scanner produced, for each log, as seen the perfor-mance are different when compared with other results in the literature. However, there are a number of experi-mental differences with other cases in the literature, for example each log has different dates for the scanning process which impacts the humidity content of the log. In Rojas et al. [15], there is an analysis of the impact this variable has in the classification process. The impact of the humidity level has not been quantified or modeled. It may be possible to reduce the effect of the humidity using local differences between the regions that are being seg-mented; this was however beyond the scope of the present investigation.
Summary and conclusions
The fuzzy logic method for segmentation in hardwood is feasible and has a scarce advantage over the artificial neural network (ANN), however, an important improvement is that
after the training process of the ANN the knowledge rep-resented in the neural weights is basically a black box, in contrast with the fuzzy logic method where there is a traceability of the segmentation process. The fuzzy logic method shows a better performance for all the regions, except the bark (which has marginal value as compared to the sapwood or heartwood), when compared with the neural network. The primary disadvantages of the fuzzy method are that for each new situation a new set of rules have to be created, for example for the labeling of rot pockets or living knots. However, as indicated, the most important advantage of the fuzzy logic method is the ability to emulate the expert’s knowledge, unlike the neural network. In this case, an expert has to be able to express this knowledge in a structured form.
Further work must be done to improve the generaliza-tion capabilities for automatic feature labeling in hardwood based on a fuzzy method. For example, not only taking into account the pixel values or the distance to the center of the log, but also quantified information about the moisture content or moisture loss models.
Acknowledgments The authors thank Tony Zhang, Senior Scien-tist/Group Leader FPInnovations, Vancouver-Canada, for the support of this work and for many fruitful discussions.
References
1. Richards DB, Adkins WK, Hallock H, Bulgrin EH (1980) Lumber value for computerized simulation of hardwood log sawing. Forest Products Laboratory, USDA Forest Service, No. FPL-356, p 28
2. Occen˜a LG (1991) Computer integrated manufacturing issues related to the hardwood log sawmill. Int J For Eng 3(1):39–45 3. Daiguji M, Kudo O (1999) Wavelet based FDI in oil refinery.
In: Proceedings 14th world congress of IFAC. pp 205–210 4. Ying Z, Naidu R, Crawford CR (2006) Dual energy computed
tomography for explosive detection. J X Ray Sci Technol 14:235–256
5. Schmoldt DL, Scheinman E, Rinnhofer A, Occen˜a LG (2000) Internal log scanning: research to reality, hardwood symposium proceedings, pp 103–114
6. Bhattacharyya S (2011) A brief survey of color image prepro-cessing and segmentation techniques. J Pattern Recognit Res 6(1):120–129
7. Sun Z, Bebis G, Miller R (2006) On-road vehicle detection: a review. Machine. IEEE Trans Intell 28(5):694–711
8. Kumar R (2010) On road vehicle/object detection and tracking using template. Indian J Comput Sci Eng 1(2):98–107
9. Jaffar M, Iqbal A, Hussain A (2011) A genetic fuzzy based automatic lungs segmentation from CT scans images. Int J Innov Comput Inf Control 7(4):1875–1890
10. Wei Q, Chui YH, Leblon B, Zhang SY (2009) Identification of selected internal wood characteristics in computed tomography images of black spruce: a comparison study. J Wood Sci 55(3): 175–180
11. Rojas G, Ortiz O (2010) Identification of knotty core in pinus radiata logs from computed tomography images using artificial neural network. Maderas, Ciencia y Tecnologı´a 12(3):229–239
Table 4 Fuzzy segmentation
Bark Sapwood Heartwood Average per Log M15A_1 0.56 0.74 0.81 0.70 M11A_2 0.02 1 0.99 0.67 M17C_2 0.12 1 0.99 0.70 M18A_1 0.17 0.97 1 0.71 M18A_2 0.56 1 1 0.85 Average per region 0.286 0.942 0.958
Table 5 Neural network segmentation
12. HataY, Kobashi S, Hirano S (1998) Medical image segmentation by fuzzy logic techniques. In: IEEE international conference on systems, man and cybernetics, vol 4. San Diego, pp 4098–4103 13. Steele PH, Taylor FW (1989) Hardwood sawing methods to
maximize value and volume: preliminary results. In: Proceedings of XVII annual symposium. pp 149–166
14. Occen˜a LG, Tanchoco JMA (1989) Pattern directed extraction and characterization of defect configurations in solid log models. Artif Intell Eng 4(3):144–154
15. Rojas G, Beauregard R, Herna´ndez RE, Verret D, Condal A (2007) The effect of moisture content variation on CT image classification to identify internal defects of sugar maple logs. For Prod J 57(4):38–43
16. Sjo¨oberg J, Zhang QH, Ljung L et al (1995) Nonlinear black box modeling in system identification: a unified overview. Automat-ica 31(12):1691–1724