University of West London
Multimodal Social Media Product Reviews and Ratings in E-commerce:
An Empirical Approach
Rajab Khaled Ghandour
PhD IN INTERACTIVE INFORMATION SYSTEM
Supervised by Professor Dimitrios Rigas.
I
Dedication
II
Acknowledgement
III
List of Publications and Conferences
• Communicating Product User Reviews and Ratings in Interfaces for e-Commerce: A Multimodal Approach- International Conference on HCI in Business,
Government and Organizations-Vol. 9751-pp 82-93- Springer International Publishing-2016.
• Best Paper Award -Track: E-business systems and Social Media-MBA- Business and Management Academy International Journal- Brunel University 2015.
• Relationship between Service Quality, Customer Retention and the role of Social Media- Case study Premier Inn Hotel (UK)- Journal of Organization Studies and Innovation-2015.
IV
Abstract
V
Table of Contents
Chapter 1: Introduction ... 1
1.1 Introduction ... 1
1.2 Aims ... 3
1.3 Objectives ... 3
1.4 Overall Hypothesis ... 5
1.5 Research Method ... 5
1.6 Ethical Consideration ... 6
1.7 Contribution ... 8
1.8 Thesis Outline ... 10
Chapter 2: Multimodality, Social Media and Reviews of Products ... 13
2.1 Introduction ... 13
2.2 The Internet and e-Commerce Preview ... 15
2.2.1 The Internet ... 15
2.2.2 e-Business ... 18
2.2.3 e-Commerce ... 19
2.4.3 C2C e-Commerce ... 27
2.3 User Interface and Usability ... 29
2.3.1 Web Design ... 32
2.4 Multimodality ... 35
2.4.1 Sound ... 36
2.4.2 Avatars ... 43
2.5 Social Media ... 47
2.5.1 User Generated Content ... 49
2.6 Product Reviews ... 51
2.6.1 e-WOM, Social Presence and Purchase Decision ... 52
2.7 Critical Conclusion ... 57
Chapter 3 Experimental Phase I:An Empirical Investigation on the Impact of Multi-modal Social Media Messages in e-Commerce Interfaces ... 59
3.1 Introduction ... 59
3.2 Aims ... 60
VI
3.4 Hypotheses ... 61
3.5 Experimental Platform ... 62
3.5.1 Textual Reviews Presentation E-Commerce (TRP) ... 64
3.5.2 Review Messages with Multimodal Presentations ... 65
3.6 Experimental Design ... 71
3.6.1 Procedure ... 73
3.6.2 Tasks ... 74
3.6.3 Variables ... 77
3.6.4 Sampling ... 80
3.7 Data Collection ... 80
3.8 Sample Profile ... 81
3.9 Results and Analysis ... 86
3.9.1 Statistical Methods ... 86
3.9.2 Efficiency ... 87
3.9.2.1 Tasks’ Completion Time According to the Groups (Rating Interface Condition) ... 87
3.9.2.2 Task Completion Time According to Task Complexity ... 90
3.9.2.3 Time Completion for Each Task ... 91
3.9.2.4 Time Taken by User... 93
3.9.3 Effectiveness ... 95
3.9.3.1 Effectiveness for All Tasks ... 96
3.9.3.2 Effectiveness According to Task Complexity ... 97
3.9.3.3 Effectiveness According to each Task ... 100
3.9.3.4 Effectiveness for each User ... 104
3.9.4 User Preference of Social Media Review Source... 104
3.9.5 User Satisfaction ... 106
3.10 Discussion ... 108
3.10.1 Efficiency ... 109
3.10.2 Effectiveness ... 110
3.10.3 Social Media Preference ... 110
3.10.4 Users’ Satisfaction ... 111
VII
Chapter 4 Experimental Phase II:An Empirical Investigation on the Role and Impact of
the Visual Multi Modal Messages in e-Commerce Interface ... 114
4.1 Introduction ... 114
4.2 Aims ... 115
4.3 Objectives ... 115
4.4 Hypotheses ... 116
4.5 Experimental Platform ... 117
4.5.1 Implementation of Facial Expression Presentation (AVP) ... 119
4.5.2 Implementation of the Emoji Presentation (EMP) ... 124
4.5.3 Implementation of Animation Presentation (AMP) ... 125
4.6 Experimental Design ... 128
4.6.1 Experimental Procedure and Tasks ... 129
4.6.2 Variables ... 132
4.6.3 Sampling ... 134
4.7 Data Collection ... 135
4.8 Users’ Profile ... 135
4.9 Results and Analysis ... 140
4.9.1 Efficiency ... 141
4.9.1.1 Task Completion Time ... 142
4.9.2 Effectiveness ... 146
4.9.2.1 Effectiveness for all Tasks ... 147
4.9.2.2 Effectiveness According to Task Complexity ... 148
4.9.2.3 Effectiveness According to each Task ... 151
4.9.2.4 Effectiveness for each User ... 152
4.9.3 Users’ Satisfaction ... 154
4.9.4 User Perceived Enjoyment ... 157
4.10 Discussion ... 161
4.10.1 Efficiency ... 162
4.10.2 Effectiveness ... 163
4.10.4 Users’ Satisfaction ... 164
4.10.3 Enjoyment Level ... 164
VIII
Chapter 5 Conclusions: Empirically Derived Guidelines and Validations. ... 167
5.1 Introduction ... 167
5.2 Empirical Derived Guidelines ... 167
5.2.1 E-Commerce Use of Social Media Reviews ... 168
5.2.2 Use of Audio in Communicating Ratings ... 168
5.2.3 Use of Facially Expressive Avatars and Emoji’s ... 169
5.2.4 Implementation of Animation ... 171
5.3 Prototype Validations ... 172
5.4 Concluding Discussion... 173
5.5 Limitations ... 176
5.6 Future Work ... 177
5.6.1 Expressive Avatar Customisation ... 177
5.6.2 Animation Engine ... 177
5.6.3 Virtual Shopping Artificial Intelligence Avatar ... 178
5.6.4 Musical Reviews in Mobile Devices... 178
5.7 Lessons Learned ... 179
5.8 Epilogue ... 180
Appendices ... 191
Appendix A ... 191
Appendix B ... 195
Appendix C ... 215
IX
Table of Figures
Figure 1.1: Thesis Structure………..7
Figure 2.1: Web of data (Sareh A., et al. 2012)………....17
Figure 2.2: Web History (Radar Networks and Nova Spivak, 2007)……….18
Figure 2.3: Distinction between Buy and Sell side e-commerce………21
Figure 2.4: E-commerce transaction models……….22
Figure 2.5: Porter Forces Model………..23
Figure 2.6: Internet Sales……….25
Figure 2.7: Amazon Annual reports………25
Figure 2.8: The architecture of C2C Intelligent Agent………..29
Figure 2.9: Consumer purchase decision process………...56
Figure 3.1: Conceptual model for the relationship between social media review messages, with multimodal metaphors for multimodal social media integrated e-commerce and customer satisfaction, purchase intention and enjoyment...………63
Figure 3.2: One-product textual review presentation………...65
Figure 3.3: Two-product comparison textual reviews with emojis………..66
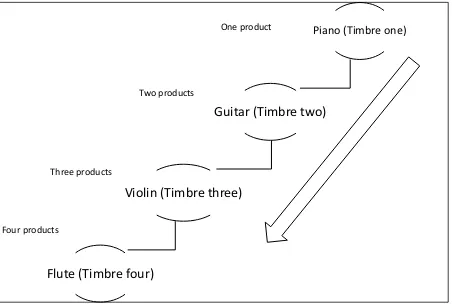
Figure 3.4: Earcons’ tree structure used in the experiment………....66
Figure 3.5: Earcon product review presentation………...69
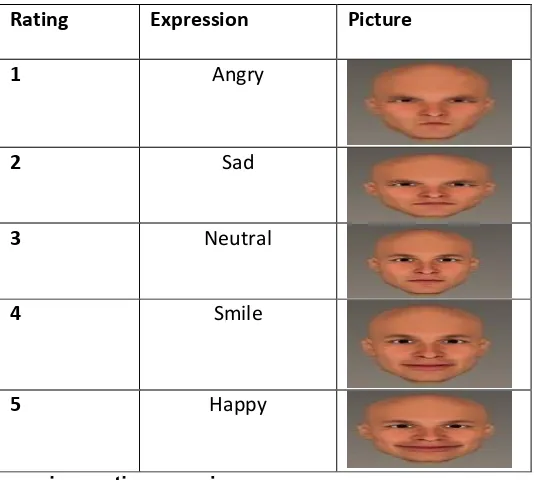
Figure 3.6: Facial expression product review presentation……….69
Figure 3.7: Facial expressions used in the FRP………...69
Figure 3.8: Experiment flow chart………73
Figure 3.9: Users’ profile in terms of age, gender, and education level in the three groups. ………..82
Figure 3.10: Users’ knowledge in terms of using computers, internet and online shopping frequency………...83
Figure 3.11: Users’ rating approach in terms of reading, writing reviews and time spent reading reviews………...82
Figure 3.12: Users’ social media network preferences………..82
X
Figure 3.14: Mean values of time taken by users in the three groups to finish all
the tasks (A) and grouped by task complexity (B)………85
Figure 3.15: Mean of completion time corresponding to the experimental groups...…..89
Figure 3.16: Mean task completion time by complexity level. ………..89
Figure 3.17: Mean value of time taken by the users in the groups to complete each task……….90
Figure 3.18: Total time taken by each user in each group to finish all the tasks...91
Figure 3.19: Percentage of correctly completed tasks achieved by the users in the three groups for all tasks (A) and for task complexity (B)…………...94
Figure 3.20: Percentage of correctly completed tasks according to the groups…99 Figure 3.21: Total number of successfully completed tasks achieved by each user………100
Figure 3.22: Social media source preference according to groups………...102
Figure 3.23: Frequency of users’ agreement to each satisfaction statement in all groups………104
Figure 4.1: Conceptual model for the relationship between review messages and ratings with multimodal metaphors for multimodal integrated e-commerce and the customer’s satisfaction, purchase intention and enjoyment………..115
Figure 4.2: Facial expressions used in the AVP……….117
Figure 4.3: Facial expression avatar ratings for single product………118
Figure 4.4: Facial expression avatar ratings for single product mouse cursor..118
Figure 4.5: AVP for two products comparisons………...120
Figure 4.6: AVP four products comparison………..121
Figure 4.7: Emojis used for the Emoji Presentation (EMP)………...122
Figure 4.8: EMP in a single product presentation………...123
Figure 4.9: AMP Scene………..……….125
Figure 4.10-a AMP sequences………...125
Figure 4.10-b AMP sequences………...125
Figure 4.11: Users’ profile in terms of age, gender, and education level in the six groups………136
Figure 4.12: Users’ knowledge in terms of using computers, internet and online shopping frequency……….137
XI
Figure 4.14: Mean values of time taken by users to complete the tasks grouped by the presentation A and complexity level B………..139 Figure 4.15: Mean task completion time by complexity level……….142 Figure 4.16: Mean value of time taken by the users to finish each task according
to the presentation metaphor……….143 Figure 4.17: Percentage of correctly completed tasks achieved by the users in the
three groups for all tasks (A) and for task complexity (B)………….145 Figure 4.18: Percentage of correctly completed tasks according to the group…149 Figure 4.19: Total number of successful completed tasks achieved by each
user………151 Figure 4.20: Frequency of users’ agreement for each SUS statement for each
presentation metaphor………154 Figure 4.21: Enjoyment percentage for each metaphor presentation…………...154 Figure 4.22: Enjoyment score for each metaphor according to complexity
level………157 Figure 5.1: Number of reviews according to number of products displayed…..168 Figure 5.2: Users’ response validation results………170
Figure A-1: Task difficulty………192
Figure C-1: Task completion time according to condition and task complexity..229 Figure C-2: Average Tasks completion according to presentation and task complexity……….232 Figure D-1: Users data response question 1 and question 2………238
XII
Table of Tables
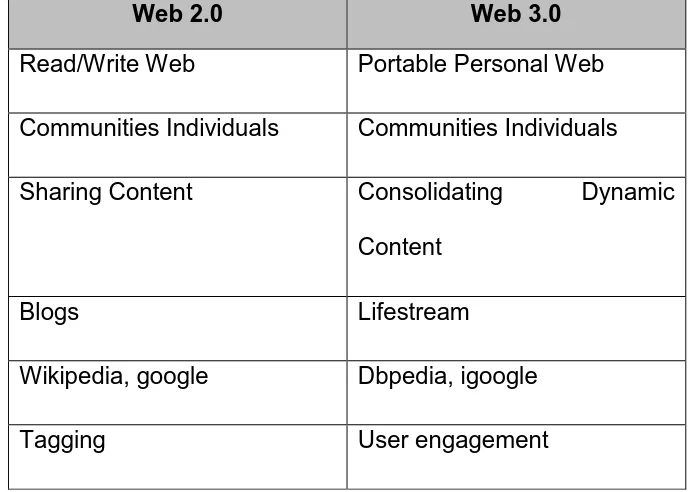
Table 2.1: A Comparison of Web 2.0 and Web 3.0………..………17
Table 2.2: Mapping used in SonicFinder………41
Table3.1: The allocation of metaphors to the information communicated …..62
Table 3.2: Structure of earcons to communicate the different ratings in ERP………....67
Table 3.3: Facial expressions rating mapping………....70
Table 3.4: Groups experiment mapping………..70
Table 3.5: Mapping tasks complexity with product comparison………..73
Table 3.4: Experimental procedure tasks, complexity level and groups…...75
Table 3.5: Independent variables considered for the experiment………..75
Table 3.6: Dependent variables considered for the experiment……….76
Table 3.7: Groups’ task completion time estimates descriptive table…………87
Table 3.8: ANOVA F-test to determine statistical significance for the time taken by users to complete tasks for each group……….90
Table 3.9: F-distribution Statistics to determine significant time difference taken by users to complete tasks………90
Table 3.10: Chi-squared statistics for association between groups……….94
Table 3.11: Kruskal-Wallis test for completion according to task complexity….95 Table 3.12: One-way ANOVA test results………96
Table 3.13: One-way ANOVA post hoc (LSD) test for task completion according to task complexity………...97
Table 3.13: Chi-squared results for the users’ successful completion of tasks in the three groups……….99
Table 3.14: Chi-square results of users’ satisfaction statements………...102
Table 4.1: The allocation of metaphors to the information communicated….116 Table 4.2: Facial expression mapping with ratings……….118
Table 4.3: Emojis and rating mapping in EMP………122
Table 4.4: Characters used in animation presentation (AMP)………..124
Table 4.5: Experimental procedure applied……….127
XIII
Table 4.6-b: Users’ task rotation………....129
Table 4.7: Groups rotation of tasks and conditions……….130
Table 4.8: Independent variables considered for the experiment……….131
Table 4.9: Dependent variables considered for the experiment………132
Table 4.10: Normality test of competition time taken by users of each presentation task………...141
Table 4.11: Mean test of tasks completion time………141
Table 4.12: T-test for the completion time of all the tasks………...143
Table 4.13: ANOVA F-test to determine statistical significance for the time taken by users to complete tasks………..143
Table 4.15: ANOVA F-test results………147
Table 4.16: One way ANOVA post hoc (LSD) test for task completion according to task complexity………..148
Table 4.17: Chi-squared results for the users’ successful task completion using the three presentation metaphors………...150
Table 4.19: User satisfaction statements (Bangor et al.,2013)………...153
Table 4.20: Chi-squared results of users’ satisfaction statements for Task 1..154
Table 4.21: ANOVA test enjoyment level presentation metaphor per task…...157
Table 4.22: Post-hoc LSD ANOVA analysis for enjoyment level………158
Table 5.1: Guidelines cross reference table………173
Table B-2: Tasks completion time ERP group……….206
Table B-4: Successfully Completed Tasks TRP Group………..208
Table B-5: Successfully Completed Tasks ERP Group………..209
Table B-6: Successfully Completed Tasks FRP Group………..210
Table B-6: User’s Satisfaction……… 212
Table C-1: Animation Characters Mapping……….. 214
Table C-2: Task completion time………228
Table C-3: Successfully completed Tasks………231
XIV
Acronyms
HCI Human Computer Interface.
WUI Web User Interface.
GUI Graphical User Interface.
UI User Interface.
B2B Business to Business.
B2C Business to Consumer.
C2C Consumer to Consumer.
TRP Textual Rating Presentation.
FRP Facial Rating Presentation.
ERP Earcon Rating Presentation.
SUS System Usability Scale.
LSD Least Significance Difference.
EMP Emoji’s Presentation.
AVP Avatar Presentation.
AMP Animation Presentation.
UGC User Generated Content.
WOM Word of Mouth.
1
Chapter 1: Introduction
1.1 Introduction
E-commerce can be defined as “the use of the Internet and other networking
technologies for conducting business transactions” (Turban, E., et al., 2004).
E-commerce nowadays is an essential tool for firms to achieve competitive advantage and to survive in the current competitive environment. There were 1.92 trillion US dollars worth of sales globally in 2016 (Statista, 2017). The current modern society has driven most of firms to have e-commerce as a model of survival.
Providing the user interface as a major influence for users to go online, other features, such as previews from previous users’ feedback, also play an important part in the users’ actions, choices and loyalty when using e-commerce. Information and
2
refers to the human senses — vision, hearing, touch, smell and taste (Meera M., Ephraim P., 1996). Hence, researchers now are considering these human senses for use in the computer interface. The metamodels’ main concept is that an HCI
(human-computer interface) modality engages human capabilities to produce an effect in users (Obrenovic Z. and Starcevic D., 2004).
Web 2.0 has provided a new approach and a new type of website where the users can easily make opinions, beliefs and thoughts globally accessible via social media. Sharing information on line is now possible due to Web 2.0 (Scott and Orlikowski, 2012). Social media has changed the way users communicate and interact over the internet. Social media became the platform that allowed the users to create content online, known as user-generated-content. Users are influenced by the people surrounding them (Solomon et al., 2010); which makes social media a powerful tool to share information and product related feedback. Moreover, users mainly rely on online product reviews and ratings before making a purchase; these reviews provided by users are considered to be vital during the purchase decision making process.
3
1.2 Aims
The overall aim of this research is to investigate the impact of the multimodal presentation of social media product reviews on usability, users’ perceived enjoyment
of e-commerce platforms and to produce a set of empirically derived guidelines for the implementation and design of multimodal social media enriched e-commerce sites. In particular, it will evaluate the usability in terms of effectiveness, efficiency and user satisfaction of the presentation modes. In addition to that, it aims to collect the users’
perceived enjoyment while using the interfaces. An experimental e-commerce platform will be developed that will be the basis of this investigation. The multimodal metaphors that will be investigated consist of both visual and auditory metaphors. The visual metaphor that will be tested consists of facial expression avatars, emojis and animation clips; while the auditory metaphors will consist of earcons. Both metaphors will be tested in the context of communicating information to the end user. In addition, social media platforms, as a review source, will be investigated to determine their impact and the users’ preferences. Subsequently, investigating social media as a review source and the users’ preference in e-commerce. Investigating the use of multimodal metaphors (audio, facial expression avatars, emoji’s, animation clips) for enhancing usability of e-commerce and impacting users’ enjoyment. Finally, producing
a set of empirically derived rules for designing e-commerce, rich with multimodality and social media.
1.3 Objectives
4
The first experiment will be used to evaluate three conditions:
1. Text with emoji’s review presentation (TPR): a presentation condition that illustrates
the use of emojis in product review messages.
2. Earcon review presentation (ERP): this is an experimental condition that illustrates the use of short musical files to communicate ratings in product review messages. 3. Facial expression avatar (FRP): this is an experimental condition that illustrates the
use of human facial expressions through the implantation of facial expression avatars to communicate ratings in product review messages.
The second experiment evaluated three conditions:
1. Emoji message presentation (EMP): this condition illustrated the use of emojis to communicate product reviews and ratings in an e-commerce interface.
2. Facial expression avatar presentation (AVP): this condition illustrated the use of facial expression avatars to communicate product reviews and messages in an e-commerce interface.
3. Animation clips presentation (AMP): this condition illustrated the use of animation through the use of different avatar characters to communicate reviews and ratings in an e-commerce interface.
The experiments studied the impact of the conditions on the systems’ ease of use
5
1.4 Overall Hypothesis
The overall hypothesis is that the multimodal metaphors presentation of social media based product reviews enhances the usability of an e-commerce site which in turn improves the effectiveness (in terms of browsing and understanding information), efficiency (understanding the information faster) and user perceived satisfaction and enjoyment when compared to a textual presentation.
1.5 Research Method
The method that was used to carry out this research included a literature survey, an initial experimental study and a further experiment. The data collection process was based on surveys. The experimental approach helped in gathering data related to the impact of social media. Keeping in mind that people usually tend to not use things that they are not familiar with and employ them differently, the second experiment was utilised to explore how acceptable it would be to complete all steps by using multimodal metaphors (audio, facial expressive avatar). This would give an indication of how usable it would be. The final stage was validation for the generated guidelines on using multimodal metaphors to communicate social media reviews and ratings in e-commerce platform.
The experimental e-commerce platform was used to carry a multimodality experiment to measure e-commerce usability. As the researcher is a certified Microsoft professional with development experience, the platform was developed using Microsoft Visual VB.Net 2010. In addition to the researcher’s experience in the
6
An attempt was made to gather existing information from journal articles, books, e-books and online resources, such as online newspapers and other library databases. Information were also obtained from e-commerce websites, blogs, reports and previous similar studies.
The researcher used a positivistic paradigm which is defined by Bryman & Bell (2007) as an “epistemological position that advocates the application of the methods of the
natural sciences to the study of social reality and beyond”. Primary data is the information retrieved directly from sources by means of surveys or experimentation. According to Creswell (1994: 1-2) a quantitative study is “an inquiry into a social or
human problem, based on testing a theory composed of variables, measured with numbers, and analysed with statistical procedures, in order to determine whether the predictive generalisations of theory hold true”. With reference to Creswell’s definition
of qualitative and quantitative studies this research will be adopting the positivistic method. Here it will allow the study to conclude the impact of multimodality and social media review messages on the e-commerce interface. Figure 1.1 presents the thesis structure.
1.6 Ethical Consideration
Any researcher has a moral and ethical obligation to safeguard information gathered during studies (Veal 2011). In this research has applied and followed ethical guidelines of social research which provides safety of the interests of participants. An ethical approach is of high importance as it assures accurate data collection and analysis. It will be possible to overcome any ethical considerations and points of concern from the users’ or participants’ perspective. There will be a duty to protect the rights of people
7
8
The research followed the guide lines of Research Ethics Framework presented by ESRC (2015):
Research should be designed, reviewed and undertaken to ensure integrity and quality.
The confidentiality of information supplied by research subjects and the anonymity of respondents must be respected.
• Research participants must participate in a voluntary way, free from any
coercion.
• Harm to research participants must be avoided.
• The independence of research must be clear, and any conflicts of interest or
partiality must be explicit.
The research has respected the interest of all participants whatever their gender,
age, disability, ethnicity, race, religion or culture. In addition to that the research
has avoided any harm to the participant or their families or kin and their
communities. The confidentiality of those involved in the study, keeping their
anonymity and privacy secure was considered vital. Data obtained and analysed was kept and stored by the University of West London as part of the research, this data can be accessed by the participants when required.
1.7 Contribution
This thesis contributes to the literature of multimodality and social media in e-commerce platforms. The thesis presents an innovative multimodal social media
9
implemented on any e-commerce models. The design combined the use of social media platforms (Facebook, Twitter) as review sources with the multimodal communication metaphors (visual, auditory). The visual multimodal metaphors (emojis, facial expressive avatars, animation) improved the effectiveness, efficiency and user satisfaction when compared to the auditory metaphor (earcons). The thesis gives empirically derived guidelines for the design and implementation of multimodal social media e-commerce platforms. In addition to that, the thesis contributes to the possible development of customisable multimodal review presentation e-commerce pages by allowing users to choose, create and edit the presentation metaphor. The contribution can be summarised in the following:
• The use of emoji’s in review messages has improved the user’s performance
during the tasks’ execution and completion. The users managed to finish the tasks
faster (efficiency), execute the tasks correctly (effectiveness) and showed higher satisfaction when compared to the use of an audio multimodal metaphor (earcons).
• Employing facial expression avatars in product ratings helped the user to have
10
• The preferred social media source for the product reviews and ratings was
Facebook. The users showed a preference for selecting products with reviews sourced from Facebook over products with reviews sourced from Twitter.
• The use of visual multimodal metaphors, emojis, facial expression avatars and
animation clips, showed that users could benefit from different review presentation interfaces. The use of emoji’s or facial expression avatars facilitated
communication of a high number of reviews and messages at the same time starting with 100 messages for a one-product presentation to 50 review messages for four-product comparisons. Animation clips proved to have the lowest impact on the users.
• A set of derived guidelines for the implementation of multimodal social media
review messages in an e-commerce interface that could offer the users a better review communication experience.
1.8 Thesis Outline
The thesis is structured into five chapters and appendices. Below is a description of these chapters and appendices.
Chapter 1: Introduction- Provides an overall introduction to the thesis. The chapter briefly presents research aims, objectives, method, ethical considerations, contribution and thesis structure.
11
designs and the importance of the user interface in an e-commerce site. The multimodality section provides the general context of multimodality and its importance in different computer applications. The last section of the chapter provides a critical conclusion on multimodal social media e-commerce.
Chapter 3 Experiment I: An Empirical Investigation into the Impact of Social Media Multimodal Product Ratings in E-Commerce- The chapter presents the experimental platform used to investigate the usability of different multimodal metaphors in communicating social media product reviews. This experiment is conducted by assigning three independent groups to test three different versions of the experimental platform: textual with emoji’s (TRP), earcon ratings presentation
(ERP) and facial expression ratings presentation (FRP). The data analysis is presented in the chapter.
Chapter 4 Experiment II: The Role of Visual Multimodality in Communicating Product Reviews and Empirical Ratings Investigation- This chapter presents the second experiment that evaluates empirically the performance of different visual multimodal presentation platforms: emoji presentation (EMP), facial expression avatar presentation (AVP) and animation presentation (AMP). The investigation has one group of 48 users. The chapter presents and analyses the data collected from this experiment.
12
Appendix A: The first appendixpresents the pre-platform design tasks questionnaire. The appendix also contains the data collected along with tables and graphs presenting the data.
Appendix B: This presents the questionnaire used in the first experiment. It also provides the data collected in this experiment from the three groups presented in the form of frequency tables. Tables contain users’ answers regarding satisfaction,
number of correct of tasks per group and time to perform the tasks.
Appendix C: This presents the second experiment data and questionnaires used for data collection. It contains the data for 48 users including the correctness, time, satisfaction and enjoyment. The frequency tables are used to present these sets of data.
13
Chapter 2: Multimodality, Social Media and Reviews of
Products
2.1 Introduction
According to Internet World Stats (2017), there are around 3.7 billion internet users. The number of people accessing the internet to buy or to shop or to conduct business is increasing at a fast tempo. As more people are eager to connect, becoming online has opened a new era in terms of business; the internet today has become a commercial medium that has produced a dramatic new economy and new way of running a business. The internet and e-business (including e-commerce) have become an essential and a necessity to improve the business, compete or even to survive. E-commerce has created a completely new way for running a business and founded a new business model in the sense of communicating or performing processes with other firms.
14
Different models exist under e-commerce that support both consumers and businesses, such as: B2C (business to consumer), B2B (business-to Business) and C2C (consumer-to-consumer).
The improvement of internet technology has changed the way users communicate over the internet. The Web 2.0 standard is considered as the major shift from a static type of user interface into a more dynamic one which allows users to interact in two-way communication. This has allowed more input from the users’ side and linked them
to more social interaction. This new web gave the users the ability to not just read the text or content but the option to write, which is the interaction. The result of such improvement was what is currently known as social media. Social media has changed the way people communicate as it became easy to share and digest information (Williams and Williams,2008). The improvement from Web 2.0 to Web 3.0 has increased the interaction of the users resulting in new advances for the social media platform. Users now use social media to fulfil different aspects of their daily life by posting pictures, videos, sharing aspects of their life and providing feedback for products and services. For instance, users go to social networking sites checking pictures and feedback when planning a holiday (Mintel, 2013). Users value information from both offline (word-of-mouth) and online (electronic-word-of mouth) which helps in purchasing decisions.
The user interface in e-commerce is considered as important as the product the company is selling. The human-computer interface aspect of an e-commerce site impacts the user’s action and shopping experience. The aspect of a website that helps
15
greater objective which is consumer trust or retention. Researchers in the human-computer interface field have showed that the use of graphics would improve the users’ trust. A study by Pengnate and Sarathy (2017) showed that both visual appeal
and ease of use are contributing factors in developing online trust among male customers, with visual appeal dominating trust formation among female customers. Multimodality is a concept that focuses on the use of the human senses to improve the human-computer interface. Studies showed that use of multimodality improved the performance of the users.
2.2 The Internet and e-Commerce Preview
2.2.1 The Internet
16
Between 1991 and 1995, the means for navigating the internet was heavily contested by both public and private actors (Martin C., et al., 2013).
The internet’s success is not just as a result of its global network but due to the
applications that can be used over it. Tim Berners-Lee, the inventor of the World Wide Web, has stated (W3C) that a page, which is a document, can be linked to another document. Once a user found one document, it was possible to navigate the information space without a directory (Martin C., et al., 2013). The WEB contains billions of documents that use the internet as means of transportation (Catherine L., 2011).
The first web browser was MOSAIC that was considered as a turning point in web improvement. The MOSAIC browser was a textbook example of user-friendly, point-and-click software (Martin C., et al., 2013). In the last two decades, the web has witnessed many developments and improvements. Many will read about different versions of the web, such as Web 1.0, Web 2.0, Web 3.0 and Web 4.0. Berners-Lee has said that Web 1.0 can be considered as a “read-only web and also as a system of cognition”. The early web provided limited user interactions or content contributions
17
provided better customer satisfaction in the current social web. The semantic web (Web 3.0) is a web that can demonstrate things in an approach which a computer can understand (Sareh A., et al. 2012). It is considered as repositories of data that can be linked to each other as in Figure 2.1. Table 2.1 provides direct comparison between Web 2.0 and Web 3.0. Figure 2.2 presents the web history.
Figure 2.1: Web of data (Sareh A., et al. 2012).
Web 2.0 Web 3.0
Read/Write Web Portable Personal Web
Communities Individuals Communities Individuals
Sharing Content Consolidating Dynamic Content
Blogs Lifestream
Wikipedia, google Dbpedia, igoogle
Tagging User engagement
18
Figure 2.2: Web History (Radar Networks and Nova Spivak, 2007).
2.2.2 e-Business
A firm or organisation is said to have\be an e-business when most of its main business functions are delivered electronically. Hence any firm that is looking for an e-business environment an investment in information technology (IT) is essential; as IT has proved to be the infrastructure for an e-business approach. Exchanging information is often enabled through the use of IT (Skipper et al., 2008). IT spans the boundaries between firms and has been noted for its role in lowering the cost of exchanging information (Clemons et al., 1993).According to transaction cost theory firms seek inputs from external suppliers or the market for items they can’t produce and to
19
website or simply redesigning it will not bring success as an e-business. It is about redefining how you do business. It requires new strategies and new business models (Edward P., 2001).
2.2.3 e-Commerce
E-commerce (EC) can be defined as “the use of the Internet and other networking technologies for conducting business transactions” (Turban E., et al. 2004). A firm or
organisation is said to have an e-business when most of its main business functions are delivered electronically. Exchanging information is often enabled through the use of IT (Skipper et al., 2008). E-commerce does not involve just selling or buying products online but it has extended to most of a firm’s business processes like handling
customer queries online, integrating payment from customers, promotion of product/services on the web, and secure transactions. E-commerce is an umbrella concept to integrate a wide range of existing and new applications (Zwass V., 1996). E-commerce is trading by means of new communication technology. It includes all aspects of trading including commercial market making, ordering, supply chain management, and the transfer of money (Simon Garret, and Skevington, P.J. 1999). Kalakota and Whinstone (2007) presented a wider definition of e-commerce that covered all usage aspects:
• From a communications perspective, e-commerce (EC) is the delivery of
information, products/services, or payments via telephone lines, computer networks, or any other means.
• From a business process perspective, EC is the application of technology toward
20
• From a service perspective, EC is a tool that addresses the desire of firms,
consumers, and management to cut service costs while improving the quality of goods and increasing the speed of service delivery.
• From an online perspective, EC provides the capability of buying and selling products and information on the internet and other online services.
Some benefits include:
• 24 /7accessibility (Lin, B., and Hsieh, C. T., 2000).
• Improvements in operational efficiency and revenue generation by integrating e-commerce into their value chain activities (Rynjolfsson, E., and Kahin, B., 2000).
• Improved customer services (Bakos J. Y., 1998).
• Greater potential for partnership with suppliers and vendors (Koch, H., 2002).
• Lower transaction costs (Tumolo, M., 2001).
• Flexibility in administration and partnership (Brunn, P., et al 2002).
• Access to a wider range of markets (Senn J. A., 2004).
E-commerce can be used to support business networks and help rural firms overcome the challenges of small size and geographic remoteness (Henderson J.R., 2001). It is important to measure the strategic impact of the e-commerce and its impact on the buy and sell sides. Buy-Side-e-commerce refers to transactions to procure resources needed by any organisation from its suppliers (Chaffey D., 2009, p:360). E-commerce is commonly used to sell products online and to reach the largest number of customers possible; this is Sell-Side-e-commerce. Sell-Side-e-commerce refers to transactions involved with selling products to an organisation’s customers (Chaffey D., 2009,
21
Some organisations invested in e-business but without achieving the hoped-for return, either because the execution of the plan was flawed or the planned approaches for their market were inappropriate (Chaffey D., 2009, p:35).
Any e-commerce has a certain structure or framework. Successful e-commerce has a three level framework (Nanehkaran Y., 2013):
1. Infrastructure: This is composed of hardware and software. It is responsible for connecting to the internet.
2. Services: This provides support in terms of searching for goods and trading partners. Also, provides the negotiations and agreement services.
3. Products and structures: Consists of goods, products and services that are linked to the customers or trading partner(s). In addition to sharing information inside and outside the firm.
22
Figure 2.4: E-commerce transaction models (Chaffey D., 2009, p:25).
Many models were formed as a result of e-commerce; these models are categorised according to the operation between the organisation and its stakeholders. As Figure 2.4 shows, different types of e-commerce models can be used within firms like B2B (business to business), B2C (business to consumer), and even C2C (consumer to consumer).
2.2.3.1 B2B e-Commerce
According to Gebauer and Shaw (2002) B2B is defined as “systems and processes
23
partners for ‘‘just in time production’’ and ‘‘just in time delivery’’ (EWT Ngai.; FKT Wat.,
2002).
As part of an e-business approach B2B will help in reducing the cost of transactions. The Porter competitive forces model (Figure 2.5) reflects the importance of the supplier (another firm) to the firm in terms of achieving competitive advantage. For example, the more a firm engages its supplier the more the supplier will provide vital input, thus lowering cost (Lauden and Lauden, 2013). The Porter model reflects the forces, especially the supplier, that affect the firm’s performance in the environment
and its competitiveness; the firms can engage other than suppliers to achieve competitive advantage or lower cost and increase profit. As mentioned above, the internet was the main tool that initiated e-business and e-commerce; it is also used to implement further B2B concepts and approaches. The B2B concept has promoted business processes and is the way to run business in a completely digitised world that has made the internet and e-commerce essential for business continuity and competitiveness.
B2B and the need to improve the supply chain have led to a new, emerging, more efficient supply chain.
24
The benefit of the web was actually presented as a result of the firm’s business need to add value to whatever it’s delivering to its customers.
2.2.3.2 B2C e-Commerce
B2C refers to transactions between a business and its end consumer and so it creates electronic storefronts that offer information, goods, and services between business and consumers in a retailing transaction (Yaser N., 2013). As the internet has created a new way to exchange data and to communicate it gave a new concept for business which is B2C. According to the Porter model to achieve competitive advantage the firm needs to have\implement customer intimacy. Strong linkage to customers and suppliers increases the switching cost (Laudon and Laudon, 2013). The potential for B2C e-commerce is to conduct the business 24/7 which is one of its greatest benefits.
25
Figure 2.6: Internet Sales (ONS,2017).
Figure 2.7: Amazon Annual reports (Statista, 2017).
Figure 2.7 shows that the latest Amazon sales figures increased from $107 billion in 2015 to $135 billion in 2016 (Statista, 2017), which is in correspondence with the
26
the B2C e-commerce of the firm helps the firm to study and to determine the most profitable customers.
With the current internet users’ accessibility increasing (World Stats, 2017) it is a
business necessity for the firms to have a B2C e-commerce capability in order to compete and achieve advantage. The data in Figure 2.7 of Amazon’s annual reports show an increase in online sales that reflects the customers’ satisfaction of buying
online. Having a good well-presented B2C application to reach customers is not enough to make the business successful. In the B2C world, if you don’t have the right
e-commerce infrastructure you can find yourself quickly running out of capital and from there out of business (Leslie L., 2002). A strategy should be implemented to make the provision of e-commerce (B2C) in the business successful. It is very important to have a strong brand or product, but it is not enough. Customer growth is not adequate. Availability of inventories is not enough. Delivery of the items is not enough. What is more important is the customers’ expectation.
Paul Evanko said (2002) “To do that you have to have the right mix of capabilities”. Capabilities are a mix of firms’ management skills and brand availability. “The right
balance of good management of capital, fundamental management leadership skills, scale and yes, branding. But this balance varies by industry”. As Paul pointed that the
27
damage free and this is the minimum customer expectation. Meeting customer expectation repeatedly will lead to customer loyalty.
2.4.3 C2C e-Commerce
Consumer-to-Consumer (C2C) is another application of e-commerce. Online users have a common interest in terms of selling and buying. The most successful example of C2C ecommerce is eBay. Having an account on eBay makes the user able to purchase directly from another user who has interest in selling. Moreover, such a site can make users into sellers with no need to have a physical location to conduct business. In C2C communication, all necessary information must be collected promptly when a buyer and a seller communicate (Chih-Chin,Wen-Yau, 2013). The networking platform or networking is provided to both seller and buyer through a fee or by charging a cost per transaction. For example, eBay has three types of fees (eBay, 2017):
• Insertion fees: This fee is paid whenever you list an item on eBay, even if it doesn't sell.
• Final value fees: When your item sells, you'll be charged a final value fee that's based on a percentage of the total cost to the buyer, including postage, packaging and any other related costs and only paid when the item is sold.
• Feature fees: This fee is only paid if you select optional features to increase your chances of a successful sale, e.g. international site visibility, subtitle or picture pack.
An online auction is another service provided by the C2C platform that will boost the seller’s sales figures. When bidding on an online auction for a certain item the buyer wants to analyse the item regarding the price, discount, item’s description, delivery
28
information and analysis provided is time consuming for both the seller and the buyer. Another service or feature that might be provided by a C2C platform is the smart agent. Agents are intelligent, autonomous software components capable of interacting with others within an application, attaining a common goal and thereby contributing to the resolution of some given problem (Pratik Biswas, 2008). In C2C, a smart agent can analyse data information and even can bid and operate on the user’s behalf (seller or
buyer).
Some properties of an agent (Michael W., Nicholas J., 1995):
• Autonomy: agents operate without the direct interventions from humans.
• Social ability: agents interact with other agents.
• Reactivity: agents perceive their environments and respond in timely fashion to
changes that occur.
• Pro-activeness: agents do not simply act in response to their environment they are
able to exhibit goal-directed behaviour.
The agents’ characteristics help both the sellers and the buyers to communicate,
interact and do business with less time spent on communication or information analysis. The existence of agents in the C2C world has created another term C2CIA (Consumer to Consumer Intelligent Agent) that perform similarly in the C2C trade. The C2CIA features the following criteria for C2C trades (Chih-Chin, Wen-Yau, 2013):
• Intelligence: A C2CIA automatically customises itself to suit user preferences, based on previous experiences and imprecise information obtained via interaction with users. The agent also automatically exchanges transaction information with other agents.
29
Figure 2.8: The architecture of C2C Intelligent Agent (Chih-Chin, Wen-Yau., 2013).
• Cooperation: A C2CIA does not simply respond to commands but makes suggestions to modify requests or questions users to seek clarification. A C2CIA
also cooperates with other agents to query the needed modules.
Figure 2.8 presents the architecture of the C2CIA that is considered as another dimension for C2C that could improve the performance of both the seller and the buyer. This helps both parties to conduct business or transactions with less time and with more precise purchase decisions and transactions.
2.3 User Interface and Usability
The web increases accessibility and defies geographical barriers (Jakob N., Marie T., 2001). As the web gives a new dimension for firms and users in terms of communicating outside their limited physical boundaries, hence it is important to pay attention to providing a proper web design that is easy to use. Creating an effective web design began by the time the web started to become more popular and browsers’
30
Costabile (2001), usability is defined as one of the six characteristics of software quality. It is the “capability of the software product to be understood, learned, used and
attractive to the user, when used under specified conditions". It is further subdivided into five sub characteristics: understandability, i.e., the capability of the software product to show the users its appropriateness to the tasks to be accomplished and to the context of use; learnability, i.e., the capability of the software product to help users to easily learn its functionality; operability, i.e., the capability of the software product to make possible for the users the execution and the control of its functionality; attractiveness, i.e., the capability of the software product to be pleasant for users; compliance, i.e., the capability of the software product to adhere to standards, conventions, and style guides about usability (Costabile M.F., 2001, pp.179-192).
When referring to computer systems or the web there are two terms for defining user interfaces, the GUI (Graphical User Interface) and WUI (Web User Interface). With the GUI, the design and the implementation are undertaken with the user at the centre of the design.
Graphical user interface (GUI) broadly involves (Uttara N., 2001):
• Set up user types.
• Define tasks, for each user type.
• Design the user interface by specifying presentation elements to complete these
tasks.
While whenever building or designing a web interface the users are undefined and the page is globally accessed. Web design techniques include (Rosenfeld L., Morville P., 1998):
31
• Determine the site’s content and functionality.
• Define the organisation of information on the site, including navigation, labelling,
and search systems. Specify these in terms of web page hierarchy diagrams, or information architecture blueprints.
• Build and test. Preferably, test the site’s usability by observing members of the
intended audience perform specific tasks on the site.
Major differences between them (GUI and WUI) include the following (Uttara N., 2001):
• User characterisation is more difficult on the web because it typically addresses an unknown audience. For applications, however, the user community is usually well defined.
• Applications are typically task centric, whereas the web is still largely information
centric.
• Customers are not stuck with a web site the way they might be with an application
or product they have purchased. At the slightest difficulty, the surfer tends to move on to another site, maybe never to return again. Navigation between web pages is much more flexible than that between forms (or screens) of an application. Thus, user can reach a particular web page by any number of navigation paths provided on the site. In contrast, in the GUI application, the routes to a particular screen are extremely limited. Indeed, most screens have only one path to them.
One of the most commonly used techniques in usability evaluation is heuristic evaluation (Nielson, J., 1993). In this technique, the evaluator looks at the interface and then tries to frame an opinion about what is good and bad about the interface. In heuristic evaluation, a small set of evaluators test the interface against the following usability principles:
32 2. Speak the users' language
3. Minimise user memory load.
4. Consistency.
5. Feedback.
6. Clearly marked exit.
7. Shortcuts.
8. Good error messages.
9. Prevent errors.
10. Help and documentation.
Providing good design along with simplicity is the core of a successful interface. A good design of the user interface results when designers understand people as well as technology (Costabile M.F., 2001, pp.179-192). Moreover, the impact of the design affects the actions of the users especially when it comes to searching for or comparing a product.
2.3.1 Web Design
33
advantage of the internet, it is important to understand what drives utilisation of one site over another (Deborah E. and Elizabeth P., 2004). The easier the web page is to use the more the user will come and visit or purchase as they tend not to like pages that are not easy to surf or to go through. Another important feature is the content, as mentioned earlier, web pages are content centric. According to Hong et al.,(2014), the use of a matrix product presentation format supports searching while the list view product presentation format supports browsing. The clearer the content and the more up-to-date the page is, the more frequent the user will come and visit. The content composes the largest portion of the web page, and in order to improve the quality value of the user on the web, the quality of the content should be considered. Since content is king on the web, the only way to increase the ultimate value of the web to users is to enhance the quality of the content (Jakob N., 1999). Web evolution (Web 1.0, Web 2.0 and Web 3.0) is a continuous approach that will keep moving forward to enhance the web experience and implement richer content for the user.
As mentioned above the content is the king of the web page, still it is difficult to know who the users are and what their requirements are. This invariably leads to an almost imperceptible shift in the focus from what the user would like to find on the site to what the owner would like to display (Uttara N., 2001). The content then is the display of what the owner wants to present, and having that as a poor layout will lead to fewer users or visitors to that page that then could lead to business losses. In many ways, designing effective web content is very similar to designing a physical landscape (Deborah E., et al., 2004). It is not just about having the right content for the users and it’s more than using the right number of spaces; images, videos, layout and structure,
34
The Web is all about choice; the range of places available for users to transact business is astounding, the options almost endless (Jakob N, Marie T., 2002). This reflects the need to have an effective and efficient design with ease of access. Hypermedia provides an untraditional way to access content through simple navigation among the pages. This linking capability makes hypermedia very powerful in terms of its ability to organise, store and present large amounts of complex information (Perera S., et al., 1999). Finding the right way to present the information within the website is almost as important as the information itself. The simplicity of the page in presenting the content will make the user more comfortable and less confused and will surf pages with fewer clicks. The underlying structure of hypermedia provides for storage of information in atomic nodes in the form of different multimedia elements such as text, graphics, animation, audio and video, thereby allowing a multidimensional association of information (Davies, et al., 1991). A node is presented to the user as a set of information and each node is linked to another node (information to other information) in the form of a network that makes it easier for the user to navigate. The nodes are typically interconnected in a semantic network and each node’s information is made available to the user via one or more links (Perera S., et
al., 1999).
35
2.4 Multimodality
Multimodal computer systems are those that use more than one of our senses in their user interfaces. Most user interfaces heavily use visual stimuli to communicate information and this could result in overloading the user’s visual channel (Brewster,
36
enhancing usability and users’ learning performance (Leonard A, Shawn H.,1996).
This shows the importance of multimodality when it comes to creating a better user interface which increases usability. Hence, applying multimodality in e-commerce might have the same influence as in the e-learning area.
2.4.1 Sound
Some computer applications are already using sound; for example, the beep warning and composed speech. The use of sound and vision in presenting information provides universal design of the product (Dix, A., et al., 2004). Sound does not occupy the screen of the user as a graphical interface or icons do. The most commonly used communication channel is the visual one. However, the visual channel has drawbacks since the user has to focus on the visual aspects which might already be loaded with many visual channels. The effective use of sound can be beneficial to overcome these drawbacks (Dix A., et al., 2004). The auditory metaphors consist of recorded speech, earcons and auditory icons whereas the audio-visual metaphors incorporate the use of speaking avatars with human-like animated facial expressions and body gestures (Al-Seid M., 2009). There are two types of sounds that can be used: speech and non-speech metaphors.
2.4.1.1 Speech Metaphor
(Al-37
Seid M., 2009). Thus, the success of these systems is still low. A spontaneous and free-flowing speech style is critical to its success (Deng L., 2004). Even with the challenges facing this area to have a higher influence in our lives it has been used and implemented in some products, such as mobile phones. Speech recognition can be used to input information into computer-based systems like mobile, telephone-based and airline booking systems (Dix A., et al., 2004). Systems face limitations in determining the spoken words; Morario (2009) emphasises that to reduce the error rate more samples of the spoken word are needed. “For learning (words) we need to extract cepstral coefficients from several audio samples of the same word.” (Morario
A., 2009). The industry has yet to bridge the gap between what people want from speech recognition, typically in a multimodal environment, and what the technology can deliver (Dong L., 2009).
38
letters (Graves A and Jaitly N,2014). In addition to that, the researchers in the field found that there are other difficulties or challenges for the speech recognition system which includes various the surroundings or the environment of the users using the system. There are many technological hurdles yet to reach flexible solutions that satisfy the user. This is because of many factors such as environmental noise, paucity of robustness to speech variations (foreign accents, sociolinguistics, gender, and speaking rate), spontaneous, or freestyle speech (Sahu P. et al.,2017). The area is improving constantly and also becoming increasingly usable and useful; however, it is still not widely adopted in e-commerce.
2.4.1.2 Non-Speech Metaphor
Non-speech is another multimodal interaction in the human-computer interface that is part of the audio metaphors interaction process. Non-speech sounds, compared to speech sounds, are language-independent, provide faster communication and can be understood quicker with the presence of sufficient training (Brewster S., et al., 1998). Research has proven that the audio existence is as important as the visual in any system or application. The combination of visual and auditory information at the human-computer interface is a powerful tool for interaction (Sears A and Julie J., 2003). The combination of two human senses together leads to better or improved decisions and judgement. In daily life audio/sounds surround the environment people live in which makes such interaction unavoidable. Within non-speech the researcher will focus on two groups: earcons and auditory icons.
2.4.1.3 Earcons
39
40
(Brewster S., et al., 1994), buttons (Brewster S., et al., 1995); menus (Brewster S., et al., 1997; Brewster S., et al.,1999), progress bars (Crease M. and Brewster S., 1998), and tool palettes (Brewster S., and Clark C. V., 2005). Mobile devices have embedded various earcons that users familiarise themselves with and that are deployed to provide different types of information. Earcons have been shown to be beneficial to enhance users’ interaction with mobile devices where the inclusion of structured
musical sounds helped the users to overcome the lack of visual feedback due to the small screen size in these devices (Brewster S., et al., 1998; Brewster S., 1999; Walker A. and Brewster S., 2000).
2.4.1.4 Auditory Icons
41
Event to Sound Mappings for the SonicFinder
Computer Finder Event Auditory Icon
Objects
Selection
Type (file, application, folder, disk, trash) Size
Hitting Sound
Sound Source (wood, metal, etc.) Pitch
Opening
Size of opened object
Whooshing Sound Pitch
Dragging Size
Location (window or desk) Possible Drop-In?
Scraping Sound Pitch
Sound type (bandwidth)
Disk, folder, or trashcan selection sound Drop-In
Amount in destination
Noise of object landing Pitch Copying Amount completed Pouring sound Pitch Windows
Selection Clink
Dragging Scraping
Growing Window size
Clink Pitch Scrolling
Underlying surface size
Tick sound Rate
Trashcan
Drop-in Crash
Empty Crunch
42
Another example, in a messaging system, is that a weighty sound can be played to indicate both the arrival and the size of the received message (Graver W., 1986). An experimental study by Rigas and Alseid (2009) investigated non-speech sounds when used along with the speech of a full-body, animated virtual lecturer during the presentation of learning content and found that earcons and auditory icons could be used beneficially in communicating auditory messages related to important parts of the content.
Auditory icons have been used to deliver pieces of information or a message and its usage provided a great contribution in facilitating the user interface as the result of the experiment mentioned earlier has shown. Auditory icons aim to provide an intuitive linkage between the metaphorical model worlds of computer applications by sonically representing objects and events in applications, using sounds that are likely to be familiar to users from their everyday life (Brazil E. and Fernstrom M., 2011).
SonicFinder (Gaver W., 1989) is an example of a system in which auditory icons have been developed and used. SonicFinder used digitised recordings of sounds that were played when the system was used. Most of the user’s actions were represented by
43
However, these mappings are sometimes difficult to establish (Grazonis S., et al., 2009).
2.4.2 Avatars
Multimodal input systems have been developed to support functions such as increased system accessibility for diverse users (Sarter N., 2006). An avatar is a computer-based character that has been utilised to virtually represent one party in an interactive context (Bartneck, et al., 2004; Dickey M., 2003). In addition to the visual presence of the avatar it also can provide communication. According to Beskow J.(1997), verbal communication is the use of speech or written massages while the nonverbal is the use of facial expression or body language (gestures). As multimodality refers to the use of different communication channels, an avatar is considered another important tool to improve the visibility and communication aspects of any system. The improvement in technology, especially in social media and video gaming, has improved the presence of avatars. An avatar may be a static picture or image that users employ to present himself/herself in a social networking setting (Kang and Yang, 2006). Avatars can be classified into three groups: abstract, realistic and naturalistic (Salem B. and Earl N., 2000).
• Abstract avatars are cartoon-like interactive characters with limited animation
(Gazepidis N., 2008).
• Realistic avatars offer a real representation of humans having been generated
44
• Naturalistic avatars are humanoid in appearance and widely utilised in collaborative
virtual environments to represent the interacting users (Burford D. and Blake E., 1999).
2.4.2.1 Avatars Use
45
showed that incorporating talking virtual salesman with facial expressions and body gestures in e-commerce interfaces was more appealing to users compared to the textual presentation of products. The use of avatars has been studied across different platforms, such as e-learning, e-government and e-commerce, with results indicating the positive impact of avatars on users. Implementing avatars in the interface of different applications (e-learning, e-government and e-commerce) showed a positive impact on improving users experience through understanding the information communicated and executing tasks faster. The implementation of avatars has been used to improve users’ trust as well. A study conducted by Bente G. et al., (2014),
showed that avatars can help to reduce uncertainty and to improve trust building in e-commerce settings. The success of an avatar in a user interface hugely depends on the user perception of the avatar and the type of avatar being used. The use of a human avatar has been perceived as the most credible and attractive and was regarded as having the highest impact on intention to interact (Mull I., et al., 2015). Furthermore, users’ trust in e-commerce depends on the presence of pictures or
avatars; seller depictions (photos, avatars) have been shown to reduce buyer uncertainty and to foster trust in online trading (Bente G., et al, 2014).
2.4.2.2 Facial Expressive
46
expressions are considered an important feature of people’s daily life. For successful
social interaction accurate face perception is critical (Oosterhof and Todorov, 2009). Facial expressions are used to present an emotional state that others would understand. For example, if a user observes a happy facial expression he or she would perceive a happy emotional state and similarly with an angry facial expression. Facial expressions are considered an essential element for interpersonal communication and social interaction (Hickson S., et al., 2017). Moreover, facial expressions could communicate information that would not be easy to relay verbally; facial expressions provide a means for communicating emotions