R E S E A R C H
Open Access
Exploring the factors affecting carbon and
nutrient concentrations in tree biomass
components in natural forests, forest
plantations and short rotation forestry
Roque Rodríguez-Soalleiro
1*, Cristina Eimil-Fraga
1, Esteban Gómez-García
2, Juan Daniel García-Villabrille
3,
Alberto Rojo-Alboreca
3, Fernando Muñoz
4, Nerea Oliveira
5, Hortensia Sixto
5and César Pérez-Cruzado
3Abstract
Background:Coupling biomass models with nutrient concentrations can provide sound estimations of carbon and
nutrient contents, enabling the improvement of carbon and nutrient balance in forest ecosystems. Although nutrient concentrations are often assumed to be constant for some species and specific tree components, at least in mature stands, the concentrations usually vary with age, site index and even with tree density. The main objective of this study was to evaluate the sources of variation in nutrient concentrations in biomass compartments usually removed during harvesting operations, covering a range of species and management conditions: semi-natural forest, conventional forest plantations and short rotation forestry (SRF). Five species (Betula pubescens,Quercus robur,Eucalyptus globulus,Eucalyptus nitensandPopulus
spp.) and 14 genotypes were considered. A total of 430 trees were sampled in 61 plots to obtain 6 biomass components: leaves, twigs, thin branches, thick branches, bark and wood. Aboveground leafless biomass was pooled together for poplar. The concentrations of C, N, K, P, Ca, Mg, S, Fe, Mn, Cu, Zn and B were measured and the total biomass of each sampled tree and plot were determined. The data were analysed using boosted regression trees and conventional techniques.
Results:The main sources of variation in nutrient concentrations were biomass component > > genotype (species)≈age >
tree diameter. The concentrations of Ca, Mg and K were most strongly affected by genotype and age. The concentrations of P, K, Ca, Mg, S and Cu in the wood component decreased with age, whereas C concentrations increased, with a trend to reach 50% in the older trees. In the SRF, interamerican poplar andP. trichocarpagenotypes were comparatively more efficient in terms of Ca and K nutrient assimilation index (NAI) (+ 65–85%) than eucalypts, mainly because leafless biomass can be removed. In the conventional eucalypt plantations (rotation 15 years), debarking the wood at logging (savings of 225% of Ca and 254% of Mg forE. globulus) or the use of selected genotypes (savings of 45% of P and 35% of Ca) will provide wood at a relatively lower nutrient cost. Considering all theE. globulusgenotypes together, the management for pulp with removal of debarked wood shows NAI values well above (× 1.7–× 3.9) the ones found for poplar or eucalypt SRF and also higher (× 1.6–× 4.0) than the ones found for oak and birch managed in medium or long rotations. The annual rates of nutrient removal were low in the native broadleaved species but the rates of available soil nutrients removed were high as compared to poplar or eucalypts. Management of native broadleaved species should consider nutrient stability through selection of the biomass compartments removed.
(Continued on next page)
* Correspondence:[email protected]
1Sustainable Forest Management Unit (UXFS), Department of Plant Production and Engineering Projects, Universidade de Santiago de Compostela (USC), Rúa Benigno Ledo, Campus Terra, 27002 Lugo, Spain Full list of author information is available at the end of the article
(Continued from previous page)
Conclusions:The nutrient assimilation index is higher in poplar grown under short rotation forestry management than
in the other systems considered. Nutrient management of fast growing eucalyptus plantations could be improved by selecting efficient genotypes and limiting removal of wood. The values of the nutrient assimilation index are lower in the natural stands of native broadleaved species than in the other systems considered.
Keywords:Nutrient removal, Biomass crops, Poplar genotypes,Eucalyptus, Oak, Birch, Plantation sustainability
Background
The proposed measures of the climate conference held in Paris in 2015 include transformation of the current fossil fuel-based energy generation systems to sustainable and renewable energy (RE)-based systems by using so-called
‘carbon-neutral’alternatives (Karvonen et al.2017).
Produc-tion of forest biomass is one such RE opProduc-tion and can be increased by the use of specific biomass crops or changes in forest management of plantations or native species (pre-commercial thinning for biomass or use of logging residues, among others). However, these alternatives have raised concerns because of potentially adverse effects on forest soil
productivity (Thiffault et al.2014). Forest sustainability
cri-teria thus usually include factors such as soil fertility and
nutrient removal (Haberl et al. 2010). Short-rotation
for-estry (SRF) systems, with rotations of 3–7 years, are not yet
widely implemented as part of European land use (Don et
al. 2012). In Spain, changes in incentives policies have
returned SRF to the developmental or precommercial stage
(san Miguel et al.2015). Nevertheless, SRF plantations are
expected to increase within a global scenario of bioecon-omy and given the commitment of the European Union (EU) for 20% of energy to be produced from renewable
sources by 2020 (EU 2009). Land classification is a basic
step in forest management planning, to identify areas where
logging residues could be removed (Thiffault et al.2014), to
predict SRF productivity (Pérez-Cruzado et al., 2014) and
to identify the most appropriate species and genotypes for
different areas (Sixto et al.2015).
The landscape in large areas of northern Spain is char-acterised by forest land covered by semi-natural forests of deciduous trees, alternated with fast growing planta-tions of exotic trees (such as eucalyptus, managed in ro-tations of 10 to 18 years). Eucalyptus planro-tations are particularly important for pulp production in southwestern Europe, covering recently planted forest land and, to a lesser extent, agricultural land (Díaz-Balteiro and Rodríguez
2006; Madeira and Araújo 2015). Pedunculate oak is a
major natural forest species in Europe, covering the northern area of Spain in Galicia and the Cantabrian
range (Gómez-García et al. 2015). Downy birch is one
of the two commercially important Betula species
grown in Europe (Hynynen et al. 2009); in northern
Spain it acts as a pioneer species in humid or wet areas, with fast but unsteady growth.
Management of natural deciduous forest entails the removal of comparatively low amounts of biomass and the application of longer rotations than in conventional
fast-growing plantations (Gómez-García et al. 2016).
Pro-vided that conventional patterns of extraction of woody components are applied, there are no major concerns about the nutrient sustainability of these native, extensively
managed deciduous forests (Ranger and Turpault 1999).
However, this is not true for intensively exploited forest plantations or SRF, and one of the key aims of nutrient sus-tainability in such cases is to obtain an overall balance by assessing the nutrient fluxes that occur throughout the ro-tation, including the amounts removed during clearfelling
(Laclau et al.2010; Vanbeveren et al.,2016). Estimation of
the amounts of nutrients removed requires knowledge of the amounts of biomass in each compartment (stumps, wood, bark, branches of different sizes and leaves) and the nutrient concentrations in these components (Viera et al.
2016). However, the main drawback of this approach is that
nutrient concentrations in biomass compartments vary depending on plantation age, site and even tree density
(Judd et al.1996; Rytter 2002; Leite et al.2011), although
the concentrations stabilize in mature stands (Augusto et
al.2008). Nutrient exportation via biomass removal is just
one of the processes in the whole cycle. Nutrient losses can also occur through erosion or leaching, and the overall nu-trient budgets are known to be site-specific (Ranger and
Turpault1999).
Short rotation forestry (3–7 years) management of
pop-lar and eucalypt genotypes has been studied as a way of producing biomass to enhance the bio-economy in Spain
(González-García et al.2013; Oliveira et al.2017). Most of
the poplar genotypes used correspond to the Populus ×
euramericana and Populus × interamericana parental groups, the latter of which is considered less site
demand-ing (Soulères 1984). As a rule, the harvest of SRF
con-siders the whole tree, and thus only the leaves of perennial
species are harvested (Sochacki et al.2013). Debarking is
not an option for the small diameter shoots harvested in this case, as the usual method of harvesting entails chip-ping all the aboveground components (san Miguel et al.
2015; Eufrade et al.2016). For pulp plantations, which are
usually felled in cycles longer than 10 years in Spain, intensive management may lead to negative budgets
at minimizing negative nutrient budgets in forest plan-tations have been proposed: removal of only the wood component, leaving the bark in place; management of logging residues to enable reincorporation of the nutrients
into the soil (Achat et al. 2015); and modification of soil
preparation techniques (Merino et al. 2003; Viera et al.
2016). Other possible management adaptations include
re-definition of rotation length (Viera et al.2015) and the
use of genetically improved materials with enhanced nutri-ent assimilation index (NAI), defined as the amount of
bio-mass produced per unit of nutrient (Sochacki et al.2013).
Carbon concentrations can also be used to predict the potential sequestration of this element in forest biomass and associated products. This application is receiving currently great interest, as the estimation of forest carbon stocks is in the core of the international agreements for greenhouse gasses emission reductions (Angelsen et al.
2012). Although the most common approach is to use a
fixed C concentration in biomass components per species
(Pérez-Cruzado et al.2011), a better understanding of the
sources of variation in C concentrations is required. The interest in reducing the uncertainty in C stock estimation in forest systems is twofold: the greater value of those ini-tiatives where C emissions reductions are estimated with
lesser uncertainty (Angelsen et al. 2012), and the
avoid-ance of systematic errors causing overestimation.
The main objective of this study was to evaluate the sources of variation in the concentrations of carbon and nutrients in biomass compartments usually removed during harvesting operations, covering a range of species and management conditions: semi-natural forests, euca-lypt pulp plantations and poplar and eucaeuca-lypts grown as SRF. We also aimed to explore differences among spe-cies and genotypes and the effect of age and tree size on nutrient concentrations in the different compartments. We hypothesized that several genotypes of poplar and eucalypts will provide biomass at a relatively low nutri-ent cost.
Methods
Species and plots sampled
A network of 60 plots covering five species (Betula pubes-cens,Quercus robur,Eucalyptus globulus,Eucalyptus nitens andPopulusspp.) was established for evaluation of biomass and nutrient concentrations in Galicia (NW Spain). The native species were sampled in plots established in semi-natural stands managed on intermediate to long rotations, and the range of ages and tree sizes was thus
very broad (Table 1). The stands of both eucalypt species
were managed as conventional forest plantations for pulp
production (average initial density 1125 trees∙ha−1). These
plots were established as a chronosequence, with ages ran-ging from 1 to 17 years. In the case of poplar, the four plots
were managed as short rotation crops, with rotation of 4–
7 years and initial stocking of 6700 cuttings∙ha−1. The total
sample size was 430 trees, including a very variable number
of each species, ranging from the 12E. nitenstrees sampled
to 150 or 154 in the case of stools ofPopulusSRF (Table1).
The plant material used in the study was a local provenance in the case of each of the two autochthonous species and different number of genotypes of the fast growing species
(poplar and eucalypts). These were three for E. globulus
(commercial seeds, Anselmo and Odiel) and one E. nitens
(McAlister). The eucalypts were selected from blue gum stands or from crosses of F0 clones developed for drought resistance, rooting ability, growth, pest resistance and pulp yield, and the plants were raised from mini cuttings (López
et al. 2010). Among the 8 poplar genotypes, three
corre-sponded to P.×euramericana(I-214, AF2 and AF6), one
toP.×interamericana×P. nigra(Monviso), three ofP.× interamericana(Unal, Beaupre and Raspalje) and one forP. trichocarpa(Trichobel).
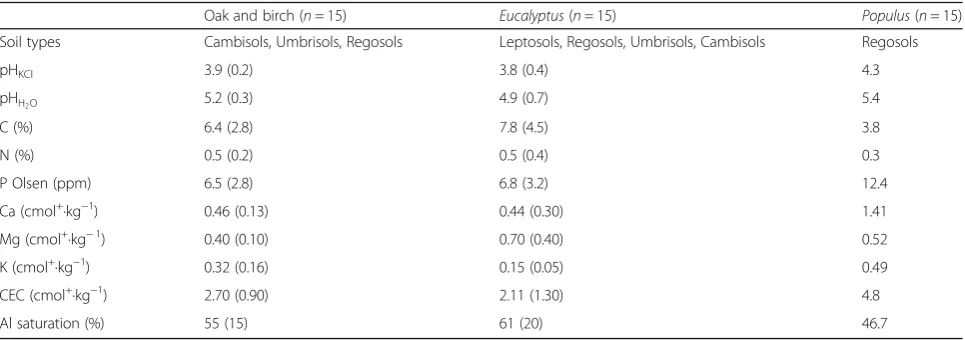
The four poplar SRF plots are located in a flat area in fluvial terraces of tertiary materials consisting of gravels of quartz, sandstone and slates bound in a matrix of clay and sand. The soil texture is sandy clay loam, with average percentages of sand (56%), silt (21.4%) and clay (22.6%). Average soil depth is 80 cm and the soil can be classified
as Regosol (IUSS Working Group WRB2015). The soil is
acidic, with high saturation of Al in the exchange com-plex, and a very low availability of P. The chemical
param-eters of the first 40 cm soil layer are presented in Table2.
As for the other species studied, the plots were mainly established in forest land not previously used for agricul-ture and the soils were mainly classified as Regosols and Umbrisols, with a relevant proportion of Cambisols for the native species and a minor presence of leptosols in the eucalypt plantations, according to the FAO classification
(IUSS Working Group WRB2015). The combined
infor-mation on chemical soil properties of the upper 40 cm soil layer, without separation of the samples of each species, is
shown in Table2.
The climate in the study region is characterized by mild
temperatures (annual average temperature 9 °C–14 °C)
and a slight water deficit in summer (average annual
rain-fall, 1000–2000 mm; average annual evapotranspiration,
700–850 mm; water deficit, 150–40 mm). Within this
general framework, birch stands are frequent in the moister areas, oak stands are widespread but occur more frequently in hilly areas, whereas eucalypt plantations mainly cover coastal areas with mild temperatures. The annual rainfall is lower and water deficit is higher in the basins where poplar is frequently planted.
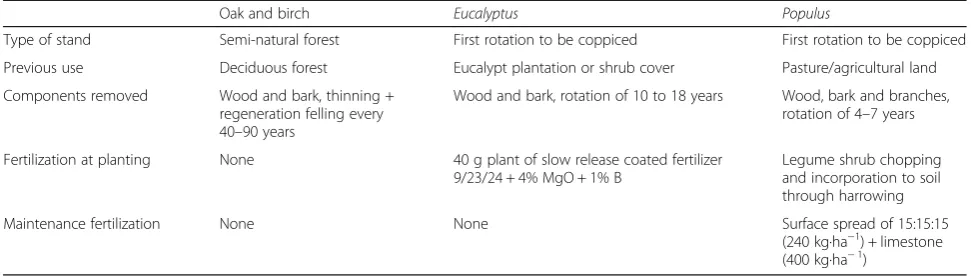
Management of each stand involves a specific pattern of harvesting biomass components, as well as management of logging residues and reapplication of nutrients through fertilization. Such management can be considered relatively
The site index values for E. globulusranged from 7 to 25, with an average of 16 m for dominant height (refer-ence age 7 years). The SI was calculated for each plot with
the EucaTool® application (Rojo-Alboreca et al.2015). The
average site index of the oak plots was 15.5 m (reference
age tr= 60 years), whereas the mean site index of birch
was 11.6 m (tr= 20), both of which are intermediate-high
values for the region (Diéguez-Aranda et al. 2009). This
variable was not included as a source of variation in the analysis because it could not be estimated for the very young poplar crops.
Tree sampling
The tree sampling differed slightly for the different groups of species. For birch, oak and eucalypts, three trees were selected per plot, to provide a good representation of the diameter range. Each plot corresponded to a specific genotype, and the sampling was carried out in summer. For poplar, the four plots under study each included 8 genotypes, and 10 (only 9 available in some cases) stools were thus chosen per plot and genotype, also with the aim of fully representing the diameter range. Bare poplar trees
(without leaves) were sampled in winter, the usual time for harvesting SRF.
In each harvested tree, we separated aboveground bio-mass into the following components: wood and bark (por-tion between ground level and tree apex), split into one m-long logs; thick branches (2.5 to 7 cm over bark); thin branches (0.6 to 2.5 cm over bark); twigs (< 0.6 cm over bark); and leaves including petiole. The components con-sidered for oak and birch had to consider branches of more than 7 cm, along with minor differences in the thin-end
diameters, as is detailed in Gómez-García et al. (2015). The
fresh weight of each tree component was measured and samples were obtained to determine the dry weight, per-centage of bark in the stem and nutrient contents and thus enable application of the complete weighting procedure
(Pérez-Cruzado and Rodríguez-Soalleiro2011). Wood with
bark was sampled by removal of three disks along the stem, considering relative heights of 0.15, 0.33 and 0.75. The disks were processed to remove and measure the bark compo-nent and thus the three samples were pooled together. Branches were sampled at random along the canopy, with at least one sample taken from each 1 m log, by applying a
sampling intensity of 15%–20% (maximum, 20 kg) of the
Table 1Descriptive statistics (mean and standard deviations, range of diameter and age) of the sampled trees (n= 430)
Quercus robur Betula pubescens Eucalyptus globulus
Eucalyptus nitens Populus euramericana andP.×interamericana× P. nigra
Populus×interamericana andP. trichocarpa
Management Semi-natural forest
Semi-natural forest
Forest plantation Forest plantation SRF SRF
Plots 6 9 25 12 4 4
Tree number 19 34 61 12 150 154
Diameter (cm) 18.1 (6.1) 5.8–37.7 13.9 (5.9) 7.7–27.1 15.3 (8.0) 5.8–37.7 20.8 (5.9) 13.3–34.1 4.4 (1.5) 1.9–9.1 5.0 (1.5) 2.0–8.6
Age (years) 74 (20.2) 53–108 33 (11.0) 22–64 8.6 (3.0) 1–17 10.8 (1.4) 9–13 5.6 (1.5) 4–7 5.3 (1.5) 4–7
Clones/ genotypes
1 1 3 1 4 4
The diameter refers to breast height diameter, except for the poplars, for which the basal diameter is provided
Table 2Descriptive statistics of the chemical parameters of the soils (mean value and standard deviations)
Oak and birch (n= 15) Eucalyptus(n= 15) Populus(n= 15)
Soil types Cambisols, Umbrisols, Regosols Leptosols, Regosols, Umbrisols, Cambisols Regosols
pHKCl 3.9 (0.2) 3.8 (0.4) 4.3
pHH2O 5.2 (0.3) 4.9 (0.7) 5.4
C (%) 6.4 (2.8) 7.8 (4.5) 3.8
N (%) 0.5 (0.2) 0.5 (0.4) 0.3
P Olsen (ppm) 6.5 (2.8) 6.8 (3.2) 12.4
Ca (cmol+∙kg−1) 0.46 (0.13) 0.44 (0.30) 1.41
Mg (cmol+∙kg−1) 0.40 (0.10) 0.70 (0.40) 0.52
K (cmol+∙kg−1) 0.32 (0.16) 0.15 (0.05) 0.49
CEC (cmol+∙kg−1) 2.70 (0.90) 2.11 (1.30) 4.8
Al saturation (%) 55 (15) 61 (20) 46.7
total number of both sizes of branches in each tree. The same sampling intensity was applied to leaves, thus remov-ing a subsample of the total amount. For poplar the sub-sampling did not include leaves, and all woody components and bark were pooled. The dead branches along the stem
were pooled with the thin branches in the case ofE. nitens.
The biomass components were dried at 65 °C until constant weight (i.e. for on average 3 days for the wood + bark component) and the material was ground to pass through a 0.5 mm sieve. The C concentration was deter-mined by combustion in a LECO CNS-ICP analyser. Total N was determined in a LECO-2000 analyzer, and
the plant material was digested with HNO3 in a
micro-wave oven for determination of nutrient concentrations. After the samples were digested, the concentrations of P, K, Ca, Mg, S and micronutrients were measured by
ICP-OES, with Barley 502–227 and EDTA included as
certified reference materials. Twelve variables were mea-sured for each sample. At the plot scale, biomass was calculated from measurements of each tree and applica-tion of genotype-specific equaapplica-tions of biomass
estima-tion (Diéguez-Aranda et al.2009; Oliveira et al.2017).
Data analysis
The boosted regression tree (BRT) approach was used to explore the dependence between the five major explanatory variables (biomass component, species, genetics, age and tree diameter) and nutrient concentrations. The final BRT model is an additive regression model in which individual terms are simple trees fitted in a stepwise process. We followed the procedure, code and the tutorial developed by
Elith et al. (2008). Tree complexity was established at an
intermediate value (tc= 4), relative to the sample size (total
number of observations, 1059), and the proportion of data to be selected at each step was set at 0.5 (bag fraction). The learning rate was slow enough to always produce more
than 1000 trees (lr= 0.01,nt> 1000), and the response type
considered was Gaussian. The previously mentioned code
first determines the optimalnt and then fits a final model
to all the data (Elith et al.2008).
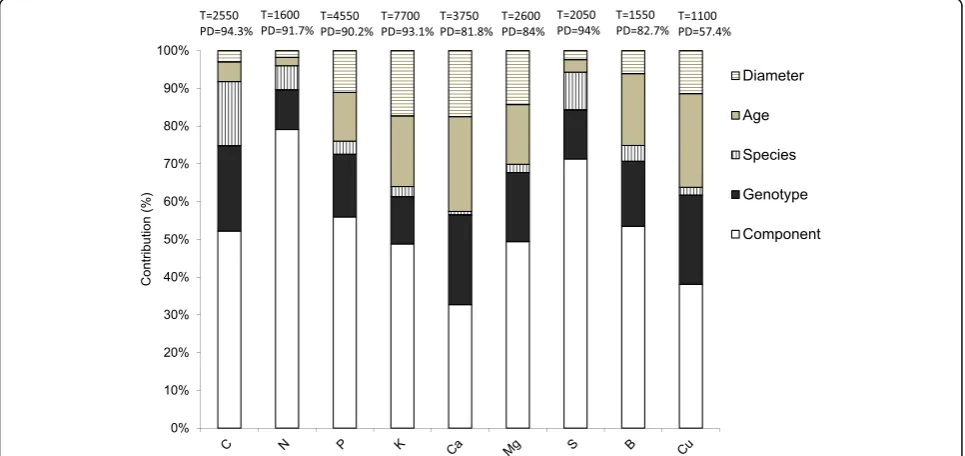
For each variable of interest (12 concentrations), the deviance explained by the BRT model and the relative contributions of predictor variables were computed. The contributions are based on the number of times a variable is selected for splitting, weighted by the squared improve-ment to the model in each split, averaged over all trees
(Friedman2001). Some of the variables are nested to others
(Genotype to Species) and so it would be difficult to explore the real contribution of each of them. In this case, we tried to derive the contribution of each variable by running a BRT analysis removing the other. The models were fitted
using the gbm package 2.1.3 (Ridgeway2017) implemented
in R (version 3.4.2, R Core Team2017).
Conventional statistical techniques were also used for each group of exploratory variables. Subsets of data were produced, as the effects (Species, Genetics, Age or size) should be adequately separated in the data. Diameter and age would be highly correlated and the relative contri-bution of each variable in the BRT model would be related to the correlation between variables. The woody compo-nent of poplar was assumed to be wood, to enable compari-sons among the six species. The effect of genetics was only able to be studied for those species in which several
geno-types were sampled (poplar andE. globulus). Likewise, the
effect of age was only able to be studied for those species for which a wide range of ages were sampled in a
chronose-quence (E. globulus,B. pubescens,Q. robur). The size effect
was only examined in poplar, in which the effect could be separated from the age effect. We applied one-way analysis of variance or covariance (ANCOVA), considering age or diameter as covariables when necessary. The analysis was implemented in R by using the following model:
yi¼μþGiþtþεj ið Þ ð1Þ
where yi is the variable analysed (concentrations of the
macro and micronutrients), μ is the mean value, t is stand age or the tree size, Giis the effect of each factor
considered andεiis the error term.
Table 3Management of the plots of the species considered
Oak and birch Eucalyptus Populus
Type of stand Semi-natural forest First rotation to be coppiced First rotation to be coppiced
Previous use Deciduous forest Eucalypt plantation or shrub cover Pasture/agricultural land
Components removed Wood and bark, thinning + regeneration felling every 40–90 years
Wood and bark, rotation of 10 to 18 years Wood, bark and branches, rotation of 4–7 years
Fertilization at planting None 40 g plant of slow release coated fertilizer 9/23/24 + 4% MgO + 1% B
Legume shrub chopping and incorporation to soil through harrowing
Maintenance fertilization None None Surface spread of 15:15:15
The Tukey’s studentized range test was used for pairwise comparisons. A logarithmic base model was used to model nutrient concentrations in biomass components when the ANCOVA indicated an age effect. The adjusted coefficient
of determination (Ra2
) and the mean square error (MSE) were used to evaluate the performance of the fitted models.
Results
Exploring the contribution of each source of variation
The BRT approach failed to provide a model for the (highly variable) concentrations of three of the micronutri-ents analysed (Fe, Mn and Zn). The regression tree ana-lysis showed that the biomass component was the most
important explanatory variable, always explaining≥33% of
the variance. The biomass component was particularly im-portant for explaining the variation in N, S, P and C con-centrations, and it was less important for Ca, Mg or K concentrations. The combination of the factors species and genotypes accounted for between 15.2% (K) and 39.6% (C) of the total deviation, and the genotype was much more important than the species itself. The factors age and diameter were comparatively more important for
explaining Ca, K, Mg and Cu concentrations (Fig.1).
Most nutrient concentrations varied widely depending on the component analysed, and followed one of three patterns. The pattern generally observed for several
macro-nutrients (N, P, K, S) was leaves > > twigs > thin branches≥
bark > thick branches ≈ wood. A different pattern was
observed for Ca and Mg, exclusively in eucalypts: leaves ≈
bark≈twigs > thin branches > thick branches≈wood,
indi-cating the relatively high content of both macronutrients in
the bark component. A third pattern was observed for C:
leaves > twigs > thin branches≈thick branches≈wood >
bark, indicating the relatively low content of C in the bark (with the exception of birch, as we will detail afterwards).
The boxplots for macronutrients are shown in Fig.2.
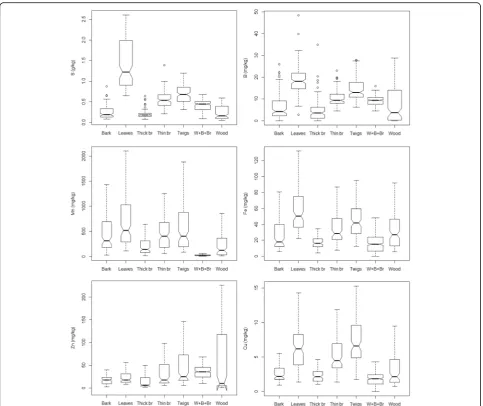
The general pattern observed for micronutrients (with
slight variations) was leaves > twigs > thin branches ≈
thick branches≈bark≈wood (Fig.3).
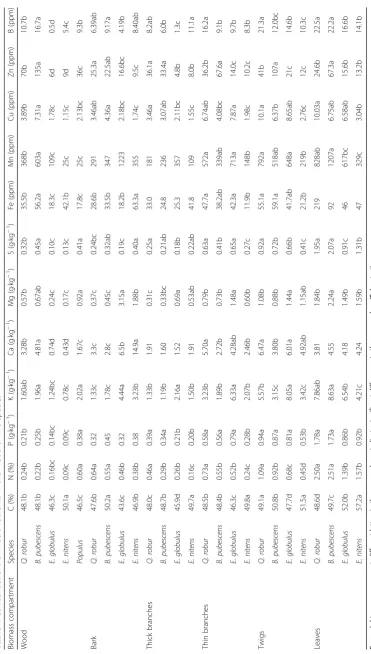
Effects of species and genotype for each component
The contribution of the Species given by the BRT analysis is limited if the genotype is included as an explanatory vari-able. If the genotype was removed, the Species factor
increased their contributions to 20%–37% of the variation,
depending on the nutrient. Analysis of the effect of species on each biomass component revealed significant differences in most cases, particularly for the wood component
(Table4). The C concentrations in wood were highest inE.
nitensand lowest in the poplars, probably because the pop-lar trees were relatively young. The difference between both species of eucalypts was noteworthy, as the C concentration
in all components was lower inE. globulusthan inE. nitens.
The C concentrations in wood are higher than the ones in bark for all species, with the exception of birch. The con-centrations of the other macronutrients (particularly N and P) were usually highest in poplar, intermediate in some birch and oak and lowest in the eucalyptus species. This general trend was not observed for Ca, the concentrations of which were highest in birch and oak wood.
More specifically, the nutrient concentrations were
slightly higher in P. × euramericana than in the P. ×
interamericana or P. trichocarpa genotypes (data not shown). Thus, the latter group needed immobilization of 22% less N, 25% less P, 23% less K, 9% less Ca and 26%
less Mg thanP.×euramericanain the woody components
to produce a ton of wood. A similar result was obtained
for the comparison betweenE. globulusandE. nitens, and
the latter required 44% less N, 36% less P, 37% less K, 42%
less Ca and 29% less Mg thanE. globulusper unit of wood
produced. Indeed,E. nitenscontains the lowest
concentra-tions of these nutrients of the five species studied. The ratio of Ca:Mg concentrations in wood was very different in the three groups of species: 6.5 for oak and birch, 2.8 for poplar and only 1.9 for eucalypts.
The foliar concentrations of the following nutrients were higher in both deciduous species than in the eucalypts: N (+ 69%), P (+ 97%), K (+ 53%), Mg (+ 32%), S (+ 81%) and B
(+ 46%) (Table4). The Ca concentrations did not differ
sig-nificantly between species. The foliar C concentrations
were higher in the eucalypts, particularlyE. nitens, than in
the other species. Comparison with poplar was not pos-sible, as leaves were not collected from this species. Con-sidering the bark, the mean concentrations of the alkaline elements were higher in both eucalypt species than in the
birch and oak.E. nitensshows particularly high Ca
concen-trations in bark. The K, Ca and Mg concenconcen-trations in the bark of birch and oak were similar to those in wood. The nutrient concentrations in the branches and twigs of euca-lypts are generally similar to those in the autochthonous species.
The genotype contributed notably to explain the
vari-ance of nutrient concentrations (Fig. 1). If the species
factor is removed from the BRT, it is the genotype which
assumes its contribution (data not shown). The concen-trations of N, K, P, Ca, Mg, S and B in wood
compo-nents differed in genotypes of the same species of E.
globulus and of poplar. The concentrations were always
lowest in the threeE. globulus genotypes (Table 5). The
concentrations were usually highest in four poplar geno-types (I-214, AF2, AF6 and Monviso), but with some overlap with a second group formed by Raspalje, Beau-pré, Unal and Trichobel (particularly for P, Ca and S). This finding indicates the importance of choosing effi-cient genotypes that can immobilize low amounts of nutrients per unit biomass produced. Nutrient
concen-trations were much higher in commercial E. globulus
seedlings than in the clones, especially for P, Ca and Mg. The F1 clone Odiel was much more efficient than Anselmo.
Effects of age and size
Tree age did not appear to affect the nutrient concentrations in leaves, bark or twigs. However, P and K concentrations in the branches of the eucalypts were negatively correlated with age. The concentrations of nutrients in the wood compo-nent were also usually negatively correlated with age. This
was observed for N (ρ=−0.45, p= 0.0003), P (ρ=
− 0.50, p< 0.0001), K (ρ=−0.47, p= 0.0002), Ca (ρ=−
0.19,p= 0.04), S (ρ=−0.22,p= 0.03) and Cu (ρ=−0.31,
p= 0.001) in the eucalypts and for P (ρ=−0.31, p =
0.015), K (ρ=−0.25, p= 0.03), Ca (ρ=−0.25, p= 0.03),
Mg (ρ=−0.14,p= 0.04), S (ρ=−0.42,p= 0.001), Cu (ρ
=−0.34,p= 0.005) and B (ρ=−0.36,p= 0.008) in the
de-ciduous species. The nutrients affected by this trend were thus slightly different in both groups of species, as was the intensity of the relationship. It was not possible to fit an
accurate regression model to the pattern due to the high level of intrinsic variation in the data, although the values
for eucalypts appeared to stabilize from age 7–12 years
onwards.
Although no age-related trends in C concentration were observed for any individual species, the pooled data for woody components (excluding bark, leaves and twigs) showed a pattern of increasing C concentrations with age. A parametric log-linear fit is provided for
predic-tion purposes (Fig. 4). This finding indicates the need to
consider an appropriate rate of C sequestration per unit of woody biomass depending on the type of management (SRF, plantation for small timber production or semi-natural for-ests), as an average value of 50% could only be sustained in long rotations.
As regards the effect of size of the tree, no correlations between nutrient concentrations and size were found in the case of poplar SRF data, which is the information able to clearly separate the effect of age from that of the tree dimension.
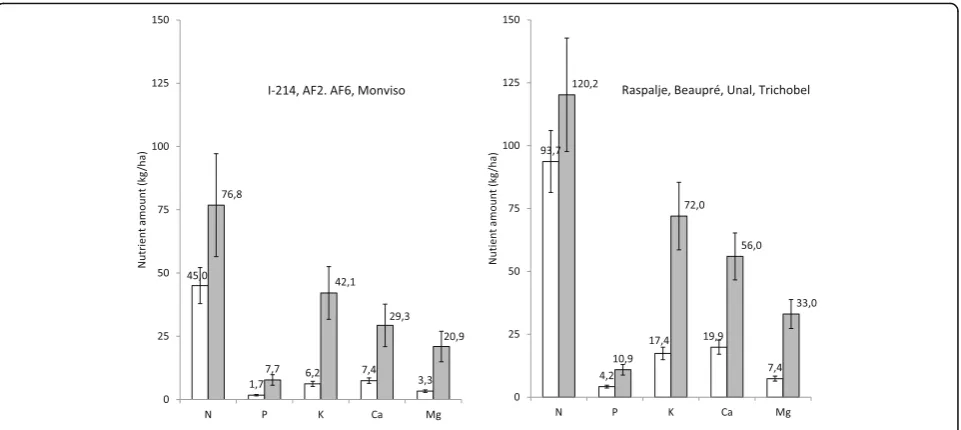
Nutrient content at the end of the rotation
In the poplar plantations, as all the genotypes were present in each plot, it was possible to compare the total amount of nutrients accumulated in the woody biomass (and thus likely to be removed from site by harvesting
the biomass). Comparison of the two groups (Fig.5)
re-vealed that the Raspalje, Beaupré, Unal and Trichobel genotypes were able to absorb more nutrients from the same soil than the other genotypes (91% more Ca and
Table 5Concentrations of macronutrients in wood of 11 genotypes corresponding of two species ofPopulusand one species of
Eucalyptus
N (%) P (g∙kg−1) K (g∙kg−1) Ca (g∙kg−1) Mg (g∙kg−1) S (g∙kg−1) B (mg∙kg−1)
0.78a AF6 0.57a AF6 2.53a AF6 1.99a I-214 1.29a I-214 0.50a UNAL 10.9a AF6
0.66b MON 0.46ab I-214 2.28ab I-214 1.81a MON 1.12ab AF2 0.47ab I-214 10.5a AF2
0.64bc I-214 0.40bc MON 2.22abc MON 1.68a AF2 0.99bc AF6 0.43abc AF6 10.4a MON
0.63bc AF2 0.36bc BEA 2.17abc AF2 1.63a RAS 0.91bc MON 0.43abc RAS 10.1ab I-214
0.57bcd BEA 0.35bc RAS 1.96abcd TRI 1.60a BEA 0.83bc TRI 0.42abc BEA 8.6bc TRI
0.56cde RAS 0.34bc TRI 1.91abcd BEA 1.58a TRI 0.83bc BEA 0.42abc MON 8.0c UNAL
0.52de UNAL 0.32bcd AF2 1.68bcd RAS 1.58a AF6 0.79bc RAS 0.35bc TRI 7.7c RAS
0.46e TRI 0.27cde UNAL 1.45 cd UNAL 1.57a UNAL 0.67 cd UNAL 0.34c AF2 7.6c BEA
0.18f SEED 0.20def SEED 1.32d ANS 1.47a SEED 0.32de SEED 0.13d SEED 1.1d SEED
0.18f ANS 0.15ef ANS 1.24d ODI 0.50b ANS 0.20e ANS 0.10d ANS 0.3d ANS
0.14f ODI 0.10f ODI 1.16d SEED 0.44b ODI 0.20e ODI 0.08d ODI 0.2d ODI
Different letters in the same column indicate significant differences in the mean values between genotypes (Tukey test). Only the nutrients showing significant differences are shown
71% more K for an age of 7 years). The most efficient group of poplar genotypes showed an average
productiv-ity of 5.5 Mg∙ha−1∙year−1, which is 2.4 times higher than
the average yield of the first group, which mainly com-prises Euro-American crosses.
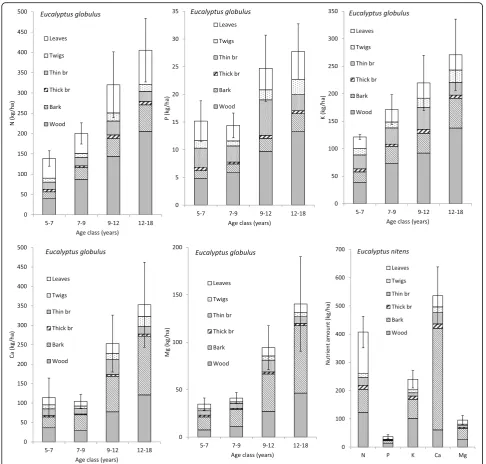
The N, P, K, Ca and Mg contents in blue gum were
calculated on a per ha basis for 4 age classes (5–7, 7–9,
9–12 and 12–18 years). The number of plots available
for each class ranged between 5 and 9. The results of
Fig. 6 show the pattern of nutrient accumulation in
aboveground biomass, which keeps increasing from age
9–12 to the 12–18 age class. The standard errors are
lower for the 7–9 age class because 9 plots were available
in this case. The relative contribution of wood increased with age (50, 48, 51, 34 and 33% of N, P, K, Ca and Mg, respectively, is contained by the wood at rotation age), in-dicating that the increase in biomass largely compensated for the decreases in nutrient concentrations. The share of bark, particularly important for Ca and Mg, also increased
with age. The results for E. nitens after grouping all the
plots together are also shown in Fig.6.
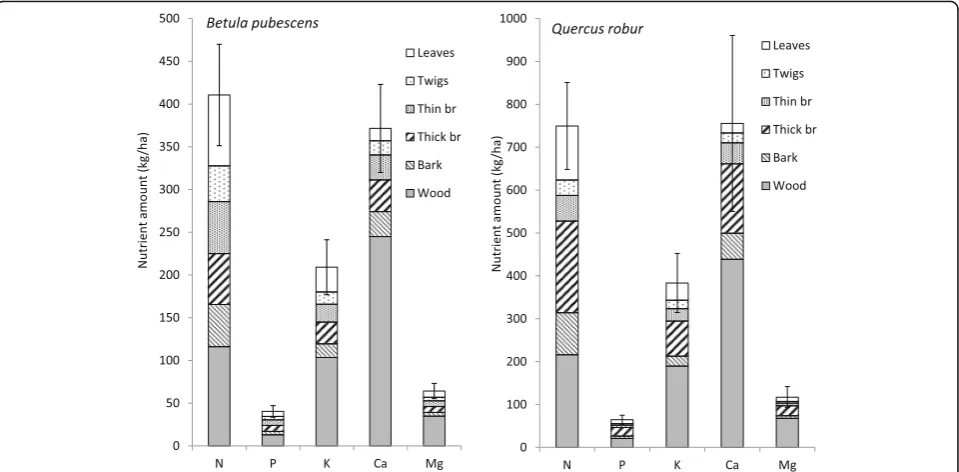
The nutrient amounts in native broadleaved species were calculated as mean values after grouping the
plots available for each species. The results of Fig. 7
show that the oak stands hold in the aboveground biomass large amounts of nutrients (750, 65, 383, 755
and 117 kg∙ha−1 of N, P, K, Ca and Mg, respectively),
as a result of an average age of 74 years. The average age of birch plots is 33 years and the total content of
nutrients is lower: 410, 40, 209, 371 and 64 kg∙ha−1
of N, P, K, Ca and Mg, respectively. For both species, but more clearly in the case of oak, the proportion of thick branches is very relevant.
Comparison of 4 scenarios of species and management
In order to facilitate discussion of the results, we consid-ered four different combinations of species and manage-ment regimes:
1) PoplarSRF7. Poplar SRF with efficient poplar genotypes, rotation length of 7 years and removal of leafless aboveground biomass.
2) EucaSRF6. Eucalypt SRF considering all genotypes ofE. globulus(represented by the plots in the age interval 5–7 years), rotation length of 6 years and removal of whole aboveground biomass.
3) Eucapulp15. Conventional forest plantation of Eucalypt blue gum (considering all genotypes) with rotation length of 15 years and removal of only the wood component.
4) Oakbirch. Combined Oak and birch management with rotation of 35 (birch) or 75 (oak) years, removal of wood, bark and thick branches to produce timber and firewood.
Three sets of variables were calculated: the nutrient as-similation index (NAI), as an indicator of efficiency in bio-mass production per unit nutrient; the mean annual nutrient removal (MANR) on a per ha basis; and the per-centage of the available soil nutrients removed during har-vesting (PASNR). For N removal, the percentage removed refers to the total N mineralization expected with a fixed annual rate of 1% of N mineralization. The values
ob-tained are presented in Table6.
The mean annual nutrient removals, except for N, were higher for eucalypt SRF than for poplar. The lower
values are associated with intermediate or long
rotations in the regimes including both autochthonous species. The scenario of eucalypt managed for pulp show lower MANR values than the SRF of eucalypts and the NAI is 1.7 to 3.9 times higher than the values for poplar and eucalypts SRF. The MAI associated to
this alternative is 16.3 under bark (m3∙ha−1∙year−1),
which using the values of specific wood consumption at
that age (SWC, under bark (m3∙MgADP−1), i.e. the
amount of debarked wood required to produce a ton of
air dried pulp, Resquin et al. 2012), means a
productiv-ity of 5.51 MgADP∙ha−1∙year−1.
Discussion
The study findings emphasize the importance of the bio-mass component as the main factor explaining nutrient concentrations in a variety of combinations of broadleaved species and management regimes. This has been shown in several studies and for different species (Merino et al.
2005; Hernández et al.2009; André et al.2010) and is the
main basis for proposing management scenarios in which the compartments to be removed are selected according to their impact in terms of nutrient removal per unit of
biomass (Achat et al.2015; Viera et al.2015).
The three types of management covered by the data represent specific systems with very different goals and products, and applied to different species and in specific locations. Comparative studies of several species growing on the same soils enable a better understanding of differ-ences between species under similar conditions of nutrient
availability (Hagen-Thorn et al.2004). A limitation of this
study is the lack of representation of all the species studied in the same sites. Even so, the dataset used shows that N, P, K, Ca and Mg concentrations in the woody components (except bark) are consistently higher in poplar, oak and birch than in eucalypts, and these macronutrients are greater than the ones reported for conifers in the same
region (Merino et al.2005). The variability among
broad-leaved species found in this study is consistent to the range of values reported in the literature (Wang et al.
1991; André et al. 2010; Gómez-García et al. 2016)
al-though studies of the group of species considered here are scarce.
Calculation of carbon storage in biomass components should take into account tree age rather than average
carbon concentration in biomass components. Longer rotations would be beneficial for carbon stock in bio-mass and products, as well as for bioenergy substitution
(Pérez-Cruzado et al., 2012). The present findings also
show that C concentrations did not reach 50% at older ages for any of the biomass components studied, except leaves. Previous studies have shown that average C con-centrations are variable depending on species, tree size and/or age, and that the measured values in the trunk
do not reach 50% (Elias and Potvin 2003), but can be
very closed to this figure for wood of a 14 years-old poplar
plantations (Cruz Calleja, 2005). Overall, considering all
the plots studied, the mean C concentration averaged with biomass was 46.5% for poplar SRF and 45.6% for wood and bark in eucalypts. Considering the whole above-ground biomass, these figures are 47.7% for eucalypt, 48.3% for oak and 49.3% for birch. These results indicate the need to consider the variation in C concentration with age to simulate the amount of carbon captured and the limitations of the studies that used a fixed concentration
(Giménez et al.2013).
Fig. 7Nutrient amounts in aboveground biomass components ofBetula pubescens(n= 9 plots, left) andQuercus robur(n= 6 plots, right). Note the difference in the scale of they-axis
Table 6Comparison of nutrient assimilation index (NAI), mean annual nutrient removal (MANR) and percent of available soil
nutrients removed (PASNR) for five species-forest management combinations
Regime N° Plots MANR (kg∙ha−1∙year−1) PASNR (%) NAI (Mg∙kg−1) of nutrient
N P K Ca Mg N P K Ca Mg N P K Ca Mg
PoplarSRF7 4 23.5 1 4.5 5 2.0 19 29 16 7 18 0.21 2.94 0.51 0.63 1.20
EucaSRF6 6 20.0 3 20 23 7.0 15 75 69 43 14 0.28 2.57 0.31 0.34 1.12
Eucapulp15 5 13.7 0.9 9.2 8 3.1 9 65 78 46 18 0.64 9.95 0.96 1.09 2.84
Short rotation forestry
The SRF approach, which is applicable to both poplar and eucalypts, is devoted to the growth of small trees for biomass production in the short term. This management system provides little opportunity to remove but the
whole aboveground biomass (Morhart et al.2013), and it
thus entails the extraction of large amount of nutrients every few years. In the case of the more efficient genotypes
of poplar, with an average yield of 5.5 (t∙ha−1∙year−1),
com-parison between the removal rates and the available amounts of nutrients in the soil show that 29% of the available P and 19% of the expected periodic N mineralization would be retained in the aboveground biomass after 7 years of growing poplar. Even if nutrient concentrations of poplar in this study are high compared to the other species studied, it is known that poplar has lower concentrations when compared to other biomass
fuels, as Miscanthus (Jenkins et al.1998), but also higher
than willow (Tharakan et al.2003).
The average yearly removal rates are lower (particularly for P and Ca) than reported for more productive
planta-tions (Adegbidi et al.2001; Morhart et al.2013). This is a
result of lower nutrient concentrations, if compared to the combined wood + branches + bark component reported by other authors, particularly in the case of Ca and P (Jug
et al. 1999; Tharakan et al. 2003) or to the proleptic
branches reported by (Vanbeveren et al., 2016). The
macronutrient concentrations found in poplar plantations for wood production in Spain were also higher than the
ones of this study (Cruz Calleja,2005). The concentrations
of Mg and N are comparatively high in this study. The rates of removal found in 7-years old hybrid aspen planta-tions in Estonia are nevertheless comparatively lower than
the ones found in this study (Tullus et al.2009).
The poplar data reported in the present study, which correspond to only two age groups, enable separation of the effects of age and size. The results do not support the existence of different nutrient concentrations in trees of different sizes. Different studies have reported that the reduction of bark percentage decreases with tree size
(Morhart et al.2013), and thus the management alternatives
of lengthening the rotation or reducing the stool density have been proposed. A reduction of nutrient concentrations with age has been previously reported for aspen (Rytter
2002), but considering a rotation longer than the 7 years
considered in our study would be inoperative.
With the results of the present study, the management alternative more prone to savings of nutrient removal is the selection of efficient genotypes, even within a particular crossing. Nutrient efficient aspen clones have been identi-fied, yielding a potential saving of 5% of nutrients (Rytter
and Stener 2003). As these authors did not find either
significant relationships between nutrient concentra-tions and size, they suggested the possibility to select
nutrient-efficient clones without significantly sacrificing genetic gain for growth. The most productive clone in this study (TRICHOBEL) show nutrient assimilation in-dices of 0.22, 2.94, 0.51, 0.63, 1.20, 2.86, 117, 49, 74, 27
and 600 Mg∙kg−1for N, P, K, Ca, Mg, S, B, Mn, Fe, Zn
and Cu, respectively. Even so, with the results provided, it would be difficult to select a poplar clone more effi-cient for all macronutrients than the others belonging to the same crossing. It is also clear that low nutrient concentrations enhanced feedstock quality decreases the fouling and corrosion processes on furnace walls
and increases the ash quality (Vega-Nieva et al.2016).
The application of SRF to eucalypts leads to the removal of large amounts of nutrients, because harvesting in this case includes a rule the leaves, bark and branches, as long
as wood (Guo et al.2002; Eufrade et al.2016). The data of
this study for eucalypts in the age class 5–7, even if the
stand density is the usual one for pulp forest plantations
(average density for these plots is 1120 trees∙ha−1) could
be representative of the large amounts of nutrients
re-moved if the whole tree is rere-moved, as shown in Table6
for an average yield of 6.5 Mg∙ha−1∙year−1. If compared to
the poplar figures, these values means a similar amount of
N or K, but 3–4 times more P, Ca and Mg removed per
year to produce just 20% more biomass and less NAI, except for N. As the soils are on average poorer than the poplar ones, these figures suppose the extraction of large percentages of available P and exchangeable K and Ca
amounts. Eufrade et al. (2016) and Guo et al. (2002)
re-ports average yearly removal rates well above the ones proposed in this study, along with consistently higher
bio-mass yield. Sochacki et al. (2013) reported forE. globulus
very similar rates of removal than the ones of this study.
Conventional pulp plantations
Study of biomass production, nutrient removal during logging operations and management of logging residues is essential to prevent negative effects on sustainable productivity and soil fertility in this management system
(Gonçalves et al. 2013; Rubilar et al. 2018). Unlike the
previous type of management, several commercial for-estry operations leave different biomass compartments
as logging residues in this case (Achat et al. 2015). The
findings of this study confirms the importance of stem bark in terms of the Ca and Mg aboveground amounts ofE. globulus, as removal at age 15 years would increase 32%, 24%, 39%, 225% and 254% if undebarked wood is
removed from the forest. In the case ofE. nitens, the
ra-tios of Ca concentrations in bark related to wood found
in this study were clearly higher forE. nitens(34.6) than
for E. globulus (8.8), thus showing that the relevance of bark as an aboveground compartment storing Ca is
more marked forE. nitens, as has been previously shown
the recommendation to leave in place this biomass com-ponent, whose value as a product is only related to the generation of energy at the pulp factories. The present study findings indicate that the average rates of nutrient removal for a rotation of 15 years and harvesting exclu-sively the wood component are lower than the eucalypt SRF scenarios and similar (N, P, Mg) or higher (K, Ca)
than the poplar SRF scenario (Fig. 7). At this stage, the
proportion of aboveground nutrients accumulated in the wood ranged between 33% for Mg till 51% for K and N. These figures are higher than those reported by Hernández
et al. (2009) when bark is left in place and similar to the
ranges reported by Merino et al. (2005) for the same region.
The percentage of nutrients found in the trunk ofE.
globu-lus(wood and bark) at the end of rotation in this study are
similar to the ones reported for tropical plantations in the case of N, Ca and Mg, but higher for K and lower for P
(Laclau et al.2010; Rocha et al.2016).
The recommendations for nutrient management should be based not only on the amount of nutrients removed at clearfelling, but also on the entire budget of inputs and outputs of nutrients, including the levels of soil supply
needed to maintain production (Laclau et al. 2005). The
information already available shows that the overall bud-gets may be negative if the parent materials have a low content of Ca and Mg, the soil reserves are scarce, the rate of rainwater inputs are low and the stands have strong
mineral uptake (Dambrine et al.2000; Merino et al.2005).
The intensity of losses of non-acidic cations is directly re-lated to the soil nutrient status and also to the
manage-ment practices used (Madeira and Araújo2015).
Age and genetic material directly affect the concentra-tions of nutrients in each component and, consequently, the estimation of nutrients removal, thus giving differences among different decisions in the management of these plantations. On the one hand, comparing the data of this study for clones and seedlings, the NAI, or cost per unit of wood yield in terms of two of the most limiting nutrients in the area (P and Ca) may therefore be re-duced considerably (45 and 35% less, respectively) by using genetically improved material. The selection of genotypes with more efficiency in the use of nutrients has been applied for hybrid eucalypts in Brazil (Rosim et al.
2016). In a study carried out in Congo, Safou-Matondo et
al. (2005) demonstrated the superiority of several clones of
Eucalyptus urophylla regarding P (+ 72%) and Ca (+ 43 to
+ 59%) assimilation index. Santana et al. (2002) indicated
that as differences in NAI are also influenced by site param-eters. Tree breeding programmes should therefore select genotypes with NAI compatible with natural soil fertil-ity or with fertilization practices. NAI is a measure of the ability of plants to respond to fluctuating resource availability and has been shown to increase with
nutri-ent availability (Santana et al.2000). A limitation of the
present study is therefore the lack of information of dif-ferent eucalypt genotypes in the same site, even if seed-lings plots were not apparently placed in sites more productive than the clonal plots. We have also to con-sider that the total amount of nutrients removed may be similar if more biomass is removed in the case of clones. With the overall data of this study, we estimate that clones are 14% more productive than seedlings at the same rotation age.
The influence of age on nutrient concentrations in tree parts, particularly for the wood component, provides an opportunity to lengthening the rotation to increase the biomass yield per unit of nutrient stored in the removed compartment. Such possibility can come along with de-creases in mean annual increment of timber volume. The values shown were obtained for the set of plots used in this study (average site index slightly above the average for the region, SI = 17 m), and we have to consider that the pattern of mean annual increment depends on site productivity, peaking before for very productive sites. Negative trends of nutrient concentration with age were previously
demon-strated by Laclau et al. (2000) for a hybrid eucalypt
chrono-sequence or by Rocha et al. (2016). The influence of age on
wood nutrient concentrations is due to the higher nutrient concentrations in the younger and more physiologically active tree tissues, leading to higher nutrient concentra-tions in sapwood than in heartwood (see Grove et al.
1996 for eucalypts and Augusto et al.2008, for maritime
pine). For Eucalyptus globulus in the Iberian Peninsula,
heartwood of 9 years old trees has been shown to
corres-pond to 17%–30% of the total tree volume (Gominho and
Pereira 2000), showing that the sapwood component of
the tree bole probably represents only the outer 7–8 years
of tree growth. Older trees will have a narrow band of nutrient rich sapwood surrounding a relatively nutrient poor woody biomass enriched in carbon.
Extensively managed stands of native species
The results of this study show that for plots within the same region, nutrient concentrations were higher in above-ground biomass components of the native broadleaved spe-cies than in other spespe-cies. This may be associated with the
slightly better nutrient conditions in soils (Table 2). The
concentrations determined in this study are higher than those reported for oak and birch by Hagen-Thorn et al.
(2004). These authors observed relatively small differences
between this pair of broadleaved species, although, as in the present study, the concentrations of Mg were higher in birch leaves than in oak leaves. The share of wood in the nutrient amounts found in this study are higher than the ones reported previously for oak in the same region
(Balboa-Murias et al.2006), as a result of the
bark and thick branches would suppose the average annual removals lower than the other scenarios, except for Ca, a
result already shown previously (Gómez-García et al.2016).
The removals would represent a large proportion of the available nutrient contents in soils, indicating that, even in these species, care should be taken as to the biomass com-ponents removed and the felling pattern applied. As a result
of a lower productivity (2.4 Mg∙ha−1∙year−1 for oak and
2.5 Mg∙ha−1∙year−1 for birch), the NAIs for these species
are much lower than for poplar or eucalypts in this study. This is not surprising if we consider that these native species are not specifically bred or managed to maximize biomass production. The removal of additional biomass components would increase the nutrient removal, and the harvesting methods and management of logging residues should therefore be adapted to the tree species and site
fertility (Helmisaari and Kaarakka2013).
Conclusions
Nutrient concentrations in biomass components varied with the component considered, plantation age (the con-centrations of most nutrients, except C, tended to decrease) and genetic material (several clones were more efficient regarding nutrient removal per unit of wood volume). Nu-trient sustainability was lower in SRF than in forest planta-tions, and it was lower in forest plantations than in natural stands. Poplar in SRF has the great advantage that the life-less aboveground biomass can be removed.
Additional file
Additional file 1:Nutrient database. (XLSX 214 kb)
Abbreviations
ADP:Air dried pulp; ANCOVA: Analysis of covariance; BRT: Boosted regression trees; CEC: Cation exchange capacity; EDTA: Ethilenediaminetetraacetic acid; EU: European Union; MAI: Mean annual increment; MANR: Mean annual nutrient removal; MSE: Mean square error; NAI: Nutrient assimilation index; PASNR: Percent of available soil nutrients removed; RE: Renewable energy; SRF: Short rotation forestry; SWC: Specific wood consumption
Acknowledgements
The authors thank Prof. Gadow for encouraging the development of this study and to Dr. Diéguez-Aranda for providing oak and birch data.
Funding
Funding for this research was obtained from MINECO (Spain) through the project RTA2014–00007-C03–02. Additional funding was derived from the projects AGL2010–22308-C02–01 and AGL2007–66739-C02–01/FOR.
Availability of data and materials
Presented as an Additional file1.
Collection of plant samples
The authors declare that the collection of plant samples was done according to the Spanish and European regulations with the required permissions.
Authors’contributions
RRS conceived the experiment, performed the analysis of data and lead the writing. CEF, JDGV, ARA and NO carried out the sampling and experiments.
EGG, FM, HS and CPC provided critical feedback and helped to shape the analysis and the manuscript. All authors read and approved the final manuscript.
Authors’information
RRS, HS, ARA lead the projects that provide the dataset used in this study.
Ethics approval and consent to participate
Not applicable.
Consent for publication
Not applicable.
Competing interests
TThe authors declare that they have no competing interests.
Author details
1
Sustainable Forest Management Unit (UXFS), Department of Plant Production and Engineering Projects, Universidade de Santiago de Compostela (USC), Rúa Benigno Ledo, Campus Terra, 27002 Lugo, Spain. 2Centro de Investigación Forestal de Lourizán, Xunta de Galicia. Carretera de Marín km 3.5, 36153 Pontevedra, Spain.3Sustainable Forest Management Unit (UXFS), Department of Agroforestry Engineering, Universidade de Santiago de Compostela (USC), Lugo, Spain.4Universidad de Concepción, Facultad de Ciencias Forestales, Victoria, 631 Concepción, Chile.5Forest Systems and Resources Department, Centre for Forest Research, INIA, Crta. de la Coruña km 7.5, 28040 Madrid, Spain.
Received: 30 April 2018 Accepted: 5 September 2018
References
Achat DL, Deleuze C, Landmann G, Pousse N, Ranger J, Augusto L (2015) Quantifying consequences of removing harvesting residues on forest soils and tree growth - a meta-analysis. For Ecol Manag 348:124–141.https://doi. org/10.1016/j.foreco.2015.03.042
Adegbidi HG, Volk T, White EH, Abrahamson LP, Briggs RD, Bickelhaupt DH (2001) Biomass and nutrient removal by willow clones in experimental bioenergy plantations in New York state. Biomass Bioenergy 20:399–411.https://doi.org/ 10.1016/S0961-9534(01)00009-5
André F, Jonard M, Ponette Q (2010) Biomass and nutrient content of sessile oak (Quercus petraea(Matt.) Liebl.) and beech (Fagus sylvativaL.) stem and branches in a mixed stand in southern Belgium. Sci Total Environ 408:2285– 2294.https://doi.org/10.1016/j.scitotenv.2010.02.040
Angelsen A, Brockhaus M, Sunderlin WD, Verchot LV (2012) Analysing REDD+. Changes and choices. CIFOR, Bogor, p 426
Augusto L, Meredieu C, Bert D, Trichet P, Porté A, Bosc A, Lagane F, Loustau D, Pellerin S, Danjon F, Ranger J, Gelpe J (2008) Improving models of forest nutrient export with equations that predict the nutrient concentration of tree compartments. Ann For Sci 65:808.https://doi.org/10.1051/forest:2008059
Balboa-Murias M, Rojo A, Álvarez-González JG (2006) Carbon and nutrient stocks in matureQuercus roburL. stands in NW Spain. Ann For Sci 63:557–565.
https://doi.org/10.1051/forest:2006038
R Core Team (2017) R: a language and environment for statistical computing. R Foundation for Statistical Computing, Vienna.https://www.R-project.org/. Accessed 30 Apr 2018.
Cruz Calleja AC (2005) Dinámica de nutrientes en parcelas experimentales de Populus x euramericana (Dode) Guinier“I-214”. Tesis doctoral. Universidad Politécnica de Madrid. Escuela Técnica Superior de Ingenieros Agrónomos.
http://oa.upm.es/328/1/ANA_CRUZ_CALLEJA.pdf. Accessed 30 Apr 2018 Dambrine E, Vega JA, Taboada T, Rodrigue L, Fernandez C, Macias F, Gras JM (2000)
Bilans d'éléments minéraux dans de petits bassins versants forestiers de Galice (NW Espagne). Ann For Sci 57:23–38.https://doi.org/10.1051/forest:2000102
Díaz-Balteiro L, Rodríguez LC (2006) Optimal rotations onEucalyptusplantations including carbon sequestration-a comparison of results in Brazil and Spain. For Ecol Manag 229:247–258.https://doi.org/10.1016/j.foreco.2006.04.005
Don A, Osborne B, Hastings A, Skiba U, Carter M, Drewer J, Flessa H, Freibauer A, Hyvonen N, Jones MB, Lanigan GJ, Mander U, Monti A, Djomo SN, Valentine J, Walter K, Zegada-Lizarazu W, Zenone T (2012) Land-use change to bioenergy production in Europe: implications for the greenhouse gas balance and soil carbon. GCB Bioenergy 4:372–391.https://doi.org/10.1111/j.1757-1707.2011.01116.x
Elias M, Potvin C (2003) Assessing inter- and intra-specific variation in trunk carbon concentration for 32 neotropical tree species. Can J For Res 33:1039–1045.
https://doi.org/10.1139/x03-018
Elith J, Leathwick JR, Hastie T (2008) A working guide to boosted regression trees. J Anim Ecol 77:802–813.https://doi.org/10.1111/j.1365-2656.2008.01390.x
EU (2009) Directive 2009/28/EC of the European Parliament and of the Council of 23 April 2009 on the promotion of the use of energy from renewable sources and amending and subsequently repealing Directives 2001/77/EC and 2003/30/EC. O.J.o.t.E. Union (ed Union OjotE). EU, Brussels
Eufrade HJ, Melo RX, Sartori MMP, Guerra SPS, Ballarín AW (2016) Sustainable use of eucalypt biomass grown on short rotation coppice for bioenergy. Biomass Bioenergy 90:15–21.https://doi.org/10.1016/j.biombioe.2016.03.037
Friedman JH (2001) Greedy function approximation: a gradient boosting machine. Ann Stat 29:1189–1232
Giménez JC, Bertomeu M, Diaz-Balteiro L, Romero C (2013) Optimal harvest scheduling inEucalyptusplantations under a sustainability perspective. For Ecol Manag 291:367–376.https://doi.org/10.1016/j.foreco.2012.11.045
Gómez-García E, Crecente-Campo F, Barrio-Anta M, Diéguez-Aranda U (2015) A disaggregated dynamic model for predicting volume, biomass and carbon stocks in even-aged pedunculate oak stands in Galicia (NW Spain). Eur J Forest Res 134:569–583.https://doi.org/10.1007/s10342-015-0873-3
Gómez-García E, Diéguez-Aranda U, Cunha M, Rodríguez-Soalleiro R (2016) Comparison of harvest-related removal of aboveground biomass, carbon and nutrients in pedunculate oak stands and in fast-growing tree stands in NW Spain. For Ecol Manag 365(1):119–127.https://doi.org/10.1016/j.foreco.2016.01.021
Gominho J, Pereira H (2000) Variability of heartwood content in plantation-grown
Eucalyptus globulusLabill. Wood Fiber Sci 32(2):189–195
Gonçalves JLD, Alvares CA, Higa AR, Silva LD, Alfenas AC, Stahl J, Ferraz SFD, Lima WDP, Brancalion PHS, Hubner A, Bouillet JPD, Laclau JP, Nouvellon Y, Epron D (2013) Integrating genetic and silvicultural strategies to minimize abiotic and biotic constraints in Brazilian eucalypt plantations. For Ecol Manag 301: 6–27.https://doi.org/10.1016/j.foreco.2012.12.030
González-García M, Hevia A, Majada J, Barrio-Anta M (2013) Above-ground biomass estimation at tree and stand level for short rotation plantations of
Eucalyptus nitens(Deane & Maiden) maiden in Northwest Spain. Biomass Bioenergy 54:147–157.https://doi.org/10.1016/j.biombioe.2013.03.019
Grove TS, Thomson BD, Malajczuk N (1996) Nutritional physiology of eucalypts: uptake, distribution and utilization. In: Attiwill PM, Adams MA (eds) Nutrition of eucalypts. CSIRO Publishing, Collingwood, pp 77–108
Guo LB, Sims REH, Horne DJ (2002) Biomass production and nutrient cycling in
Eucalyptusshort rotation energy forests in New Zealand. I: biomass and nutrient accumulation. Bioresource Technol 85:273–283.https://doi.org/10. 1016/S0960-8524(02)00118-9
Haberl H, Beringer T, Bhattacharya SC, Erb KH, Hoogwijk M (2010) The global technical potential of bio-energy in 2050 considering sustainability constraints. Curr Opin Env Sust 2:394–403.https://doi.org/10.1016/j.cosust. 2010.10.007
Hagen-Thorn A, Armolaitis S, Callesen I, Stjernquist I (2004) Macronutrients in tree stems and foliage: a comparative study of six temperate forest species planted at the same sites. Ann For Sci 61(6):489–498.https://doi.org/10.1051/ forest:2004043
Helmisaari H, Kaarakka L (2013) Nutrient management for sustainable production of energy biomass in boreal forests. In: Kellomaki S, Kilpelainen A, Alam A (eds) Forest bioenergy production. Springer, New York, pp 81–94 Hernández J, del Pino A, Salvo L, Arrarte G (2009) Nutrient export and harvest
residue decomposition patterns of aEucalyptus dunniimaiden plantation in temperate climate of Uruguay. For Ecol Manag 258:92–99.https://doi.org/10. 1016/j.foreco.2009.03.050
Hynynen J, Niemistö P, Viherä-Aarnio A, Brunner A, Hein S, Velling P (2009) Silviculture of birch (Betula pendulaRoth andBetula pubescensEhrh.) in northern Europe. Forestry 83(1):103–119.https://doi.org/10.1093/forestry/cpp035
IUSS Working Group WRB (2015) World Reference Base for Soil Resources 2014, update 2015. International soil classification system for naming soils and creating legends for soil maps. World soil resources reports no. FAO, Rome, p 106
Jenkins B, Baxter L, Miles T Jr, Miles T (1998) Combustion properties of biomass. Fuel Process Technol 54(1–3):17–46.https://doi.org/10.1016/S0378-3820(97)00059-3
Judd TS, Attiwill PM, Adams MA (1996) Nutrient concentrations in eucalypts: a synthesis in relation to differences between taxa, sites and components. In: Attiwill PM, Adams MA (eds) Nutrition of eucalypts. CSIRO Publishing, Collingwood, pp 123–153
Jug A, Hofmann-Schielle C, Makeschin F, Rehfuess KE (1999) Short-rotation plantations of balsam poplars, aspen and willows on former arable land in the Federal Republic of Germany. II. Nutritional status and bioelement export by harvested shoot axes. For Ecol Manag 121:67–83.https://doi.org/10.1016/S0378-1127(98)00558-1
Karvonen J, Halder P, Kangas J, Leskinen P (2017) Indicators and tools for assessing sustainability impacts of the forest bioeconomy. Forest Ecosystems 4:2.https://doi.org/10.1186/s40663-017-0089-8
Laclau JP, Bouillet JP, Ranger J (2000) Dynamics of biomass and nutrient accumulation in a clonal plantation ofEucalyptusin Congo. For Ecol Manag 128:181–196.https://doi.org/10.1016/S0378-1127(99)00146-2
Laclau JP, Ranger J, Deleporte P, Nouvellon Y, Saint-André L, Marlet S, Bouillet JP (2005) Nutrient cycling in a clonal stand ofEucalyptusand an adjacent savanna ecosystem in Congo: 3. Input–output budgets and consequences for the sustainability of the plantations. For Ecol Manag 210:375–391. doi:
https://doi.org/10.1016/j.foreco.2005.02.028
Laclau JP, Ranger J, Gonçalves JLM, Maquère V, Krusche AV, M’Bou AT, Nouvellon Y, Saint-André L, Bouillet JP, Piccolo M, Deleporte P (2010) Biogeochemical cycles of nutrients in tropical Eucalyptus plantations. Main features shown by intensive monitoring in Congo and Brazil. For Ecol Manag 259:1771–1785.
https://doi.org/10.1016/j.foreco.2009.06.010
Leite FP, Silva IR, Novais RF, Barros NF, Neves JCL, Villani EMA (2011) Nutrient relations during an eucalyptus cycle at different population densities. Rev Bras Cien Solo 35:949–959.https://doi.org/10.1590/S0100-06832011000300029
López G, Cañas I, Ruíz F (2010) Vegetative propagation techniques and genetic improvement inEucalyptus globulus. In: Gil L, Tadesse W, Tolosana E, López R (eds)
Eucalyptusspecies management, history, status and trends in Ethiopia. Proceedings from the congress held in Addis Abeba. September 15th–17th, p 2010 Madeira M, Araújo C (2015) Soil degradation risks and prevention measures in
planted forests. The case of eucalyptus plantations in Portugal. In: González AA, Bengoetxea NG (eds) Soil degradation risks in planted forests. Servicio Central de Publicaciones del Gobierno Vasco, pp 107–117
Madgwick HAI, Beets P, Gallagher S (1981) Dry matter accumulation, nutrient and energy content of the above ground portion of 4-year-old stands of
Eucalyptus nitensandE. fastigata. New Zeal J For Sci 11(1):53–59
Merino A, Balboa MA, Rodríguez-Soalleiro R, Álvarez-González JG (2005) Nutrient exports under different harvesting regimes in fast-growing forest plantations in southern Europe. For Ecol Manag 207:325–339.https://doi.org/10.1016/j. foreco.2004.10.074
Merino A, López AR, Brañas J, Rodríguez-Soalleiro R (2003) Nutrition and growth in newly established plantations ofEucalyptus globulusin northwestern Spain. Ann For Sci 60:509–517.https://doi.org/10.1051/forest:2003044
Morhart C, Sheppard J, Spiecker H (2013) Above ground leafless woody biomass and nutrient content within different compartments of aP. maximowicii×P. trichocarpapoplar clone. Forests 4:471–487.https://doi.org/10.3390/f4020471
Oliveira N, Rodríguez-Soalleiro R, Pérez-Cruzado C, Cañellas I, Sixto H (2017) On the genetic affinity of individual-tree biomass allometry in poplar short rotation coppice. Bioenerg Res 10(2):525–535. https://doi.org/10.1007/s12155-017-9818-7
Pérez-Cruzado C, Merino A, Rodríguez-Soalleiro R (2011) A management tool for estimating bioenergy production and carbon sequestration inEucalyptus globulusandEucalyptus nitensshort rotation woody crops in North-Western Spain. Biomass Bioenergy 35(7):2839–2851.https://doi.org/10.1016/j. biombioe.2011.03.020
Pérez-Cruzado C, Mohren GMJ, Merino A, Rodríguez-Soalleiro R (2012) Carbon balance for different management practices for fast growing tree species planted on former pastureland in southern Europe: a case study using the CO2Fix model. Eur J For Res 131:1695–1716.https://doi.org/10.1007/s10342-012-0609-6
Pérez-Cruzado C, Rodríguez-Soalleiro R (2011) Improvement in accuracy of aboveground biomass estimation inEucalyptus nitensplantations: effect of bole sampling intensity and explanatory variables. For Ecol Manag 261(11):2016–2028 Pérez-Cruzado C, Sánchez Ron D, Rodríguez-Soalleiro R, Hernández MJ,
Sánchez-Martín MM, Cañellas I, Sixto H (2014) Biomass production assessment from
Populusspp. short rotation irrigated crops in Spain. GCB Bioenergy 6(4):312–326.
https://doi.org/10.1111/gcbb.12061