R E S E A R C H
Open Access
Orthostatic intolerance symptoms are
associated with depression and diminished
quality of life in patients with postural
tachycardia syndrome
Jangsup Moon
1,3, Do-Yong Kim
1, Jung-Ick Byun
1,4, Jun-Sang Sunwoo
1,5, Jung-Ah Lim
1,3, Tae-Joon Kim
1,3,
Jung-Won Shin
6, Woo-Jin Lee
1,3, Han Sang Lee
1,3, Jin-Sun Jun
1,3, Kyung-Il Park
2, Keun-Hwa Jung
1,3,
Soon-Tae Lee
1,3, Ki-Young Jung
1,3, Kon Chu
1,3*and Sang Kun Lee
1,3*Abstract
Background:Patients with postural tachycardia syndrome often appear depressive and report diminished quality of life (QOL). In the current study, we first evaluated if the maximal heart rate (HR) increment after standing is associated with the clinical symptoms in patients with excessive orthostatic tachycardia (OT). Next, we investigated the correlations among the symptoms of orthostatic intolerance (OI), depression, and health-related QOL in these patients. Finally we assessed if patients with minimal OI symptoms suffer from depression or diminished QOL.
Methods:We performed a comprehensive questionnaire-based assessment of symptoms in 107 patients with
excessive OT with a≥30 beats/min heart rate increment (or≥40 beats/min in individuals aged between 12 and 19) within 10 min after standing up. An existing orthostatic intolerance questionnaire (OIQ), the Beck depression inventory-II (BDI-II), and the 36 Item Short-Form Health Survey were completed prior to any treatment. Correlation analyses among the items of the questionnaires and other parameters were performed. Additionally, patients with minimal OI symptoms were analysed separately.
Results:The maximal orthostatic HR increment was not associated with the clinical symptoms. The OI symptoms
were significantly correlated with depression and diminished QOL. The BDI-II score demonstrated a positive linear relationship with total OIQ score (r= 0.516), and both physical and mental component summary scales of SF-36 showed a negative linear relationship with total OIQ score (r= -0.542 andr= -0.440, respectively; allp<0.001). Some OI symptoms were more strongly associated with depression, and others were more strongly related to QOL. Chest discomfort and concentration difficulties were the most influential OI symptoms for depression, while nausea and concentration difficulties were the most influential symptoms for physical and mental QOL, respectively. Dizziness and headache were the two most common complaints in patients with mild to moderate OI symptoms. In addition, subjects with minimal OI symptoms also had considerable deterioration in QOL.
Conclusion:The OI symptoms, but not the maximal HR increment, are significantly correlated with depression and diminished QOL in patients with excessive OT. Therefore, pervasive history taking is important when encountering patients with excessive OT.
Keywords:Orthostatic intolerance, Depression, Quality of life, Correlation, Postural tachycardia syndrome
* Correspondence:stemcell.snu@gmail.com;sangkun2923@gmail.com
1
Department of Neurology, Laboratory for Neurotherapeutics,
Comprehensive Epilepsy Center, Center for Medical Innovations, Biomedical Research Institute, Seoul National University Hospital, Seoul, Republic of Korea
Full list of author information is available at the end of the article
Background
Postural tachycardia syndrome (POTS) is a clinical syndrome usually characterized by an excessive incre-ment of heart rate (HR) upon standing with frequent symptoms of orthostatic intolerance (OI). A diagnosis
of POTS requires a HR increment≥30 beats/min
(bpm) (or≥40 bpm in individuals aged between 12 and 19) within 10 min after standing from a
recum-bent position, in the absence of orthostatic
hypotension [1]. However, some reports have shown that a certain portion of healthy individuals experi-ence a HR increment of≥30 bpm after standing (up to ~30 %), especially in the morning [2]. Therefore, symptoms of OI may be crucial for making a diagno-sis of POTS.
Some studies define POTS as when patients have a > 6-month history of OI symptoms [2–4] while other stud-ies require only a > 3-month history of symptoms [5–7], and some studies even do not have criteria for a minimal disease duration [8–11]. Both 3- and 6-month periods are fairly arbitrary criterion to indicate a chronic condi-tion. Moreover, symptoms of POTS range from well-recognized orthostatic dizziness and palpitation, to less recognized symptoms, such as fatigue, gastrointestinal dysfunction, and increased sweating. [12, 13] These less
recognized non-orthostatic symptoms could be
unnoticeable without clinical suspicion.
The prevalence of POTS is estimated at 0.2 % in the general population [1]; however, the exact preva-lence remains unknown. POTS is still considered to be an under-recognized disorder [12], and its clinical significance is increasing, as it has been reported to be frequently accompanied by depression [11, 14], sleep problems [15], chronic fatigue syndrome [16, 17], and diminished quality of life (QOL) [15, 18]. However, it is not known if depression or deterior-ation of QOL occurs frequently in patients with
min-imal OI symptoms despite excessive orthostatic
tachycardia (OT).
In this study, we hypothesized that each specific symptom of POTS may have a different clinical sig-nificance for the assessment of POTS or comorbid conditions, and patients with minimal OI symptoms might have depression or deteriorated QOL. There-fore, we performed a comprehensive questionnaire-based assessment of OI symptoms, depression and QOL in patients with excessive OT, including those with minimal OI symptoms. First, we evaluated if the maximal HR increment is associated with the severity of symptoms. Second, we analysed the correlations among the symptoms of OI, depression, and the physical and mental components of QOL. Finally, we assessed if patients with minimal OI symptoms suffer from depression or deterioration of QOL.
Methods
Participants
Patient with excessive OT were recruited from either neurology outpatient clinics or the Center for Epi-lepsy and Autonomic Disorders of the Seoul National University Hospital. The main causes of admission were recurrent dizziness, headaches, loss of con-sciousness, convulsive movements, or other paroxys-mal symptoms requiring the exclusion of syncope or seizure disorders for accurate diagnosis. Orthostatic vital sign (OVS) tests were performed twice in every patient except for one patient who had one OVS test and one head-up tilt test. The OVS test was per-formed as described before.[19] The patients were in a supine position for≥10 min before the baseline blood pressure (BP) and HR were measured. After the baseline measurement, patients stood upright without support and remained still right beside the bed. The BP and HR were checked immediately and at 1, 3, 5, and 10 min after standing. Maximal HR increment observed in each patient was calculated from the two OVS tests.
Patients were included when at least one of the tests met the following criteria: (1) HR increment≥30 bpm (or≥40 bpm in patients aged between 12 and 19) within 10 min after standing up; (2) absence of orthostatic hypotension leading to compensatory orthostatic tachy-cardia; and (3) no overt cause for tachycardia, such as acute blood loss, hyperthyroidism, prolonged bed rest, or tachycardia-promoting medications. This study was approved by the Institutional Review Board of Seoul National University Hospital (IRB No. H-1401-091-550) and informed consent was obtained from all individual participants included in the study.
Questionnaire
All subjects performed three sets of self-report ques-tionnaires prior to the treatment. The symptoms of OI were evaluated using a questionnaire (Orthostatic Intolerance Questionnaire, OIQ) which has been widely used to assess the symptoms of POTS patients in previous studies [20–24]. The subjects specified the presence and frequency of nausea, tremor in hands, dizziness, palpitation, headache, profuse perspiration, blurred vision, chest discomfort, lightheadedness, and concentration difficulties. The frequency of specific symptoms was marked with a score ranging from 0 to 4, with 0 for never, 1 for once a month, 2 for 2–4 times per month, 3 for 2–7 times per week, and 4 for more often than once daily. The total symptom score
was calculated by summing the scores of 10
symptoms.
inventory with 21 multiple-choice questions (score of 0 to 3 for each question). A total score of 0–13 indicates minimal depression, 14–19 mild depression, 20–28 moderate depression, and 29–63 severe depression [25].
The 36 Item Short-Form Health Survey (SF-36) was used to assess the health related QOL [26]. The ques-tionnaire contains 36 items that yield 8 category scales: physical functioning, role limitation caused by physical problems, bodily pain, general health, vitality, social functioning, role limitations caused by emotional prob-lems, and mental health. These 8 category scores are aggregated into two summary scales, the physical component summary scale (PCS) and the mental component summary scale (MCS), which are normed to the population (mean = 50, standard deviation = 10). Higher score represents better QOL, and lower score indicates worse QOL.
Statistics
Spearman’s rank correlation coefficient was per-formed to assess the correlation among variables. R-squared (r2) values were calculated to assess the goodness-of-fit for a linear model. To correct the potential confounding variables, partial correlation analysis was performed. To compare the mean among subgroups, a Kruskal-Wallis test was per-formed. The 95 % confidence interval (CI) was
cal-culated from the sample mean and standard
deviation [27]. Logistic regression analysis was per-formed to investigate the most influential OI symp-tom for depression or QOL. Significant depression was defined as BDI≥14, and significant deterioration of physical or mental QOL were defined as PCS < 40 or MCS < 40, respectively. Univariate analysis for basic demographic factors (age, sex, body-mass index
(BMI), maximal HR increment) and OIQ items were per-formed usingT-test. The OIQ variables of p< 0.1 and/or basic demographic factors were included in the multivari-ate analysis. Data were collected and analysed using SPSS 22.0.0 for Windows, and values ofp< 0.05 were considered significant.
Results
The maximal orthostatic heart rate increment is not associated with clinical symptoms
A total of 107 patients (67 females; mean age of 31.1 ± 1.3) were enrolled in this study. The mean BMI of the patients was 22.3 ± 0.3 (Table 1). In total, the mean value of maximal HR increment after standing up was 42.8 ± 1.2. The average of the total OIQ, BDI-II, PCS, and MCS scores were 14.9 ± 0.9, 14.8 ± 0.8, 43.4 ± 0.8, and 39.9 ± 1.1, respectively.
Spearman’s correlation coefficient revealed that the amount of the orthostatic HR increment was not associ-ated with any of the OI symptoms, depression, or QOL. The maximal HR increment did not correlate with either the OIQ, BDI-II, PCS, or MCS scores (all p> 0.05; Table 2).
Orthostatic intolerance symptoms significantly correlate with depression and quality of life
Correlation analyses revealed that total OIQ score displayed a significant correlation with BDI-II, PCS, and MCS scores (all p< 0.001; Fig. 1). The BDI-II score demonstrated a positive linear relationship with total OIQ score, and both the PCS and MCS showed a negative linear relationship with total OIQ score. The strength of the correlation was highest in BDI-II (r= 0.571), followed by the PCS (r= -0.534) and MCS (r= -0.436; Table 2).
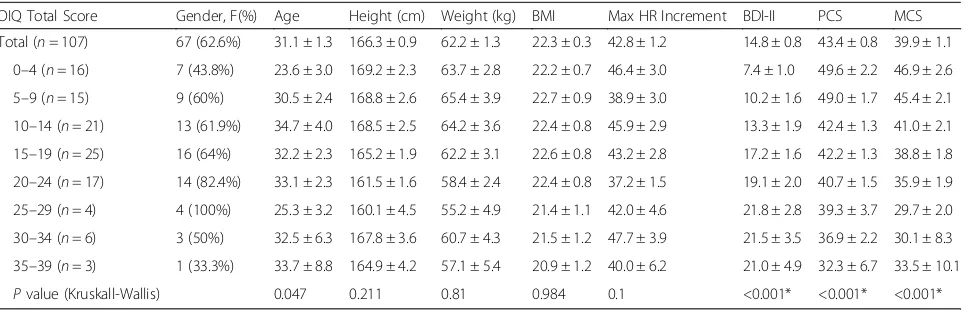
Table 1Clinical characteristics of the patients
OIQ Total Score Gender, F(%) Age Height (cm) Weight (kg) BMI Max HR Increment BDI-II PCS MCS
Total (n= 107) 67 (62.6%) 31.1 ± 1.3 166.3 ± 0.9 62.2 ± 1.3 22.3 ± 0.3 42.8 ± 1.2 14.8 ± 0.8 43.4 ± 0.8 39.9 ± 1.1 0–4 (n= 16) 7 (43.8%) 23.6 ± 3.0 169.2 ± 2.3 63.7 ± 2.8 22.2 ± 0.7 46.4 ± 3.0 7.4 ± 1.0 49.6 ± 2.2 46.9 ± 2.6 5–9 (n= 15) 9 (60%) 30.5 ± 2.4 168.8 ± 2.6 65.4 ± 3.9 22.7 ± 0.9 38.9 ± 3.0 10.2 ± 1.6 49.0 ± 1.7 45.4 ± 2.1 10–14 (n= 21) 13 (61.9%) 34.7 ± 4.0 168.5 ± 2.5 64.2 ± 3.6 22.4 ± 0.8 45.9 ± 2.9 13.3 ± 1.9 42.4 ± 1.3 41.0 ± 2.1 15–19 (n= 25) 16 (64%) 32.2 ± 2.3 165.2 ± 1.9 62.2 ± 3.1 22.6 ± 0.8 43.2 ± 2.8 17.2 ± 1.6 42.2 ± 1.3 38.8 ± 1.8 20–24 (n= 17) 14 (82.4%) 33.1 ± 2.3 161.5 ± 1.6 58.4 ± 2.4 22.4 ± 0.8 37.2 ± 1.5 19.1 ± 2.0 40.7 ± 1.5 35.9 ± 1.9 25–29 (n= 4) 4 (100%) 25.3 ± 3.2 160.1 ± 4.5 55.2 ± 4.9 21.4 ± 1.1 42.0 ± 4.6 21.8 ± 2.8 39.3 ± 3.7 29.7 ± 2.0 30–34 (n= 6) 3 (50%) 32.5 ± 6.3 167.8 ± 3.6 60.7 ± 4.3 21.5 ± 1.2 47.7 ± 3.9 21.5 ± 3.5 36.9 ± 2.2 30.1 ± 8.3 35–39 (n= 3) 1 (33.3%) 33.7 ± 8.8 164.9 ± 4.2 57.1 ± 5.4 20.9 ± 1.2 40.0 ± 6.2 21.0 ± 4.9 32.3 ± 6.7 33.5 ± 10.1
Pvalue (Kruskall-Wallis) 0.047 0.211 0.81 0.984 0.1 <0.001* <0.001* <0.001*
The values are the mean ± SEM. The Kruskal-Wallis test was performed to compare the mean among the subgroups
Abbreviations:OIQorthostatic intolerance questionnaire,Ffemale,BMIbody-mass index,HRheart rate,BDI-IIBeck depression inventory-II,PCSphysical component summary scale of Short Form 36,MCSmental component summary scale of Short Form 36
On partial correlation analysis, the BDI-II score displayed a positive linear correlation (r= 0.208,p= 0.029) with total OIQ score while controlling for PCS and MCS. PCS (r= -0.432,p< 0.01) and MCS (r= -0.198,p= 0.036) demonstrated inverse linear correlations with total OIQ score while controlling for BDI-II.
When the patients were divided into 8 subgroups according to the OIQ scores, each group showed signifi-cantly different results on the BDI-II and SF-36 (p< 0.001; Table 1). There was a clear tendency that patients with a higher OIQ score had a greater BDI-II score and lower PCS and MCS scores (Fig. 2).
In summary, when the patients experienced more OI symptoms, they were more depressed and felt greater deterioration in their QOL.
Particular symptoms may be more useful in screening patients with POTS
All contents of the OIQ were correlated with depression (BDI-II) and the physical (PCS) and mental components (MCS) of QOL, with the exception of a few items (Table 2). Tremor in hands did not correlate with PCS or MCS, and profuse perspiration did not correlate with MCS. Most of the 10 OI symptoms were significantly correlated with other symptoms except for a few combi-nations (Additional file 1: Table S1).
Assuming that the cases with a Spearman’s correlation coefficientr>0.4 indicate a stronger correlation, particu-lar OI symptoms had a stronger association with BDI-II, PCS, and MCS scores (Table 2). Concentration difficul-ties, chest discomfort, palpitation, lightheadedness, and nausea were the symptoms most strongly associated with depression (in descending order). Lightheadedness, dizziness, headache, and concentration difficulties (in descending order) were strongly related to physical QOL, while concentration difficulties were strongly asso-ciated with mental QOL. On multivariate analysis (Table 3), patients with OIQ score≥20 had significantly higher risk of having depression (odds ratio (OR) 14.300), diminished physical (OR 13.144) and mental QOL (OR 10.392) when compared to the patients with OIQ score <10. Among the OI symptoms, chest discom-fort (OR 1.717) and concentration difficulties (OR 1.470) were the most influential symptoms for depression. Nau-sea (OR 2.501) and concentration difficulties (OR 1.756) were the most influential symptoms for physical and mental QOL, respectively (Table 3).
When the patients were categorized into 8 subgroups according to the OIQ scores, certain symptoms appeared more frequently in patients with low total OIQ scores (Table 4, Fig. 3). Dizziness followed by headache were the two most common complaints in patients with an OIQ score <20. As the OIQ score increased, patients Table 2Correlations among the questionnaire parameters
(n= 107) OIQ Total BDI-II PCS MCS
OIQ Total Score .571** −.534** −.436**
1. Nausea .401** −.379** −.209*
2. Tremor in hands .325** −.157 −.176
3. Dizziness .272** −.462** −.307**
4. Palpitation .426** −.390** −.283**
5. Headache .224* −.434** −.262**
6. Profuse perspiration .272** −.213* −.096
7. Blurred vision .339** −.249** −.248*
8. Chest discomfort .518** −.348** −.399**
9. Lightheadedness .413** −.511** −.335**
10. Concentration difficulties .532** −.404** −.466**
Max HR increase −.081 −.032 .123 .083
Spearman’s correlation coefficient was performed for all patients (n= 107). The values represent the Spearman’s rho correlation coefficient
Abbreviations:OIQorthostatic intolerance questionnaire,BDI-IIBeck depression inventory-II,PCSphysical component summary scale of Short Form 36,MCS
mental component summary scale of Short Form 36 **p< 0.01, *p< 0.05, Bold: stronger correlation
tended to complain more about lightheadedness, con-centration difficulties and palpitation. In total, dizziness and headache were the most frequent symptoms, and profuse perspiration was the least reported patient complaint.
Subjects with minimal orthostatic intolerance symptoms despite excessive orthostatic tachycardia may suffer from decreased quality of life
For the cut-off value distinguishing minimal and consid-erable OI symptoms, we chose a total OIQ score of 10. We regarded patients with OIQ score less than 10 as patients with minimal OI symptoms. In these subpopu-lations of patients with low OIQ scores between 0–4 and 5–9, MCS scores were substantially lower (46.9 ± 2.6 and 45.4 ± 2.1, respectively) than normal population, especially in patients with the OIQ score between 5–9 (MCS score 95 % CI: 41.0–49.8). However, PCS scores
were close to the mean value of the healthy population (49.6 ± 2.2 and 49.0 ± 1.7, respectively) and BDI-II scores (7.4 ± 1.0 and 10.2 ± 1.6, respectively) were indicative of minimal depression (Table 1).
Discussion
To our knowledge, this study is the first to evaluate as-sociations between specific OI symptoms and depression or QOL in patients with POTS. The severity of each OI symptom was significantly associated with depression and QOL. The total OIQ score revealed a positive linear relationship with the BDI-II score and an inverse linear correlation with both PCS and MCS of the SF-36 scale. Meanwhile, the maximum HR increment after standing up was not associated with any of the OI symptoms, depression, or QOL. Certain OI symptoms were more strongly correlated with depression, and some were more strongly related to a diminished QOL. Dizziness and headache were the main complaints of patients with mild OI symptoms, and lightheadedness, concentration difficulties, and palpitation were more frequently ob-served in patients with moderate to severe OI symp-toms. Patients with minimal OI symptoms also displayed deterioration of QOL.
Contrary to our expectation, the degree of ortho-static HR increment was not directly related to clin-ical symptoms, although excessive OT is the main clinical feature of POTS. This may have resulted from the fact that the time of the day when the OVS tests were performed varied among patients in our study. Diurnal variability of HR is considered a normal physiologic phenomenon [28, 29], and more-over it has been reported that OT is exaggerated in the morning, both in healthy control and in POTS patients [2, 19]. As the timing of the OVS test was not controlled, the orthostatic HR increment could
have failed to reflect the severity of POTS.
Table 3Multivariate analysis for a significant functional deterioration
(n= 107) Depression Diminished physical QOL Diminished mental QOL
OR 95 % CI Pvalue OR 95 % CI Pvalue OR 95 % CI Pvalue
Total OIQ scorea
OIQ scores 0–9 Reference Reference Reference
OIQ scores 10–19 6.190 2.021–18.958 0.001* 3.103 0.748–12.883 0.119 4.686 1.583–13.882 0.005*
OIQ scores≥20 14.300 4.083–50.078 <0.001* 13.144 3.037–56.891 0.001* 10.392 3.071–35.163 <0.001*
OIQ score itemsb
Nausea 2.501 1.631–3.834 <0.001*
Chest discomfort 1.717 1.130–2.610 0.011*
Concentration difficulties 1.470 1.027–2.104 0.035* 1.756 1.290–2.389 <0.001*
Abbreviations:OIQorthostatic intolerance questionnaire,QOLquality of life a
Ordinal regression analysis was performed. Basic demographics (age, sex, body mass index, maximal HR increment) and total OIQ scores were analyzed b
Logistic regression analysis was performed. Basic demographics (age, sex, body mass index, maximal HR increment) and OIQ items withP< 0.1 were analyzed using the backward Wald elimination method (cutoffP≥0.05). The final OIQ items remained in the models are displayed
*p< 0.05
Alternatively, it is possible that the amount of the HR increment is truly not related to the severity of clinical symptoms. In any case, our finding implies that the severity of POTS should not be judged based on the amount of the HR increment after standing up.
Meanwhile, the severity of OI symptom was signifi-cantly correlated with depression and the QOL. As the OI symptoms increase, patients tend to be more depressed and feel deterioration in their QOL. The
association between depression and decreased QOL is already well known in many diseases [30–32]. To ex-clude the possibility that depression and diminished QOL are the confounding variables, we performed a partial correlation analysis. The BDI-II score was sig-nificantly correlated with the OIQ score after correct-ing PCS and MCS, and likewise, PCS and MCS were also fairly related to the OIQ score after correcting for the BDI-II score. Moreover, on the multivariate analysis, patients with total OIQ score≥20 had
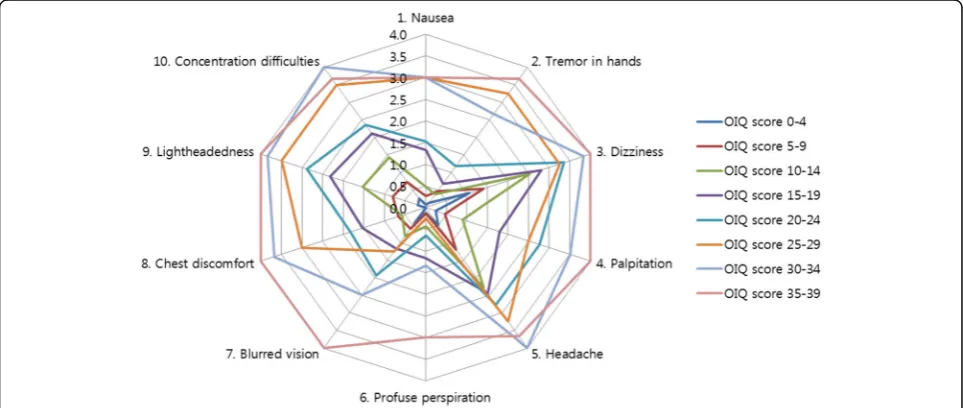
Fig. 3Symptoms self-reported by patients subcategorized according to total OIQ score. All patients were subcategorized according to total OIQ scores at intervals of 5 points. Each point of the decagonal scale represents the mean score of each symptom in the designated subgroup. For example, in the subgroup of patients with total OIQ score between 15 and 19 (purple line), the mean score of Nausea, Tremor in hands, Dizziness, and Palpitation was 1.3, 0.7, 2.8, and 1.8, respectively. Dizziness and headache were the two most common symptoms complained of by patients with an OIQ score < 20. As the OIQ score increased, patients tended to complain more about lightheadedness, concentration difficulties and palpitation. Profuse perspiration was the least reported patient complaint
Table 4Mean score of the OIQ items in each subgroup
(n= 107) OIQ score
0–4 (n= 16)
5–9 (n= 15)
10–14 (n= 21)
15–19 (n= 25)
20–24 (n= 17)
25–29 (n= 4)
30–34 (n= 6)
35–39 (n- = 3)
Total
1. Nausea 0.1 ± 0.1 0.3 ± 0.2 0.5 ± 0.2 1.3 ± 0.3 1.5 ± 0.3 3.0 ± 0.7 3.0 ± 0.5 3.0 ± 0.6 1.1 ± 0.1
2. Tremor in hands 0.1 ± 0.1 0.5 ± 0.3 0.4 ± 0.2 0.7 ± 0.2 1.2 ± 0.2 3.3 ± 0.3 2.7 ± 0.3 3.7 ± 0.3 0.9 ± 0.1
3. Dizziness 1.1 ± 0.3 1.4 ± 0.2 2.5 ± 0.3 2.8 ± 0.2 3.4 ± 0.2 3.3 ± 0.5 3.8 ± 0.2 4.0 ± 0.0 2.5 ± 0.1
4. Palpitation 0.3 ± 0.1 0.5 ± 0.2 0.9 ± 0.2 1.8 ± 0.2 2.8 ± 0.3 2.5 ± 0.7 3.5 ± 0.2 4.0 ± 0.0 1.5 ± 0.1
5. Headache 0.5 ± 0.2 1.2 ± 0.3 2.3 ± 0.3 2.4 ± 0.2 2.8 ± 0.2 3.3 ± 0.5 4.0 ± 0.0 3.7 ± 0.3 2.2 ± 0.1
6. Profuse perspiration 0.1 ± 0.1 0.1 ± 0.1 0.4 ± 0.2 1.2 ± 0.2 0.6 ± 0.2 0.3 ± 0.3 1.3 ± 0.5 3.0 ± 0.6 0.7 ± 0.1
7. Blurred vision 0.4 ± 0.2 0.6 ± 0.2 0.8 ± 0.2 1.2 ± 0.2 1.9 ± 0.3 1.3 ± 0.8 2.5 ± 0.6 4.0 ± 0.0 1.2 ± 0.1
8. Chest discomfort 0.0 ± 0.0 0.7 ± 0.2 0.6 ± 0.2 1.5 ± 0.2 1.8 ± 0.3 3.0 ± 0.4 3.7 ± 0.2 4.0 ± 0.0 1.3 ± 0.1
9. Lightheadedness 0.2 ± 0.1 0.8 ± 0.2 1.5 ± 0.3 2.3 ± 0.2 2.9 ± 0.2 3.5 ± 0.3 3.8 ± 0.2 4.0 ± 0.0 1.9 ± 0.1
10. Concentration difficulties 0.3 ± 0.1 0.7 ± 0.2 1.4 ± 0.3 2.1 ± 0.2 2.4 ± 0.2 3.5 ± 0.3 4.0 ± 0.0 3.7 ± 0.3 1.7 ± 0.1
OIQ total 3.0 ± 0.3 6.7 ± 0.4 11.3 ± 0.3 17.3 ± 0.3 21.2 ± 0.3 26.8 ± 1.0 32.3 ± 0.8 37.0 ± 1.0 14.9 ± 0.9
The values are demonstrated as the mean ± SEM
significantly higher risk of having depression and diminished physical and mental QOL (all OR > 10) than those with low OIQ scores. POTS patients are known to be mildly depressed, and their QOL is dete-riorated [3, 15, 18]; however, here, we demonstrated that this deterioration is directly related to the OI symptoms. Although we cannot verify the causal rela-tionship of OI symptoms and the psycho-behavioural symptoms, it is important to keep in mind that these symptoms are associated with each other. It is re-markable that patients with an OIQ score≥10 dem-onstrated a mean BDI-II score over 13 and mean PCS and MCS scores below 42, which represent the presence of depression and significant impairment of QOL. We strongly recommend that in patients with excessive OT and an OIQ score≥10, the clinician should evaluate the presence of coexisting depression or decline in QOL, which should be reassessed during the management of POTS patients. Antidepressants can be prescribed in severely depressed POTS patients and treatment of POTS may be continued in patients with sustained deterioration of QOL. We were not able to evaluate whether other comorbid conditions of POTS, such as sleep disturbance [15] or chronic fatigue syndrome [16], could be potential confounding factors; therefore, additional studies of this subject are required in the future.
We identified that some specific symptoms of OI are strongly correlated with depression and diminished QOL in POTS patients. Concentration difficulties, chest discomfort, palpitation, lightheadedness, and nausea showed the strongest correlations (in descending order) with depression while lightheadedness, dizziness, head-ache, and concentration difficulties had the strongest inverse correlations (in descending order) with the phys-ical component of QOL. Concentration difficulties also displayed the strongest inverse correlation with the men-tal component of QOL. According to the multivariate analysis, chest discomfort and concentration difficulties were the most influential OI symptoms for depression, while nausea and concentration difficulties were the most influential symptoms for diminished physical and mental QOL, respectively. Benrud-Larson et al. previ-ously demonstrated that autonomic symptoms are asso-ciated with QOL in POTS patients [18]. The orthostatic intolerance subscale showed the strongest correlation with PCS (r= -0.45, p< 0.05, Spearman’s correlation coefficient) but not with MCS of the SF-36 scale, and other subscales of autonomic symptoms displayed weaker correlations with QOL. The study used the Autonomic Symptom Profile [33] to evaluate the severity of autonomic symptoms. However, this measure consists of 169 questions, which require a substantial amount of time to complete the questions and to interpret the
results. Therefore, in the current study, we focused on specific OI symptoms that can be easily asked to the patients in the clinic and thus have identified specific symptoms that are strongly associated with the PCS and MCS, as well as the BDI-II.
We discovered a pattern of frequently reported OI symptoms according to the total OIQ scores. Dizziness and headache were the most common symptoms com-plained of by patients with mild OI symptoms. Light-headedness, concentration difficulties, and palpitations tended to increase in patients suffering from moderate to severe OI symptoms. We also discovered that profuse perspiration and blurred vision were not frequently pre-sented in POTS patients with mild to moderate OI symptoms. Our data are additionally meaningful because we evaluated the baseline symptoms of OI, depression and QOL before the treatment was initiated. Most of the previous studies on depression and QOL in POTS patients assessed the patients after the treatment was begun [15, 18]. Therefore, we believe our data reflect the natural characteristics of POTS better than other previ-ous studies. We estimate that the data on specific symp-toms mentioned above will be highly useful in clinical practice dealing with POTS patients.
It is notable that, among the patients with exces-sive OT, even patients with minimal OI symptoms experienced deterioration in mental components of QOL. Although POTS patients often have a lower QOL [15, 18], it is not yet known whether the diminished QOL was the result of excessive OT or whether excessive OT occurs more frequently in pa-tients with diminished QOL. Whether QOL improves after treatment of OT (e.g., beta-blockers) should be investigated in the near future to determine the causal relationship between the two conditions. At this point, we recommend assessing QOL and mood symptoms in patients who display excessive OT with-out significant OI symptoms, as they could be the underestimated symptoms of POTS.
Conclusions
Additional file
Additional file 1: Table S1.Correlations among the questionnaire parameters (full details).Table S2.Univariate analysis for a significant functional deterioration. (DOCX 34 kb)
Abbreviations
BDI-II:Beck depression inventory-II; bpm: Beats/minute; CI: Confidence interval; HR: Heart rate; MCS: Mental component summary scale; OI: Orthostatic intolerance; OIQ: Orthostatic Intolerance Questionnaire; OT: Orthostatic tachycardia; OVS: Orthostatic vital sign; PCS: Physical component summary scale; POTS: Postural tachycardia syndrome; QOL: Quality of life; SF-36: 36 Item Short-Form Health Survey
Funding
This study was supported by the Korean Health Technology R&D Project of the Ministry of Health & Welfare, Republic of Korea (HI13C1558) and the National Research Foundation of Korea (NRF) funded by the Ministry of Science, ICT & Future Planning (NRF-2016R1C1B2016275). Jangsup Moon was supported by SK Young Investigator Award by SK chemicals, Korean Neurological Association.
Availability of data and materials section
The datasets during and/or analysed during the current study available from the corresponding author on reasonable request.
Authors’contributions
JM designed the study, interpreted data and drafted the manuscript. DYK, WJL, HSL, and JSJ conducted data collection. JIB, JSS, and JWS conducted the data analysis and statistical interpretation. JAL and TJK helped to draft the manuscript. KIP, KHJ, STL, and KYJ contributed in the revision and finalization of the manuscript. KC and SKL designed the study, supervised data collection, and reviewed the manuscript. All authors read and appoved the final manuscript.
Competing interests
The authors declare that they have no competing interests.
Consent for publication
Not applicable.
Ethics approval and consent to participate
This study was approved by the Institutional Review Board of Seoul National University Hospital (IRB No. H-1401-091-550) and informed consent was obtained from all individual participants included in the study.
Author details 1
Department of Neurology, Laboratory for Neurotherapeutics,
Comprehensive Epilepsy Center, Center for Medical Innovations, Biomedical Research Institute, Seoul National University Hospital, Seoul, Republic of Korea.2Department of Neurology, Seoul National University Hospital Healthcare System Gangnam Center, Seoul, Republic of Korea.3Program in Neuroscience, Seoul National University College of Medicine, Seoul, Republic of Korea.4Department of Neurology, Kyung Hee University Hospital at Gangdong, Seoul, Republic of Korea.5Department of Neurology, Soonchunhyang University Seoul Hospital, Seoul, Republic of Korea. 6Department of Neurology, CHA Bundang Medical Center, CHA University,
Seoungnam, Republic of Korea.
Received: 7 January 2016 Accepted: 30 September 2016
References
1. Sheldon RS, Grubb 2nd B, Olshansky B, Shen W-K, Calkins H, Brignole M, Raj SR, Krahn AD, Morillo CA, Stewart JM. Heart rhythm society expert consensus statement on the diagnosis and treatment of postural tachycardia syndrome, inappropriate sinus tachycardia, and vasovagal syncope. Heart Rhythm. 2015;12(6):e41–63.
2. Brewster JA, Garland EM, Biaggioni I, Black BK, Ling JF, Shibao CA, Robertson D, Raj SR. Diurnal variability in orthostatic tachycardia: implications for the postural tachycardia syndrome. Clin Sci (Lond). 2012;122:25–31. 3. Raj V, Haman KL, Raj SR, Byrne D, Blakely RD, Biaggioni I, Robertson D,
Shelton RC. Psychiatric profile and attention deficits in postural tachycardia syndrome. J Neurol Neurosurg Psychiatry. 2009;80:339–44.
4. Raj SR, Black BK, Biaggioni I, Harris PA, Robertson D. Acetylcholinesterase inhibition improves tachycardia in postural tachycardia syndrome. Circulation. 2005;111:2734–40.
5. Kimpinski K, Figueroa JJ, Singer W, Sletten DM, Iodice V, Sandroni P, Fischer PR, Opfer-Gehrking TL, Gehrking JA, Low PA. A Prospective, 1-Year Follow-up Study of Postural Tachycardia Syndrome. Mayo Clin Proc. 2012;87:746–52. 6. Thieben MJ, Sandroni P, Sletten DM, Benrud-Larson LM, Fealey RD, Vernino
S, Low PA, Lennon VA, Shen W-K. Postural orthostatic tachycardia syndrome: the Mayo clinic experience. Mayo Clin Proc. 2007;82:308–13. 7. Grubb BP. Postural tachycardia syndrome. Circulation. 2008;117:2814–7. 8. Freeman R, Wieling W, Axelrod FB, Benditt DG, Benarroch E, Biaggioni I,
Cheshire WP, Chelimsky T, Cortelli P, Gibbons CH. Consensus statement on the definition of orthostatic hypotension, neurally mediated syncope and the postural tachycardia syndrome. Clin Auton Res. 2011;21:69–72. 9. Sousa A, Lebreiro A, Freitas J, Maciel MJ. Long-term follow-up of patients
with postural tachycardia syndrome. Clin Auton Res. 2012;22:151–3. 10. Fu Q, VanGundy TB, Shibata S, Auchus RJ, Williams GH, Levine BD. Exercise
training versus propranolol in the treatment of the postural orthostatic tachycardia syndrome. Hypertension. 2011;58:167–75.
11. Lkhagvasuren B, Oka T, Kawai K, Takii M, Kanemitsu Y, Tokunaga S, Kubo C. Prevalence of postural orthostatic tachycardia syndrome in patients with psychiatric disorders. Psychother Psychosom. 2011;80:308–9.
12. Pandian J, Dalton K, Henderson R, McCombe P. Postural orthostatic tachycardia syndrome: an underrecognized disorder. Intern Med J. 2007;37:529–35. 13. Baker J, Kimpinski K. A prospective 1-year study of postural tachycardia and
the relationship to non-postural versus orthostatic symptoms. Physiol Behav. 2015;147:227–32.
14. Benarroch EE. Postural tachycardia syndrome: a heterogeneous and multifactorial disorder. Mayo Clin Proc. 2012;87:1214–25.
15. Bagai K, Song Y, Ling J, Malow B, Black B, Biaggioni I, Robertson D, Raj S. Sleep disturbances and diminished quality of life in postural tachycardia syndrome. J Clin Sleep Med. 2011;7:204.
16. Reynolds G, Lewis D, Richardson A, Lidbury B. Comorbidity of postural orthostatic tachycardia syndrome (POTS) and chronic fatigue syndrome (CFS) in an Australian cohort. J Intern Med. 2014;275(4):409–17. 17. Hoad A, Spickett G, Elliott J, Newton J. Postural orthostatic tachycardia
syndrome is an under-recognized condition in chronic fatigue syndrome. QJM. 2008;101:961–5.
18. Benrud-Larson LM, Dewar MS, Sandroni P, Rummans TA, Haythornthwaite JA, Low PA. Quality of life in patients with postural tachycardia syndrome. Mayo Clin Proc. 2002;77:531–7.
19. Moon J, Lee HS, Byun J-I, Sunwoo J-S, Shin J-W, Lim J-A, Kim T-J, Shin Y-W, Lee K-J, Jeon D. The complexity of diagnosing postural orthostatic tachycardia syndrome: influence of the diurnal variability. J Am Soc Hypertens. 2016;10:263–70.
20. Winker R, Barth A, Dorner W, Mayr O, Pilger A, Ivancsits S, Ponocny I, Heider A, Wolf C, Rüdiger H. Diagnostic management of orthostatic intolerance in the workplace. Int Arch Occup Environ Health. 2003;76:143–50.
21. Winker R, Barth A, Bidmon D, Ponocny I, Weber M, Mayr O, Robertson D, Diedrich A, Maier R, Pilger A, et al. Endurance exercise training in orthostatic intolerance : A randomized, controlled trial. Hypertension. 2005;45:391–8.
22. Yang JY, Zhao J, Du SX, Liu D, Fu CH, Li XY, Chen S, Tang CS, Du JB, Jin HF. Postural orthostatic tachycardia syndrome with increased erythrocytic hydrogen sulfide and response to midodrine hydrochloride. J Pediatr. 2013; 163:1169–73.e2.
23. Zhang QY, Liao Y, Tang CS, Du JB, Jin HF. Twenty-four-hour urinary sodium excretion and postural orthostatic tachycardia syndrome. J Pediatr. 2012;161: 281–4.
24. Zhang F, Li X, Ochs T, Chen L, Liao Y, Tang C, Jin H, Du J. Midregional pro-adrenomedullin as a predictor for therapeutic response to midodrine hydrochloride in children with postural orthostatic tachycardia syndrome. J Am Coll Cardiol. 2012;60:315–20. 25. Beck AT, Steer RA, Ball R, Ranieri WF. Comparison of Beck Depression
26. Jenkinson C, Coulter A, Wright L. Short form 36 (SF36) health survey questionnaire: normative data for adults of working age. BMJ. 1993;306: 1437–40.
27. Soper, D.S. Confidence Interval Calculator for the Population Mean [Software]. 2016. Available from: http://www.danielsoper.com/statcalc. 28. Rubenstein JC, Freher M, Kadish A, Goldberger JJ. Diurnal heart rate patterns
in inappropriate sinus tachycardia. Pacing Clin Electrophysiol. 2010;33:911–9. 29. Richards A, Nicholls M, Espiner E, Ikram H, Cullens M, Hinton D. Diurnal
patterns of blood pressure, heart rate and vasoactive hormones in normal man. Clin Exp Hypertens A Theory Pract. 1986;8:153.
30. Boylan L, Flint L, Labovitz D, Jackson S, Starner K, Devinsky O. Depression but not seizure frequency predicts quality of life in treatment-resistant epilepsy. Neurology. 2004;62:258–61.
31. Amato M, Ponziani G, Rossi F, Liedl C, Stefanile C, Rossi L. Quality of life in multiple sclerosis: the impact of depression, fatigue and disability. Mult Scler. 2001;7:340–4.
32. Goldney RD, Phillips PJ, Fisher LJ, Wilson DH. Diabetes, depression, and quality of life a population study. Diabetes Care. 2004;27:1066–70. 33. Suarez G, Opfer-Gehrking T, Offord K, Atkinson E, O’brien P, Low P.
The autonomic symptom profile a new instrument to assess autonomic symptoms. Neurology. 1999;52:523.
• We accept pre-submission inquiries
• Our selector tool helps you to find the most relevant journal • We provide round the clock customer support
• Convenient online submission • Thorough peer review
• Inclusion in PubMed and all major indexing services • Maximum visibility for your research
Submit your manuscript at www.biomedcentral.com/submit