S H O R T R E P O R T
Open Access
Validation of the Pittsburgh sleep quality
index in community dwelling Ethiopian
adults
Mohammed Salahuddin
1, Tarekegn Tesfaye Maru
1, Abera Kumalo
2, Seithikurippu R. Pandi-Perumal
3,
Ahmed S. Bahammam
4,5and Md Dilshad Manzar
2*Abstract
Background:The applicability of the Pittsburgh Sleep Quality Index (PSQI) in screening of insomnia is demonstrated in various populations. But, the tool has not been validated in a sample of Ethiopians. Therefore, this study aimed to assess its psychometric properties in community dwelling Ethiopian adults.
Material and methods:Participants (n= 311, age = 25.5 ± 6.0 years and body mass index = 22.1 ± 2.3 kg/m2) from Mizan-Aman town, Southwest Ethiopia completed the PSQI and a semi-structured questionnaire for socio-demographics. Clinical interview for screening of insomnia according to the International Classification of Sleep Disorders was carried out as a concurrent validation measure.
Results:Overall, the PSQI scale did not have floor effect and ceiling effects. Moderate internal consistency (Cronbach’s alpha was 0.59) and sufficient internal homogeneity as indicated by correlation coefficient between component scores and the global PSQI score was found. The PSQI was of good value for screening insomnia with optimal cut-off scores of 5.5 (sensitivity 82%, specificity 56.2%) and the area under the curve, 0.78 (p< 0.0001). The PSQI has unidimensional factor structure in the Ethiopian community adults for screening insomnia.
Conclusion:The PSQI has good psychometric validity in screening for insomnia among Ethiopians adults.
Keywords:PSQI, Catha edulis, Ethiopia, Insomnia, Pittsburgh sleep quality index, Sleep, Substance abuse
Introduction
Sleep disorders are becoming endemic in both developed and developing societies [1–4]. More than half of the population across the globe is affected by some type of sleep disturbances and about one fifth of adults have chronic sleep disorder [1–5]. Sleep problems are impli-cated in poor health conditions characterized by impaired social relationships, neurologic, and/or psychiatric condi-tions, drowsy driving, risk-taking behavior, occupational accidents, and heightened risk of cardiovascular events [3–5]. Majority of the Ethiopian university students are sleep disturbed, which adversely affected their psycho-logical health [2, 3].
Insomnia and its subjective symptoms e.g. difficulty initiating sleep, short sleep duration and poor sleep quality are the main dimensions of poor sleep in Ethiopia [2, 3]. Ethiopia is a developing country of Africa with limited trained sleep health professionals. There is no indigen-ously developed questionnaire tool for the assessment of sleep quality. Additionally, no work has been done to val-idate known tools that assess sleep quality in Ethiopians. In such circumstances, the availability of a validated ques-tionnaire tool to assess sleep health is necessary. There are more than 80 different languages in the country with ma-jority of the Ethiopians having low to high level of profi-ciency of spoken Amharic, which is the national language. However, the reading proficiency is more variable because of differences in script for major groups of languages.
The Pittsburgh Sleep Quality Index (PSQI) is the most widely used instrument in diagnosis of sleep disorders including insomnia in different populations [5–9]. The * Correspondence:md.dilshadmanzar@gmail.com
2Department of Biomedical Sciences, College of Health Sciences, Mizan-Tepi University (Mizan Campus), Mizan Aman, Ethiopia
Full list of author information is available at the end of the article
questionnaire has twenty-four items of which nineteen self-reported items are added non-linearly to generate seven components. The scores of these components are pooled linearly to get the global PSQI score, which is a measure of sleep health for the period of the 1 month immediately preceding the time of administration. The tool is easy to understand, patient compliant and re-quires about 5 min to be completed. The validity of the PSQI is well established in various clinical and non-clinical populations, people of different regions and eth-nicities [5, 6, 10]. However, few studies have investigated the psychometric properties of the PSQI in African population. It has never been validated in Ethiopian pop-ulations [5, 7]. The present study therefore sought to validate the PSQI in a sample of community dwelling Ethiopian adults.
Material and methods
Households were selected by simple random sampling (SRS) method across Mizan-Aman town, Bench Maji Zone, Southwest, Ethiopia. Further, only one adult mem-ber (chosen randomly) from every selected house was interviewed. Three hundred and eleven out of an initial 550 adults who were screened and who had been found qualified were administered the survey and fully com-pleted it. Ethiopia is known for cultivation of Chat-a psycho-stimulant and coffee. The consumption of chat and/or coffee is highly prevalent in the Ethiopian com-munity. Chat has been reported to be associated with poor sleep [2, 3]. The previous African study reporting validation of the PSQI on college students in Nigeria did not report about Chat habits [7]. Moreover, the study only involved college students [7], whereas our study assessed the validity of the PSQI in the community dwelling adults. The mean age and body mass index (BMI) of the participants were 25.5 ± 6.0 years and 22.1 ± 2.3 kg/m2, respectively. Exclusion criteria consisted of self-reported problems with memory. A detailed explan-ation regarding the purpose and procedures of the study was given to the volunteers. Even though, Amharic is the most widely spoken language but its reading profi-ciency level is limited. Therefore, instructor adminis-tered original English version of the PSQI was employed. Semi-structured tool for demographics and the PSQI were employed. All the participants were interviewed by an experienced sleep researcher blinded to the PSQI score for the presence of insomnia according to the International Classification of Sleep Disorders, revised criteria (ICSD-R). These criteria included: (i) Almost nightly insufficient amount of sleep, (ii) Not feeling rested after usual sleep and (iii) Mild to severe impair-ment of social or occupational functioning, (iv) Com-plaint of restlessness, irritability, anxiety, daytime fatigue, and tiredness. The subjects were screened as
insomniacs if they had either (i or ii) of the condition and at least mild complaints related to both (iii) and (iv) [7]. The PSQI measures sleep quality for the month period just preceding the interview. But, it has been found to be a valid and reliable measure of insomnia in some populations [5, 7–9].
Statistical analysis
The statistical package SPSS version 16.0 (SPSS Inc., Chicago, USA) was used. The PSQI is composed of nineteen self-reported items. The scores of these individ-ual items are added non-linearly to get seven component scores. These components are measured variables and should not be confused with component/factor term (a latent variable) used in factor analysis [6, 11]. The Cron-bach alpha test was used to assess internal consistency. Internal homogeneity was tested by correlation analysis between PSQI components and the global scores. Dis-criminative validity was assessed by test of difference; Mann Whitney for the structured categorical variables (the PSQI components) and t-test for the global PSQI score. The diagnostic validation was performed by re-ceiver operating curve (ROC) analysis. The screening by the sleep expert based on clinical interview served as the gold standard and the global PSQI score was the test variable. Sensitivity, specificity, area under the curve (AUC), and cut off score were assessed. Exploratory fac-tor analysis (EFA) was performed using principal com-ponent analysis for initial estimate. This was followed by maximum likelihood estimation with direct oblimin ro-tation. EFA investigated two types of the PSQI i.e. one with all seven components and other with five compo-nents (sans the PSQI compocompo-nents of medicine use and daytime dysfunction). Confirmatory factor analysis (CFA) was performed using maximum likelihood. A value of up to 0.05 indicated good fit for both root mean square re-sidual (RMR) as well as root mean square error of ap-proximation (RMSEA). A value of more than/equal to 0.90 indicated good fit for both goodness of fit index (GFI) as well as adjusted goodness of fit index (AGFI) [12]. Lesser value of expected cross-validation index (ECVI) in-dicates better fit- employed as a relative measure of fit. A comparative fit index (CFI) of no less than 0.95, andχ2/df ratio of less than 3 indicated an acceptable fit between a model and the data [13].
Results
Ceiling or floor effects were considered to be present if more than 15% of respondents achieved the highest or lowest score, respectively [14, 15]. Overall, the global PSQI score did not have floor and ceiling effects; 5.1% of Ethiopian adults reported a minimum score of zero, and none reported a maximum score of 21, respectively. However, individual components of the tool did show floor and ceiling effects. All the PSQI components except for sleep latency showed floor effect i.e. more than 15% of respondents achieved the lowest score [14, 15]. Neverthe-less, ceiling effect was observed only for components of sleep duration and sleep efficiency i.e. more than 15% of respondents achieved the highest score [14, 15].
The internal consistency test of the PSQI scores showed a Cronbach’s alpha of 0.59, a value suggesting moderate consistency. Cronbach’s alpha increased by 0.03 (from 0.59 to 0.62) on removing the PSQI compo-nents of medicine use and daytime dysfunction. The in-ternal homogeneity as indicated by Spearman’s correlation coefficient (r) between component scores and the global PSQI score was 0.15–0.81. All the correl-ation coefficients were significant (p< 0.001) (Table 3). The groups identified as normal sleep and insomnia based on clinical interview differed across the global PSQI score and all the components score except the component for medicine use and daytime dysfunction (Table 4). The ROC curve is shown in Fig. 1. Table 5 shows the results of the ROC curve analysis with sensi-tivity and specificity for all the global PSQI scores be-tween 0.5 and 16. The sensitivity and specificity of the PSQI at the cut-off score of 5.5 were 82 and 56.2%, respectively.
Tables 6, 7 and 8 shows the results of the factor ana-lysis. The results of Kaiser-Meyer-Olkin test of sampling adequacy, Bartlett’s test of sphericity, anti-image matrix and determinant show that the sample met the condi-tions for factor analysis (Table 6) [11, 16]. Kaiser’s cri-teria (Eigenvalue > 1), Scree plot and parallel analysis identified 3-factor models, while cumulative variance rule (>40%) found 2-factor model for the PSQI with
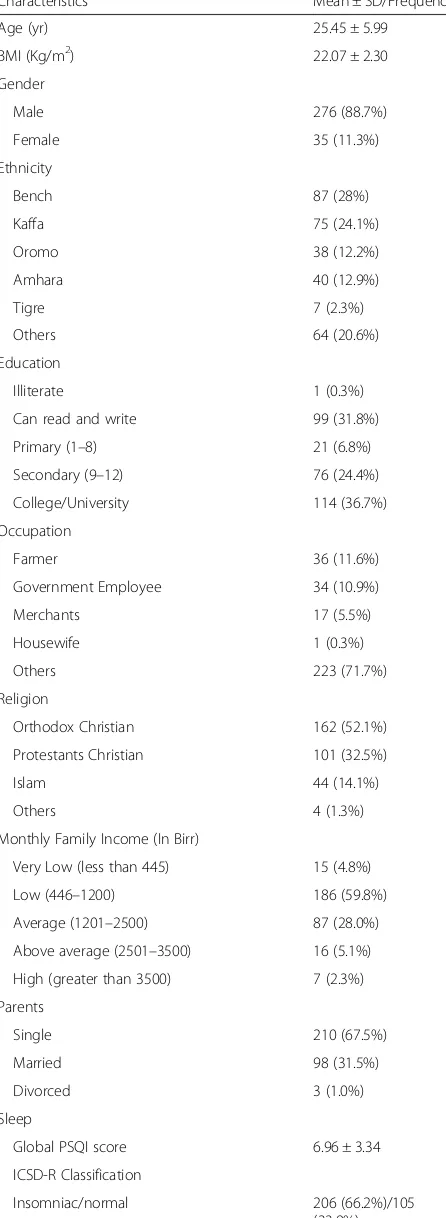
Table 1Socio-demographics of community dwelling Ethiopian adults
Characteristics Mean ± SD/Frequency
Age (yr) 25.45 ± 5.99
BMI (Kg/m2) 22.07 ± 2.30
Gender
Male 276 (88.7%)
Female 35 (11.3%)
Ethnicity
Bench 87 (28%)
Kaffa 75 (24.1%)
Oromo 38 (12.2%)
Amhara 40 (12.9%)
Tigre 7 (2.3%)
Others 64 (20.6%)
Education
Illiterate 1 (0.3%)
Can read and write 99 (31.8%)
Primary (1–8) 21 (6.8%)
Secondary (9–12) 76 (24.4%)
College/University 114 (36.7%)
Occupation
Farmer 36 (11.6%)
Government Employee 34 (10.9%)
Merchants 17 (5.5%)
Housewife 1 (0.3%)
Others 223 (71.7%)
Religion
Orthodox Christian 162 (52.1%)
Protestants Christian 101 (32.5%)
Islam 44 (14.1%)
Others 4 (1.3%)
Monthly Family Income (In Birr)
Very Low (less than 445) 15 (4.8%)
Low (446–1200) 186 (59.8%)
Average (1201–2500) 87 (28.0%)
Above average (2501–3500) 16 (5.1%)
High (greater than 3500) 7 (2.3%)
Parents
Single 210 (67.5%)
Married 98 (31.5%)
Divorced 3 (1.0%)
Sleep
Global PSQI score 6.96 ± 3.34
ICSD-R Classification
Insomniac/normal 206 (66.2%)/105 (33.8%)
Table 1Socio-demographics of community dwelling Ethiopian adults(Continued)
Substance use/Habits
Chat user/non-user 162 (52.1%)/149 (47.9%)
Alcoholic/non-alcoholic 230 (74%)/81 (26%)
Smoker/non-smoker 79 (25.4%)/232 (74.6%)
Tea/Coffee consumer/non-consumer 308 (99.0%)/3 (1.0%)
Beverage consumer/beverage non-consumer
129 (41.5%)/182 (58.5%)
seven components. Kaiser’s criteria (Eigenvalue > 1), Scree plot and parallel analysis identified 2-factor model, while cumulative variance rule (>40%) found 1-factor model for the PSQI with five components (without the PSQI components of medicine use and daytime dysfunc-tion) (Table 6).
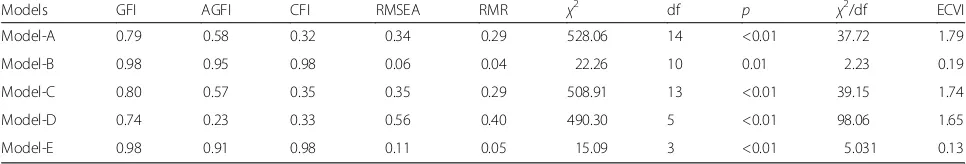
The CFA was run on five models of the PSQI (Table 8); Model-A: 1-Factor model of the PSQI with all the seven components; Model-B: 1-Factor model of the PSQI with all the seven components and incorporation of modifica-tion index (correlamodifica-tions between error terms); Model-C: 2-Factor model of the PSQI (Factor-1 comprised of the PSQI components for sleep quality, sleep latency, sleep
duration, sleep efficiency and sleep disturbances; Factor-2 comprised of the PSQI components for sleep medicine and daytime dysfunction); Model-D: 1-Factor model of the PSQI with only five components (without the PSQI components for sleep medicine and daytime dysfunc-tion); Model-E: 1-Factor model of the PSQI with only five components (without the PSQI components for sleep medicine and daytime dysfunction) with incorpor-ation of modificincorpor-ation index (correlincorpor-ations between error terms). None of the models had absolute fit to the data i.e. non-significant χ2 p value (Table 8). Three models performed poorly i.e. RMR and RMSEA were higher
Table 2The distribution of the Pittsburgh Sleep Quality Index (PSQI) scores in community dwelling Ethiopian adults Components of
the PSQI
PSQI
sub-component
Frequency Percentage
PSQI component of
sleep duration ≥
7 h 95 30.5
6–7 h 53 17.0
5–6 h 28 9.0
<5 h 135 43.4
PSQI component of sleep disturbances
0 47 15.1
1 261 83.9
2 3 1.0
3 0 0
PSQI component of sleep latency
0 36 11.6
1 113 36.3
2 124 39.9
3 38 12.2
PSQI component of daytime dysfunction
0 293 94.2
1 14 4.5
2 4 1.3
3 0 0
PSQI component of sleep efficiency
>85% 105 33.8
75–84% 24 7.7
65–74% 27 8.7
<65% 155 49.8
PSQI component of sleep quality
Very good 97 31.2
Fairly good 126 40.5
Fairly bad 54 17.4
Very bad 34 10.9
PSQI component of sleep medication
Not during the past month
306 98.4
Less than once a week
3 1.0
Once or twice a week
2 .6
Three or more times a week
0 00
Table 3Internal consistency and homogeneity of the Pittsburgh Sleep Quality Index (PSQI) scores in community dwelling Ethiopian adults
Components of the PSQI
Component-to- global PSQI score correlations
Cronbach’s Alpha if Component Deleted
PSQI component of sleep quality
.50 .58
PSQI component of sleep latency
.56 .52
PSQI component of sleep duration
.81 .43
PSQI component of sleep efficiency
.81 .45
PSQI component of sleep disturbances
.34 .58
PSQI component of sleep medication
.18 .60
PSQI component of daytime dysfunction
.15 .60
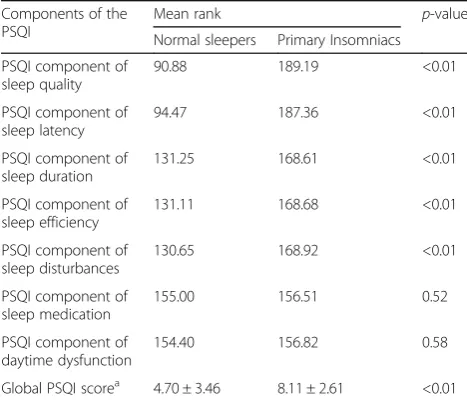
Table 4Discriminative validity: Comparison of the Pittsburgh Sleep Quality Index (PSQI) scores between normal sleepers and insomniacs as determined by clinical interview in community dwelling Ethiopian adults
Components of the PSQI
Mean rank p-value
Normal sleepers Primary Insomniacs
PSQI component of sleep quality
90.88 189.19 <0.01
PSQI component of sleep latency
94.47 187.36 <0.01
PSQI component of sleep duration
131.25 168.61 <0.01
PSQI component of sleep efficiency
131.11 168.68 <0.01
PSQI component of sleep disturbances
130.65 168.92 <0.01
PSQI component of sleep medication
155.00 156.51 0.52
PSQI component of daytime dysfunction
154.40 156.82 0.58
Global PSQI scorea 4.70 ± 3.46 8.11 ± 2.61 <0.01
a
than the cut-off values, while GFI, AGFI and CFI were lower than the cut-off values. Model-B performed best with highest values for GFI, AGFI and CFI, while it had lowest values for RMSEA, RMR andχ2/df.
Discussion
This is the first study to examine the psychometric and diagnostic validity of a sleep questionnaire tool in any
segment of the Ethiopian population. In this study, the PSQI was validated in community dwelling Ethiopian adults using ICSD-R criteria for screening of insomnia. The individual components of the PSQI had floor and ceiling effects but the global PSQI score did not have ei-ther of these effects (Table 2). Therefore, item analysis does support validity of the overall score of the scale [14]. One of the few studies that reported about floor and ceiling effects found that floor effects were observed for all the PSQI components except for sleep distur-bances (Table 2) in patients of temporomandibular disorders [17].
The internal consistency as assessed in this population of community dwelling Ethiopian adults was moderately adequate. Although, the value of Cronbach’s alpha was low in this study, it may be noted that the tool has never been reported to show a value of this psychometric index within the ideal range i.e., 0.9–0.95. Previous stud-ies have reported Cronbach’s alpha values between 0.58 and 0.83 [5, 6, 17]. However, Rener-Sitar et al. 2014 reported a value of Cronbach alpha (.58) in patients of temporomandibular disorders without complaints of pain [17], which is almost similar to the one found in our study (Table 2). The component-global PSQI score correlation was moderate to strong except for the PSQI component of medicine and daytime dysfunction (Table 2). A recent systematic review concluded that the sleep medicine com-ponent has been shown to contribute poorly to construct validity [5]. Additionally, lack of awareness about sleep health in developing societies is common [18]. The lesser awareness might lead to contrived low sensitivity of this component in such societies [4, 10].
The significantly higher values of the global PSQI and component scores (except daytime dysfunction and sleep medicine) among insomniacs establish the diagnostic known-group or discriminative validity of the tool in this
Fig. 1Receiver operator curves (A) No discrimination (AUC = 0.5) (B) Experimental test (0.78 (p< 0.001)) and (C) Perfect test (AUC = 1.0) in community dwelling Ethiopian adults
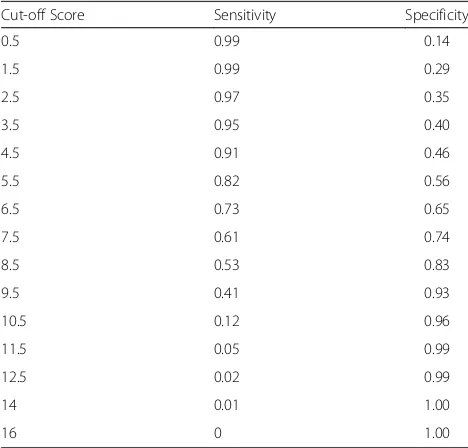
Table 5Sensitivity and specificity of the Pittsburgh Sleep Quality Index at each cut-off score in community dwelling Ethiopian adults
Cut-off Score Sensitivity Specificity
0.5 0.99 0.14
1.5 0.99 0.29
2.5 0.97 0.35
3.5 0.95 0.40
4.5 0.91 0.46
5.5 0.82 0.56
6.5 0.73 0.65
7.5 0.61 0.74
8.5 0.53 0.83
9.5 0.41 0.93
10.5 0.12 0.96
11.5 0.05 0.99
12.5 0.02 0.99
14 0.01 1.00
16 0 1.00
Table 6Summary of the sample size adequacy measures and exploratory factor analysis of the Pittsburgh Sleep Quality Index in community dwelling Ethiopian adults
Measures PSQI (Seven
components)
PSQI (Five components)
Kaiser-Meyer-Olkin Test of Sampling Adequacy
0.51 0.52
Bartlett’s test of Sphericity <0.001 <0.001
Anti-image matrix 0.39–0.67 0.48–0.64
Determinant 0.08 0.09
Number of factors
Kaiser’s criteria (Eigenvalue > 1) 3 2
Cumulative variance rule (>40%) 2 1
Scree plot 3 2
Parallel analysis 3 2
population of community dwelling Ethiopian adults. Notably, with regard to discriminative validity a striking similarity was observed with the previous report in African population from Nigeria. The validation of the tool in the Nigerian students found that the global PSQI and compo-nent scores (except daytime dysfunction and sleep medi-cine) were significantly higher among insomniacs [7]. The relatively less contribution of the PSQI component of daytime dysfunction and sleep medicine to internal consistency, homogeneity, and discriminative validity in Afro-Asian populations [4, 7, 10] is interesting and need to be explored further. This may help further increase the utility of the tool in these populations and understanding of sleep health construct in these societies.
The diagnostic validity of the scale against ICSD-R cri-teria for insomnia in this sample of community dwelling Ethiopian adults was in moderate to adequate range. The AUC of 0.78 (Fig. 1) found in our study was slightly less than the recommended limit value of 0.80 for good diagnostic use [19]. However, it is higher than those reported by other studies with different gold standard and/or concurrent measure in diverse samples [5]. The value was almost similar to that reported in patients with lower back pain; AUC was 0.79 (CI 0.723–0.819;p < 0.0001), for identifying insomnia. The concurrent measure employed in that study was sleep diary [8].
However, the value of AUC in our study was higher than that reported in Nigerian students; AUC (0.685), this study employed a measure of concurrent validity that was similar to that used in our study [7]. The cut-off score (5.5) (Table 5 and Fig. 1) for screening insomnia in our study sample of community dwelling Ethiopian adults was higher than that reported in Nigerian students and less than that estimated in patients of post-acute brain injury [7, 9]. The global PSQI score cannot take values in decimals [6], therefore the practical cut-off score in our study was 6-a value similar to that reported in patients of lower back pain for screening insomnia [8]. The sensitivity (82%) and specificity (56.2%) of the PSQI at the cut-off score was comparable to previous studies validating the tool for screening of primary insomnia [7–9]. The results of the EFA were inconclusive, but the outcome of CFA fa-vored unidimensionality of the PSQI in the Ethiopian community adults (Tables 6, 7 and 8). This is similar to some of the previous reports [5, 11, 17], though hetero-geneity of the factor structure of the PSQI remains an area of extensive research [5, 7, 11, 16].
The limitations of this study include a modest sample size, and non-application of polysomnography. The gen-der ratio of the sample was not representative of the general Ethiopian population. Therefore, the results of the study may be gender biased for males. Future work
Table 7Factor loadings in exploratory factor analysis of the Pittsburgh Sleep Quality Index in community dwelling Ethiopian adults
Components of the PSQI PSQI (Seven components) PSQI (Five components)
Factor 1 Factor 2 Factor 3 Factor 1 Factor 2
PSQI component of sleep quality .88 .05 .08 .88 .05
PSQI component of sleep latency .87 −.13 .18 .87 −.13
PSQI component of sleep duration .10 −.96 .01 .10 −.97
PSQI component of sleep efficiency .09 −.97 .06 .09 −.97
PSQI component of sleep disturbances .62 −.13 .08 .62 −.12
PSQI component of sleep medication .16 −.03 .78
PSQI component of daytime dysfunction .06 −.03 .81
Principal component analysis with direct oblimin rotation (Kaiser Normalization) was employed.PSQIPittsburgh sleep quality index
Table 8Summary of the Confirmatory factor analysis of the Pittsburgh Sleep Quality Index in community dwelling Ethiopian adults
Models GFI AGFI CFI RMSEA RMR χ2 df p χ2/df ECVI
Model-A 0.79 0.58 0.32 0.34 0.29 528.06 14 <0.01 37.72 1.79
Model-B 0.98 0.95 0.98 0.06 0.04 22.26 10 0.01 2.23 0.19
Model-C 0.80 0.57 0.35 0.35 0.29 508.91 13 <0.01 39.15 1.74
Model-D 0.74 0.23 0.33 0.56 0.40 490.30 5 <0.01 98.06 1.65
Model-E 0.98 0.91 0.98 0.11 0.05 15.09 3 <0.01 5.031 0.13
Model-A: 1-Factor model of the PSQI with all the seven components; Model-B: 1-Factor model of the PSQI with all the seven components and incorporation of modification index (correlations between error terms); Model-C: 2-Factor model of the PSQI (Factor-1 comprised of SLPQUAL, LATEN, DURAT, HSE, DISTB; Factor-2 comprised of MEDS, DAYDYS); Model-D: 1-Factor model of the PSQI with only five components (without MEDS and DAYDYS); Model-E: 1-Factor model of the PSQI with only five components (without MEDS and DAYDYS) with incorporation of modification index (correlations between error terms)
GFIgoodness of fit index,AGFIadjusted goodness of fit index,CFIcomparative fit index,RMSEAroot mean square error of approximation,RMRroot mean square residual,ECVIexpected cross-validation index
should explore this aspect. However, the merit of the study include concurrent measure of clinical screening by sleep researchers based on ICSD-R, validation in a population having high prevalence of sleep problems which may be related to chat addiction and that does not have access to polysomnography, actigraphy and trained sleep health professionals. The PSQI was found to be of adequate use for screening for insomnia among this sample of community dwelling Ethiopian adults.
Additional file
Additional file 1:The dataset used in validation of the Pittsburgh Sleep Quality Index in the community dwelling Ethiopian adults. (SAV 22 kb)
Acknowledgements
We are grateful to the participants of the study. The Mizan-Tepi University faculty research fund sponsored the work.
Funding
The work was supported by the Mizan-Tepi University faculty research fund. The funding body did not have any role in the design of the study and data collection, analysis, interpretation of data and/or in writing the manuscript.
Availability of data and materials
The raw data file has been submitted as Additional file 1.
Authors’contributions
MS: data acquisition, analysis and Interpretation, critical revision of the Manuscript, and approved the final version of the manuscript. TT: data acquisition, analysis and Interpretation, manuscript preparation, and approved the final version of the manuscript. AK: Concept development, critical revision of the Manuscript, and approved the final version of the manuscript. SRP: concept development and study Design, critical revision of the Manuscript, and approved the final version of the manuscript. ASB: concept development and study Design, critical revision of the Manuscript, and approved the final version of the manuscript. MDM: concept development and study Design, analysis and Interpretation, manuscript preparation, critical revision of the Manuscript, and approved the final version of the manuscript. All authors read and approved the final manuscript.
Competing interests
The authors declare that they have no competing interests.
Consent for publication
Not applicable.
Ethics approval and consent to participate
The study was approved by the Human Institutional Ethics Committee of Mizan-Tepi University, and informed consent was obtained from all participants.
Clinical trials registry site and number
Not applicable.
Publisher’s Note
Springer Nature remains neutral with regard to jurisdictional claims in published maps and institutional affiliations.
Author details
1Department of Pharmacy, College of Health Sciences, Mizan-Tepi University, Mizan Aman, Ethiopia.2Department of Biomedical Sciences, College of Health Sciences, Mizan-Tepi University (Mizan Campus), Mizan Aman, Ethiopia.3Somnogen Canada Inc, College Street, Toronto, ON, Canada.4The University Sleep Disorders Center, King Saud University, Riyadh, Saudi Arabia.
5National Plan for Science and Technology, College of Medicine, King Saud University, Riyadh, Saudi Arabia.
Received: 11 September 2016 Accepted: 21 March 2017
References
1. National Sleep Foundation. National Sleep Foundation: sleep in America, Poll. Washington: National Sleep Foundation; 2008.
2. Lemma S, Patel SV, Tarekegn YA, Tadesse MG, Berhane Y, Gelaye B, Williams MA. The epidemiology of sleep quality, sleep patterns, consumption of caffeinated beverages, and khat use among Ethiopian college students. Sleep disorders. 2012;2012:583510.
3. Lemma S, Gelaye B, Berhane Y, Worku A, Williams MA. Sleep quality and its psychological correlates among university students in Ethiopia: a cross-sectional study. BMC psychiatry. 2012;12:237.
4. Manzar MD, Zannat W, Kaur M, Hussain ME. Sleep in university students across years of university education and gender influences. Int J Adolesc Med Health. 2015;27:341–8.
5. Mollayeva T, Thurairajah P, Burton K, Mollayeva S, Shapiro CM, Colantonio A. The Pittsburgh sleep quality index as a screening tool for sleep dysfunction in clinical and non-clinical samples: A systematic review and meta-analysis. Sleep Med Rev. 2016;25:52–73.
6. Buysse DJ, Reynolds 3rd CF, Monk TH, Berman SR, Kupfer DJ. The Pittsburgh Sleep Quality Index: a new instrument for psychiatric practice and research. Psychiatry Res. 1989;28:193–213.
7. Aloba OO, Adewuya AO, Ola BA, Mapayi BM. Validity of the Pittsburgh Sleep Quality Index (PSQI) among Nigerian university students. Sleep Med. 2007;8:266–70.
8. Alsaadi SM, McAuley JH, Hush JM, Bartlett DJ, Henschke N, Grunstein RR, et al. Detecting insomnia in patients with low back pain: accuracy of four self-report measures. BMC Musculoskel Dis. 2013;14:196.
9. Fichtenberg NL, Zafonte RD, Putnam S, Mann NR, Millard AE. Insomnia in a post-acute brain injury sample. Brain Inj. 2002;16:197e206.
10. Manzar MD, Moiz JA, Zannat W, Spence DW, Pandi-Perumal SR, BaHammam AS, Hussain ME. Validity of the Pittsburgh Sleep Quality index in Indian university students. Oman Med J. 2015;30:193–202.
11. Manzar MD, Zannat W, Moiz JA, Spence DW, Pandi-Perumal SR, Bahammam AS, Hussain ME. Factor scoring models of the Pittsburgh Sleep Quality Index: a comparative confirmatory factor analysis. Biol Rhythm Res. 2016;47:851–64.
12. Hu LT, Bentler PM. Cutoff criteria for fit indexes in covariance structure analysis: Conventional criteria versus new alternatives. Struct Equ Model. 1999;6:1–55.
13. Ullman JB. Structural equation modeling. In: Tabachnick BG, Fidell LS, editors. Using Multivariate Statistic. Needham Heights, Massachusetts: Allyn and Bacon; 2001. p. 653–771.
14. Lim CR, Harris K, Dawson J, Beard DJ, Fitzpatrick R, Price AJ. Floor and ceiling effects in the OHS: an analysis of the NHS PROMs data set. BMJ Open. 2015;5, e007765.
15. Terwee CB, Bot SD, De Boer MR, van der Windt DA, Knol DL, Dekker J, Bouter LM, De Vet HC. Quality criteria were proposed for measurement properties of health status questionnaires. J Clin Epidemiol. 2007;60:34–42. 16. Manzar MD, Zannat W, Hussain ME, Pandi-Perumal SR, Bahammam AS,
Barakat D, Ojike NI, Olaish A, Spence DW. Dimensionality of the Pittsburgh Sleep Quality Index in the collegiate young adults. Springerplus. 2016;5:1550.
17. Rener-Sitar K, John MT, Bandyopadhyay D, Howell MJ, Schiffman EL. Exploration of dimensionality and psychometric properties of the Pittsburgh Sleep Quality Index in cases with temporomandibular disorders. Health Qual Life Out. 2014;12:1–9.
18. Manzar MD, Hussain ME. Lack of awareness and apathy to sleep health issues. Indian Journal of Science Communication. 2014;13:7–10. 19. Hanley JA, McNeil BJ. The meaning and use of the area under a receiver