C O M M E N T A R Y
Open Access
Preferred reporting items for studies
mapping onto preference-based outcome
measures: The MAPS statement
Stavros Petrou
1*, Oliver Rivero-Arias
2, Helen Dakin
3, Louise Longworth
4, Mark Oppe
5, Robert Froud
1,6and Alastair Gray
3Abstract
‘Mapping’onto generic preference-based outcome measures is increasingly being used as a means of generating health utilities for use within health economic evaluations. Despite publication of technical guides for the conduct of mapping research, guidance for thereportingof mapping studies is currently lacking. The MAPS (MApping onto Preference-based measures reporting Standards) statement is a new checklist, which aims to promote complete and transparent reporting of mapping studies. The primary audiences for the MAPS statement are researchers reporting mapping studies, the funders of the research, and peer reviewers and editors involved in assessing mapping studies for publication.
Ade novolist of 29 candidate reporting items and accompanying explanations was created by a working group comprised of six health economists and one Delphi methodologist. Following a two-round, modified Delphi survey with representatives from academia, consultancy, health technology assessment agencies and the biomedical journal editorial community, a final set of 23 items deemed essential for transparent reporting, and accompanying explanations, was developed. The items are contained in a user friendly 23 item checklist. They are presented numerically and categorised within six sections, namely: (i) title and abstract; (ii) introduction; (iii) methods; (iv) results; (v) discussion; and (vi) other. The MAPS statement is best applied in conjunction with the accompanying MAPS explanation and elaboration document.
It is anticipated that the MAPS statement will improve the clarity, transparency and completeness of reporting of mapping studies. To facilitate dissemination and uptake, the MAPS statement is being co-published by eight health economics and quality of life journals, and broader endorsement is encouraged. The MAPS working group plans to assess the need for an update of the reporting checklist in five years’time.
This statement was published jointly inApplied Health Economics and Health Policy,Health and Quality of Life Outcomes,International Journal of Technology Assessment in Health Care,Journal of Medical Economics, Medical Decision Making,PharmacoEconomics, andQuality of Life Research.
Introduction
The process of ‘mapping’ onto generic preference-based outcome measures is increasingly being used as a means of generating health utilities for application within health economic evaluations [1]. Mapping involves the develop-ment and use of an algorithm (or algorithms) to predict the primary outputs of generic preference-based outcome
measures,i.e.health utility values, using data on other in-dicators or measures of health. The source predictive measure may be a non-preference based indicator or measure of health outcome or, more exceptionally, a preference-based outcome measure that is not preferred by the local health technology assessment agency. The al-gorithm(s) can subsequently be applied to data from clin-ical trials, observational studies or economic models containing the source predictive measure(s) to predict health utility values in contexts where the target generic preference-based measure is absent. The predicted health * Correspondence:[email protected]
1
Warwick Clinical Trials Unit, Warwick Medical School, University of Warwick, Coventry CV4 7AL, UK
Full list of author information is available at the end of the article
utility values can then be analysed using standard methods for individual-level data (e.g. within a trial-based economic evaluation), or summarised for each health state within a decision-analytic model.
Over recent years there has been a rapid increase in the publication of studies that use mapping techniques to predict health utility values, and databases of pub-lished studies in this field are beginning to emerge [2]. Some authors [3] and agencies [4] concerned with tech-nology appraisals have issued technical guides for the conduct of mapping research. However, guidance for the
reporting of mapping studies is currently lacking. In keeping with health-related research more broadly [5], mapping studies should be reported fully and transpar-ently to allow readers to assess the relative merits of the investigation [6]. Moreover, there may be significant op-portunity costs associated with regulatory and reim-bursement decisions for new technologies informed by misleading findings from mapping studies. This has led to the development of the MAPS (MApping onto Preference-based measures reporting Standards) report-ing statement, which we summarise in this paper.
The aim of the MAPS reporting statement is to pro-vide recommendations, in the form of a checklist of es-sential items, which authors should consider when reporting a mapping study. It is anticipated that the checklist will promote complete and transparent report-ing by researchers. The focus, therefore, is on promotreport-ing the quality of reporting of mapping studies, rather than the quality of their conduct, although it is possible that the reporting statement will also indirectly enhance the methodological rigour of the research [7]. The MAPS reporting statement is primarily targeted at researchers developing mapping algorithms, the funders of the re-search, and peer reviewers and editors involved in the manuscript review process for mapping studies [5, 6]. In developing the reporting statement, the term ‘mapping’ is used to cover all approaches that predict the outputs of generic preference-based outcome measures using data on other indicators or measures of health, and en-compasses related forms of nomenclature used by some researchers, such as‘cross-walking’or‘transfer to utility’ [1, 8]. Similarly, the term‘algorithm’is used in its broad-est sense to encompass statistical associations and more complex series of operations.
The development of the MAPS statement
The development of the MAPS reporting statement was informed by recently published guidance for health re-search reporting guidelines [5] and broadly modelled other recent reporting guideline developments [9–14]. A working group comprised of six health economists (SP, ORA, HD, LL, MO, AG) and one Delphi methodologist (RF) was formed following a request from an academic
journal to develop a reporting statement for mapping studies. One of the working group members (HD) had previously conducted a systematic review of studies map-ping from clinical or health-related quality of life measures onto the EQ-5D [2]. Using the search terms from this sys-tematic review, as well as other relevant articles and re-ports already in our possession, a broad search for reporting guidelines for mapping studies was conducted. This confirmed that no previous reporting guidance had been published. The working group members therefore developed a preliminaryde novolist of 29 reporting items and accompanying explanations. Following further review by the working group members, this was subsequently dis-tilled into a list of 25 reporting items and accompanying explanations.
Members of the working group identified 62 possible candidates for a Delphi panel from a pool of active re-searchers and stakeholders in this field. The candidates included individuals from academic and consultancy set-tings with considerable experience in mapping research, representatives from health technology assessment agen-cies that routinely appraise evidence informed by map-ping studies, and biomedical journal editors. Health economists from the MAPS working group were in-cluded in the Delphi panel. A total of 48 of the 62 (77.4 %) individuals agreed to participate in a Delphi sur-vey aimed at developing a minimum set of standard reporting requirements for mapping studies with an ac-companying reporting checklist.
The Delphi panellists were sent a personalised link to a Web-based survey, which had been piloted by mem-bers of the working group. Non-responders were sent up to two reminders after 14 and 21 days. The panellists were anonymous to each other throughout the study and their identities were known only to one member of the working group. The panellists were invited to rate the importance of each of the 25 candidate reporting items identified by the working group on a 9-point rat-ing scale (1, “not important”, to 9, “extremely import-ant”); describe their confidence in their ratings (“not confident”, “somewhat confident” or “very confident”); comment on the candidate items and their explanations; suggest additional items for consideration by the panel-lists in subsequent rounds; and to provide any other general comments. The candidate reporting items were ordered within six sections: (i) title and abstract; (ii) introduction; (iii) methods; (iv) results; (v) discussion; and (vi) other. The panellists also provided information about their geographical area of work, gender, and pri-mary and additional work environments. The data were imported into Stata (version 13; Stata-Corp, College Station, TX) for analysis.
appropriateness method was used to analyse the round one responses [15]. This involved calculating the median score, the inter-percentile range (IPR) (30th and 70th), and the inter-percentile range adjusted for symmetry (IPRAS), for each item (i) being rated. The IPRAS in-cludes a correction factor for asymmetric ratings, and panel disagreement was judged to be present in cases if IPRi> IPRASi [15]. We modified the RAND/UCLA ap-proach by asking panellists about ‘importance’ rather than ‘appropriateness’ per se. Assessment of importance followed the classic RAND/UCLA definitions, cate-gorised simply as whether the median rating fell between 1 and 3 (unimportant), 4 and 6 (neither unimportant nor important), or 7 and 9 (important) [15].
The results of round one of the Delphi survey were reviewed at a face-to-face meeting of the working group. A total of 46 of the 48 (95.8 %) individuals who agreed to participate completed round one of the survey. Of the 25 items, 24 were rated as important, with one item (“Source of Funding”) rated as neither unimportant nor important. There was no evidence of disagreement on ratings of any items according to the RAND/UCLA method. These findings did not change when the responses of the MAPS working group were excluded. Based on the qualitative feedback received in round one, items describing “Modelling Approaches” and “Repeated Measurements” were merged, as were items describing“Model Diagnostics” and “Model Plausibility”. In addition, amendments to the wording of several recommendations and their explanations were made in the light of qualitative feedback from the panellists.
Panellists participating in round one were invited to participate in a second round of the Delphi survey. A summary of revisions made following round one was provided. This included a document in which revisions to each of the recommendations and explanations were displayed in the form of track changes. Panellists partici-pating in round two were provided with group outputs (mean scores and their standard deviations, median scores and their IPRs, histograms and RAND/UCLA la-bels of importance and agreement level) summarising the round one results (and disaggregated outputs for the merged items). They were also able to view their own round one scores for each item (and disaggregated scores for the merged items). Panellists participating in round two were offered the opportunity to revise their rating of the importance of each of the items and in-formed that their rating from round one would other-wise hold. For the merged items, new ratings were solicited. Panellists participating in round two were also offered the opportunity to provide any further com-ments on each item or any further information that might be helpful to the group. Non-responders to the second round of the Delphi survey were sent up to two
reminders after 14 and 21 days. The analytical methods for the round two data mirrored those for the first round.
The results of the second round of the Delphi survey were reviewed at a face-to-face meeting of the working group. A total of 39 of the 46 (84.8 %) panellists partici-pating in round one completed round two of the survey. All 23 items included in the second round were rated as important with no evidence of disagreement on ratings of any items according to the RAND/UCLA method. Qualitative feedback from the panellists participating in round two led to minor modifications to wording of a small number of recommendations and their explana-tions. This was fed back to the round two respondents who were given a final opportunity to comment on the readability of the final set of recommendations and ex-planations. Based on these methods, a final consensus list of 23 reporting items was developed.
The MAPS statement
The MAPS statement is a 23-item checklist of recom-mendations (Table 1) that we consider essential for complete and transparent reporting of studies that map onto generic preference-based outcome measures. The 23 reporting items are presented numerically and cate-gorised within six sections, namely: (i) title and abstract (2 items); (ii) introduction (2 items); (iii) methods (9 items); (iv) results (6 items); (v) discussion (3 items); and (vi) other (1 item). The reporting of each item does not necessarily have to follow the order within the MAPS statement. Rather, what is important is that each recom-mendation is addressed either in the main body of the re-port or its appendices. Several biomedical journals have endorsed the MAPS statement. These include Applied Health Economics and Health Policy,Health and Quality of Life Outcomes,International Journal of Technology As-sessment in Health Care, Journal of Medical Economics,
Medical Decision Making,PharmacoEconomicsand Qual-ity of Life Research. We encourage other journals and re-search interest groups to endorse the MAPS statement and authors to adhere to its principles.
The MAPS explanation and elaboration paper
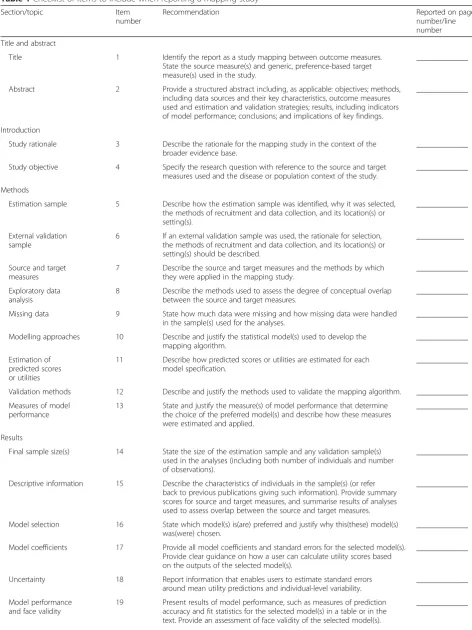
Table 1Checklist of items to include when reporting a mapping study
Section/topic Item
number
Recommendation Reported on page
number/line number
Title and abstract
Title 1 Identify the report as a study mapping between outcome measures.
State the source measure(s) and generic, preference-based target measure(s) used in the study.
_____________
Abstract 2 Provide a structured abstract including, as applicable: objectives; methods, including data sources and their key characteristics, outcome measures used and estimation and validation strategies; results, including indicators of model performance; conclusions; and implications of key findings.
_____________
Introduction
Study rationale 3 Describe the rationale for the mapping study in the context of the broader evidence base.
_____________
Study objective 4 Specify the research question with reference to the source and target measures used and the disease or population context of the study.
_____________
Methods
Estimation sample 5 Describe how the estimation sample was identified, why it was selected, the methods of recruitment and data collection, and its location(s) or setting(s).
_____________
External validation sample
6 If an external validation sample was used, the rationale for selection, the methods of recruitment and data collection, and its location(s) or setting(s) should be described.
____________
Source and target measures
7 Describe the source and target measures and the methods by which they were applied in the mapping study.
_____________
Exploratory data analysis
8 Describe the methods used to assess the degree of conceptual overlap between the source and target measures.
_____________
Missing data 9 State how much data were missing and how missing data were handled in the sample(s) used for the analyses.
_____________
Modelling approaches 10 Describe and justify the statistical model(s) used to develop the mapping algorithm.
_____________
Estimation of predicted scores or utilities
11 Describe how predicted scores or utilities are estimated for each model specification.
_____________
Validation methods 12 Describe and justify the methods used to validate the mapping algorithm. _____________
Measures of model performance
13 State and justify the measure(s) of model performance that determine the choice of the preferred model(s) and describe how these measures were estimated and applied.
_____________
Results
Final sample size(s) 14 State the size of the estimation sample and any validation sample(s) used in the analyses (including both number of individuals and number of observations).
_____________
Descriptive information 15 Describe the characteristics of individuals in the sample(s) (or refer back to previous publications giving such information). Provide summary scores for source and target measures, and summarise results of analyses used to assess overlap between the source and target measures.
_____________
Model selection 16 State which model(s) is(are) preferred and justify why this(these) model(s) was(were) chosen.
_____________
Model coefficients 17 Provide all model coefficients and standard errors for the selected model(s). Provide clear guidance on how a user can calculate utility scores based on the outputs of the selected model(s).
_____________
Uncertainty 18 Report information that enables users to estimate standard errors around mean utility predictions and individual-level variability.
_____________
Model performance and face validity
19 Present results of model performance, such as measures of prediction accuracy and fit statistics for the selected model(s) in a table or in the text. Provide an assessment of face validity of the selected model(s).
relevant evidence where available. The development of the Explanation and Elaboration paper was completed follow-ing several iterations produced by members of the work-ing group, after which the examples and explanations were shared with the Delphi panellists for final revisions to improve readability and their approval. The Explanation and Elaboration paper also summarises the characteristics of the Delphi panellists and provides detailed statistics for item ratings at each Delphi round.
Discussion
Over recent years, there has been a rapid increase in the publication of studies that use mapping techniques to predict health utility values. One recent review article identified ninety studies published up to the year 2013 reporting 121 mapping algorithms between clinical or health-related quality of life measures and the EQ-5D [2]. That review article excluded mapping algorithms targeted at other generic preference-based outcome measures that can generate health utilities, such as the SF-6D [17] and the Health Utilities Index (HUI) [18], which have been the target of numerous other mapping algorithms (e.g. [19–24, 1]). Moreover, the popularity of the mapping approach for estimating health utilities is unlikely to wane given the numerous contexts within health economic evaluation where primary data collec-tion is challenging. However, mapping introduces add-itional uncertainty and collection of primary data with the preferred utility instrument is preferable.
The MAPS reporting statement was developed to pro-vide recommendations, in the form of a checklist of es-sential items, which authors should consider when reporting mapping studies. Guidance for the reporting of mapping studies was not previously available in the literature. The overall aim of MAPS is to promote clarity, transparency and completeness of reporting of mapping studies. It is not intended to act as a methodological guide, nor as a tool for assessing the quality of study method-ology. Rather, it aims to avoid misleading conclusions
being drawn by readers, and ultimately policy makers, as a result of sub-optimal reporting. In keeping with other re-cent health research reporting guidelines, we have also produced an accompanying Explanation and Elaboration paper [16] to facilitate a deeper understanding of the 23 items contained within the MAPS reporting statement. That paper should hopefully act as a pedagogical frame-work for researchers reporting mapping studies.
The development of the MAPS reporting statement, and its Explanation and Elaboration document, was framed by recently published guidance for health re-search reporting guidelines [5]. The Delphi panel was composed of a multi-disciplinary, multi-national team of content experts and journal editors. The panel members included people experienced in conducting mapping studies; of the 84 researchers who were first authors on papers included in a recent review of EQ-5D mapping studies [2], 31 (36.9 %) were included as panellists. We have no evidence to believe that a larger panel would have altered the final set of recommendations. The Del-phi methodologies that we applied included analytical approaches only recently adopted by developers of health reporting guidelines [15]. We are unable to assess whether a strict adherence to the MAPS checklist will increase the word counts of mapping reports. It is our view that the increasing use of online appendices by jour-nals should permit comprehensive reporting even in the context of strict word limits for the main body of reports.
Evidence for other health research reporting guidelines suggests that reporting quality improved after the intro-duction of reporting checklists [25–27], although there is currently no empirical evidence that adoption of MAPS will improve the quality of reporting of mapping research. Future research planned by the MAPS working group will include a before and after evaluation of the ben-efits (and indeed possible adverse effects) of the introduc-tion of the MAPS reporting statement. It will also be necessary to update the MAPS reporting statement in the future to address conceptual, methodological and practical
Table 1Checklist of items to include when reporting a mapping study(Continued)
Discussion
Comparisons with previous studies
20 Report details of previously published studies developing mapping algorithms
between the same source and target measures and describe differences between the algorithms, in terms of model performance, predictions and coefficients, if applicable.
_____________
Study limitations 21 Outline the potential limitations of the mapping algorithm. _____________
Scope of applications
22 Outline the clinical and research settings in which the mapping algorithm could be used.
_____________
Other
Additional information
23 Describe the source(s) of funding and non-monetary support for the study, and the role of the funder(s) in its design, conduct and report. Report any conflicts of interest surrounding the roles of authors and funders.
advances in the field. Potential methodological advances that might be reflected in an update might include shifts towards more complex model specifications, better methods for dealing with uncertainty, and guidance on ap-propriate use of measures of prediction accuracy, such as mean absolute error (MAE) and mean square error (MSE). The MAPS working group plans to assess the need for an update of the reporting checklist in five years’time.
In conclusion, this paper summarises a new reporting statement developed for studies that map onto generic preference-based outcome measures. We encourage health economic and quality of life journals to endorse MAPS, promote its use in peer review and update their editorial requirements and ‘Instructions to Authors’ accordingly.
Acknowledgments
We are grateful to the following individuals, who consented to being acknowledged publicly, for their comments and participation in the Delphi Panel: Roisin Adams, Roberta Ara, Nick Bansback, Garry Barton, Andy Briggs, Chris Carswell, Gang Chen, Doug Coyle, Ralph Crott, Richard Edlin, Alastair Fischer, Juan Manuel Ramos-Goñi, Ola Ghatnekar, Patrick Gillard, Ning Yan Gu, Annie Hawton, Haomiao Jia, Kamran Khan, Billingsley Kaambwa, Nick Kontodimopoulos, Quang Le, Jason Madan, Katherine MacGilchrist, David Meads, Duncan Mortimer, Bhash Naidoo, Angus Ng, Nalin Payakachat, Simon Pickard, Rafael Pinedo-Villanueva, Eleanor Pullenayegum, Jeff Richardson, Janet Robertson, Jeff Round, Donna Rowen, Sean Rundell, Paulos Teckle, Matthijs Versteegh, Feng Xie, and Tracey Young.
Compliance with ethical standards
No external funding was received for this study. All members of the working group acted on a voluntary basis.
RF is a shareholder and a director of a company (Clinvivo Limited) that provides services for Delphi studies. However, these services were not used in this study and thus notwithstanding the connection RF declares that he has no conflicts of interest. The remaining authors (SP, ORA, HD, LL, MO, AG) have no conflicts of interest to declare. All authors contributed to the study design and conduct, interpretation of results and report writing. SP acts as the guarantor.
Author details 1
Warwick Clinical Trials Unit, Warwick Medical School, University of Warwick, Coventry CV4 7AL, UK.2National Perinatal Epidemiology Unit, Nuffield Department of Population Health, University of Oxford, Oxford, UK.3Health Economics Research Centre, Nuffield Department of Population Health, University of Oxford, Oxford, UK.4Health Economics Research Group, Brunel University London, Uxbridge, UK.5EuroQol Research Foundation, Rotterdam, The Netherlands.6Norges Helsehøyskole, Campus Kristiania, Oslo, Norway.
Received: 15 July 2015 Accepted: 15 July 2015
References
1. Brazier JE, Yang Y, Tsuchiya A, Rowen DL. A review of studies mapping (or cross walking) non-preference based measures of health to generic preference-based measures. Eur J Health Econ. 2010;11(2):215–25. doi:10.1007/s10198-009-0168-z. 1425919854.
2. Dakin H. Review of studies mapping from quality of life or clinical measures to EQ-5D: an online database. Health Qual Life Outcomes. 2013;11:151. doi:10.1186/1477-7525-11-151. 1425925341.
3. Chuang LH, Whitehead SJ. Mapping for economic evaluation. Br Med Bull. 2012;101:1–15. doi:10.1093/bmb/ldr049. 1427393724.
4. Longworth L, Rowen D. NICE DSU Technical Support Document 10: The Use of Mapping Methods to Estimate Health State Utility Values. Sheffield, UK: Decision Support Unit, ScHARR, University of Sheffield; 2011.
5. Moher D, Schulz KF, Simera I, Altman DG. Guidance for developers of health research reporting guidelines. PLoS Med. 2010;7(2), e1000217. doi:10.1371/ journal.pmed.1000217. 1425988566.
6. Moher D, Simera I, Schulz KF, Hoey J, Altman DG. Helping editors, peer reviewers and authors improve the clarity, completeness and transparency of reporting health research. BMC Med. 2008;6:13. doi:10.1186/1741-7015-6-13. 1425989043.
7. Narahari SR, Ryan TJ, Aggithaya MG, Bose KS, Prasanna KS. Evidence-based approaches for the Ayurvedic traditional herbal formulations: toward an Ayurvedic CONSORT model. J Altern Complement Med. 2008;14(6):769–76. doi:10.1089/acm.2007.0818. 1425997359.
8. Mortimer D, Segal L, Sturm J. Can we derive an 'exchange rate' between descriptive and preference-based outcome measures for stroke? Results from the transfer to utility (TTU) technique. Health Qual Life Outcomes. 2009;7:33. doi:10.1186/1477-7525-7-33. 1426002631.
9. Bossuyt PM, Reitsma JB, Bruns DE, Gatsonis CA, Glasziou PP, Irwig LM et al. The STARD statement for reporting studies of diagnostic accuracy: explanation and elaboration. Ann Intern Med. 2003;138(1):W1-12. 1426070562.
10. Tong A, Sainsbury P, Craig J. Consolidated criteria for reporting qualitative research (COREQ): a 32-item checklist for interviews and focus groups. Int J Qual Health Care. 2007;19(6):349–57. doi:10.1093/intqhc/mzm042. 1426070607. 11. Vandenbroucke JP, von Elm E, Altman DG, Gotzsche PC, Mulrow CD, Pocock
SJ, et al. Strengthening the Reporting of Observational Studies in Epidemiology (STROBE): explanation and elaboration. PLoS Med. 2007;4(10), e297. doi:10.1371/journal.pmed.0040297. 1426070521.
12. Liberati A, Altman DG, Tetzlaff J, Mulrow C, Gotzsche PC, Ioannidis JP, et al. The PRISMA statement for reporting systematic reviews and meta-analyses of studies that evaluate health care interventions: explanation and elaboration. J Clin Epidemiol. 2009;62(10):e1–34. doi:10.1016/ j.jclinepi.2009.06.006. 1426070400.
13. Moher D, Hopewell S, Schulz KF, Montori V, Gotzsche PC, Devereaux PJ, et al. CONSORT 2010 explanation and elaboration: updated guidelines for reporting parallel group randomised trials. BMJ. 2010;340:c869. doi:10.1136/ bmj.c869. 1426070468.
14. Husereau D, Drummond M, Petrou S, Carswell C, Moher D, Greenberg D, et al. Consolidated Health Economic Evaluation Reporting Standards (CHEERS)–explanation and elaboration: a report of the ISPOR Health Economic Evaluation Publication Guidelines Good Reporting Practices Task Force. Value Health. 2013;16(2):231–50. doi:10.1016/j.jval.2013.02.002. 1426070220.
15. Fitch K, Bernstein S, Aguilar M, Burnand B, LaCalle J, Lazaro P, et al. The RAND/UCLA Appropriateness Method User’s Manual. Santa Monica; 2001. 16. Petrou S, Rivero-Arias O, Dakin H, Longworth L, Oppe M, Froud R, et al.
The MAPS reporting statement for studies mapping onto generic preference-based outcome measures: Explanation and elaboration. PharmacoEconomics, in press. 1428428637. http://dx.doi.org/10.1007/ s40273-015-0312-9
17. Brazier J, Roberts J, Deverill M. The estimation of a preference-based measure of health from the SF-36. J Health Econ. 2002;21(2):271–92. 1426244550. 18. Feeny D, Furlong W, Boyle M, Torrance GW. Multi-attribute health status
classification systems. Health Utilities Index. Pharmacoeconomics. 1995;7(6):490–502. 1426244646.
19. Yang Y, Wong MY, Lam CL, Wong CK. Improving the mapping of condition-specific health-related quality of life onto SF-6D score. Qual Life Res. 2014;23(8):2343–53. doi:10.1007/s11136-014-0668-x. 1426244912. 20. Lee L, Kaneva P, Latimer E, Feldman LS. Mapping the Gastrointestinal
Quality of Life Index to short-form 6D utility scores. J Surg Res. 2014;186(1):135–41. doi:10.1016/j.jss.2013.08.006. 1426244970.
21. Roset M, Badia X, Forsythe A, Webb SM. Mapping CushingQoL scores onto SF-6D utility values in patients with Cushing's syndrome. Patient. 2013;6(2):103–11. doi:10.1007/s40271-013-0010-7. 1426245033.
22. Payakachat N, Tilford JM, Kuhlthau KA, van Exel NJ, Kovacs E, Bellando J, et al. Predicting health utilities for children with autism spectrum disorders. Autism Res. 2014;7(6):649–63. doi:10.1002/aur.1409. 1426245111.
23. Goldfeld KS, Hamel MB, Mitchell SL. Mapping health status measures to a utility measure in a study of nursing home residents with advanced dementia. Med Care. 2012;50(5):446–51. doi:10.1097/MLR.0b013e3182407e0d. 1426245177. 24. Chen G, McKie J, Khan MA, Richardson JR. Deriving health utilities from the
25. Moher D, Jones A, Lepage L, Group C. Use of the CONSORT statement and quality of reports of randomized trials: a comparative before-and-after evaluation. JAMA. 2001;285(15):1992–5. 1426256489.
26. Delaney A, Bagshaw SM, Ferland A, Manns B, Laupland KB, Doig CJ. A systematic evaluation of the quality of meta-analyses in the critical care literature. Crit Care. 2005;9(5):R575–82. doi:10.1186/cc3803. 1426256559. 27. Plint AC, Moher D, Morrison A, Schulz K, Altman DG, Hill C et al. Does the
CONSORT checklist improve the quality of reports of randomised controlled trials? A systematic review. Med J Aust. 2006;185(5):263–7. 1426256647.
Submit your next manuscript to BioMed Central and take full advantage of:
• Convenient online submission
• Thorough peer review
• No space constraints or color figure charges
• Immediate publication on acceptance
• Inclusion in PubMed, CAS, Scopus and Google Scholar
• Research which is freely available for redistribution