R E S E A R C H
Open Access
The associations of leg lean mass with foot pain,
posture and function in the Framingham foot
study
Robert R McLean
1,2*, Alyssa B Dufour
1,2, Patricia P Katz
3, Howard J Hillstrom
4, Thomas J Hagedorn
1and Marian T Hannan
1,2Abstract
Background:Foot disorders are common in older adults and associated with impaired lower extremity function. Reduced muscle mass may play a role in the etiology of foot disorders and consequent poor function.
Methods:We examined the association of leg lean mass with foot pain, posture and function among 1,795 individuals (mean age 67 years) from the population-based Framingham Foot Study (2002–2008). Pain was assessed via questionnaire, and a pressure mat classified foot posture (arch: high, low, referent) during standing and function (pronation, supination, referent) during gait. Leg lean mass was measured by whole body dual energy x-ray absorptiometry.
Results:In age- and body mass index-adjusted logistic (pain) and multinomial logistic (posture, function) regression models, a 1-standard deviation increase in leg lean mass was associated with lower odds of foot pain (OR = 0.76, 95% CI: 0.68, 0.86) and pronation (OR = 0.76, 95% CI: 0.67, 0.85), and higher odds of supination (OR = 1.17, 95% CI: 1.04, 1.31). Adjustment for sex attenuated these associations. Higher leg lean mass was associated with lower odds of high arch, even after adjustment for sex (OR = 0.73, 95% CI: 0.60, 0.89).
Conclusions:Though not related to foot pain or function, reduced leg lean mass was associated with extreme foot posture in older adults. Loss of muscle mass with aging may thus play a role in the etiology of functional
impairment due to foot disorders.
Keywords:Lean mass, Foot pain, Foot structure, Foot function, Population-based cohort
Background
Foot pain is commonly reported in the general population, affecting approximately 1 out of every 5 older adults [1]. There is growing evidence that foot pain is associated with impaired lower extremity function [2,3], balance and gait disorders [4,5], mobility disability [6,7], and falls [8-10]. Despite these observed associations, the mechanistic path-ways linking foot pain with poor function and disability have not been fully elucidated. Identifying components of this pathway is important for developing targeted inter-ventions to reduce disability resulting from foot pain.
Following the fourth decade of life, muscle mass de-creases with aging, resulting in loss of muscle strength and function [11], which are associated with lower ex-tremity functional impairment and disability in older adults [12,13]. Studies of clinical populations suggest that poor lower extremity muscle function is associated with atypical foot posture and function. Patients with posterior tibial tendon dysfunction, a common acquired flatfoot deformity, have lower ankle and hip muscle strength compared to non-patients [14], and the degree of deformity is inversely related to leg muscle strength [15]. Imbalance of the muscles that control the foot, but originate in the lower leg has been implicated in the eti-ology of both idiopathic and disease-related pes cavus (high arches) [16-18]. Further, evidence from studies of runners suggests that weakness in lower leg [19] and * Correspondence:[email protected]
1
Hebrew Senior Life Institute for Aging Research, Boston, MA, USA 2Harvard Medical School, Boston, MA, USA
Full list of author information is available at the end of the article
hip-stabilizing muscles [20] can lead to disturbed lower extremity mechanics, resulting in over-pronation of the foot. Such atypical foot posture and foot function have been associated with foot pain in population-based stud-ies [21-23].
It would be of clinical interest to identify age-related loss of muscle mass as a mechanism for foot pain and consequent disability in the general population since muscle mass and function can be improved with exercise [24], and may thus be targeted for treating or preventing foot pain. Yet data linking muscle mass with foot disor-ders in community-based studies are limited. We are aware of only one prior study that found no association between total body skeletal muscle mass and foot pain [25], and none that have examined foot posture or func-tion. Thus, the relation of muscle mass with foot pain, posture and function in the general population is unknown.
The purpose of this investigation was to evaluate the relation of leg lean mass with foot pain, posture and function in a population-based study of older men and women. We hypothesized that lower leg lean mass would be associated with greater risk for foot pain, pla-nus (flat) and cavus (high) foot posture, and supinated and pronated foot function.
Methods Participants
Participants in this study included members of the Fra-mingham Foot Study, an ancillary study derived from the Framingham Study Original and Offspring cohorts. The Framingham Study was begun in 1948 with the ob-jective of investigating risk factors for heart disease. The Original cohort enrolled 5,209 men and women, aged 28 to 62 years, who were recruited from a two-thirds sample of all residences of the town of Framingham, Massachusetts and have since been examined every two years [26]. The Offspring cohort was initiated in 1971 to determine familial risk factors for cardiovascular disease, enrolling 5,124 male and female adult children, and their spouses, of the Original cohort [27]. The age of Off-spring participants ranged from 5 to 70 years at enroll-ment, and they have been examined approximately every four years. Between 2002 and 2008, 2,447 cohort mem-bers (266 Original, 2,181 Offspring) participated in the Framingham Foot Study, during which they were quer-ied regarding foot pain and completed a plantar pressure and loading assessment during standing and walking. The current analysis includes the 1,795 participants (776 men, 1,019 women) who had information on leg lean mass that was obtained as part of the Framingham Osteoporosis Study in 1992–93 (Original) and in 1996–2001 (Off-spring). The institutional review boards at Hebrew Senior-Life and Boston University approved the study, and all
participants signed an informed consent form prior to study enrolment.
Foot pain
Foot pain was assessed using the following National Health and Nutrition Examination Survey-based query about foot pain:“On most days, do you have pain, aching, or stiffness in either of your feet?”Possible responses were no; yes, left foot only; yes, right foot only; yes, both feet; yes, not sure what side; and unknown. Responses were collapsed into 2 groups: yes, pain in one or both feet; or no, no pain in either foot.
Foot posture and function
A Tekscan Matscan (Tekscan Inc., Boston, Massachusetts) pressure mat was used to collect plantar pressure data at 40 Hz during walking and during a single frame snap-shot of bipedal quiet stance. Walking data were col-lected using the two-step method, a method in which participants strike the mat with their second foot, that has been shown to be as reliable as mid-gait techniques [28]. One walking scan was collected on each foot, in addition to a scan of both feet in quiet, bipedal, weight bearing stance.
Foot posture
Foot posture was defined using the Modified Arch Index (MAI) calculated on each foot using the quiet stance scans. To determine the MAI value, the foot, excluding the toes, is divided into three equal parts, and the total force in the middle third is divided by the total force in all three foot regions, as previously described [23]. MAI is correlated with other measures of foot posture, not-ably navicular height [29]. As each participant had two MAI values (right and left), the value farthest from the median was chosen to be used in the analysis, similar to prior studies of bilateral conditions [30,31]. Participants’ foot posture was classified based on quintile cut-points from the distribution of MAI values from all Framing-ham Foot Study participants (3,100 participants yielding 6,153 feet; age range 36–100 years), including those not included in the current analysis [32,33]. MAI > 0.163 (highest quintile) was classified planus (low arch), MAI from 0.031 to 0.163 (middle three quintiles) was classified rectus (referent), and MAI < 0.031 was classified cavus (high arch). Rectus was considered the referent group.
Foot function
pressure curve at the distal third of the foot from the constructed line is recorded, as previously described [35]. This value is normalized by foot width and multi-plied by 100 to obtain a percentage excursion of the cen-ter of pressure. CPEI has been shown to be sensitive to changes in clinical measures of static foot alignment [34]. Similar to the method used for MAI, CPEI was cat-egorized into three groups: CPEI > 20.9 (highest quintile) was classified as supination, CPEI from 7.4 to 20.9 (mid-dle three quintiles) was classified as the referent group and CPEI < 7.4 was classified as pronation.
Dual-energy x-ray absorptiometry
Body composition measures were obtained from whole body dual-energy x-ray absorptiometry (DXA) scans ascertained using a Lunar DPX-L (LunarCorp, Madison, Wisconsin), as previously described [36]. The “legs” re-gion of interest includes the entire lower extremities below the pelvis. Because muscle mass is strongly corre-lated with body height, relative leg lean mass was calcu-lated as the lean mass of the legs region in kilograms from the DXA scan, divided by the square of body height recorded at the time of the DXA scan (kg/m2) [37].
Other variables
Information on age (years), height and weight was re-corded at the time of the Framingham Foot Study exam. Weight was measured using a standardized balance beam scale and recorded to the nearest half pound. Height without shoes was measured to the nearest ¼ inch using a calibrated stadiometer. Body mass index (BMI) was calculated as a participant’s weight in kilo-grams divided by their height in meters squared (kg/m2).
Statistical analysis
Means and standard deviations of continuous variables, and frequencies of categorical variables, were calculated for all participant characteristics. T-tests and chi-square tests were used to compare continuous and categorical variables, respectively, between men and women. To de-termine the association between leg lean mass and foot pain (yes/no), logistic regression calculated the odds ra-tio (OR) and 95% confidence interval (CI) for the likeli-hood of reporting foot pain associated with a one standard deviation increase in leg lean mass. For the as-sociation of leg lean mass with foot posture, multinomial logistic regression analysis calculated the OR and 95% CI for planus and cavus MAI, relative to the referent, for a one standard deviation increase in leg lean mass. A similar multinomial analysis was used to determine the association of leg lean mass with foot function (OR for pronatory and supinatory versus the referent). Regres-sion models were first unadjusted for covariates, followed
by adjustment for age, and for BMI to account for adipos-ity, which is associated both with lean mass [38] and with foot pain [39]. Models were further adjusted for sex, and sex-specific models were examined to evaluate whether sex modified the association between leg lean mass and foot pain, posture and function. Because the associations between leg lean mass and foot pain, posture and function may not be linear, quartiles of leg lean mass were created and regression analyses were repeated to determine the likelihood of foot pain, posture and function in the lowest quartile of leg lean mass relative to the upper three quar-tiles combined. Results from analyses of quarquar-tiles of leg lean mass were similar, thus only results of analyses with leg lean mass as a continuous variable are reported.
The time between lean mass measurement and the sub-sequent foot assessment ranged from 1.5 to 11.0 years among study participants, with an average of 6.7 years. Thus it is possible that interim loss of muscle mass due to aging could impact our estimates of the associations of lean mass with foot pain, posture and function. To explore whether age-associated changes in lean mass may have in-fluenced our results, we repeated our analyses using lean mass values adjusted to estimate each participants lean mass at the time of the foot assessment, based on the time between their lean mass and foot assessments and reports in the literature that muscle mass declines at a rate of ap-proximately 1% per year after age 50 [40,41].
Statistical analyses were conducted using the SAS stat-istical analysis package, version 9.3 (SAS Institute, Cary, NC). Level of statistical significance for P values (two-sided) was 0.05.
Results
Participant characteristics are listed in Table 1. Mean age of men and women was 68 years and 67 years, re-spectively. Compared to women, men had higher BMI (28.6 kg/m2 vs. 27.6 kg/m2, P< 0.0001) and greater height-adjusted leg lean mass [5.75 kg/m2(SD = 0.59) vs. 4.52 kg/m2(SD = 0.47),P< 0.0001]. A higher proportion of women (25.1%) than men (16.6%) reported foot pain (P< 0.0001). The difference between men and women in the proportions of cavus (men 31.6%, women 29.0%) and planus (men 29.0%, women 24.3%) foot posture did not reach statistical significance, yet the difference in pro-portions of foot function did (P< 0.0001). Women had higher prevalence of pronation (men 21.5%, women 38.4%) and lower prevalence of supination (men 38.3%, women 23.2%) compared to men.
Foot pain
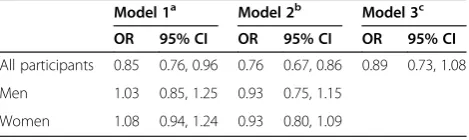
for age and BMI (OR = 0.76, 95% CI 0.67, 0.86) (Table 2). This association was, however, attenuated after add-itional adjustment for sex (OR = 0.89, 95% CI: 0.73, 1.08). Leg lean mass was not associated with foot pain in sex-specific analyses.
Foot posture
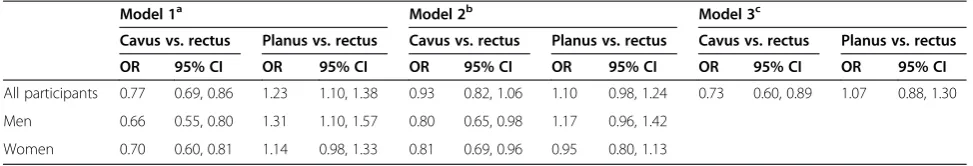
In the unadjusted model for all participants, a one stand-ard deviation increase in leg lean mass was associated with 23% lower odds of having high arch (OR = 0.77, 95% CI: 0.9, 0.86) and 23% greater odds of having low arch (OR = 1.23, 95% CI: 1.10, 1.38) compared to being in the referent group, but these associations were attenuated after adjustment for age and BMI (Table 3). Following fur-ther adjustment for sex, higher leg lean mass was associ-ated with 27% lower odds of having high arch versus being in the referent group (OR = 0.73, 95% CI 0.60, 0.89), but not with having low arch (OR = 1.07, 95% CI 0.88, 1.30). Similarly, in sex-specific models, a one standard de-viation increase in leg lean mass was associated with 30%
and 19% lower odds of having high arch in men and women, respectively, but not with having low arch (Table 3).
Foot function
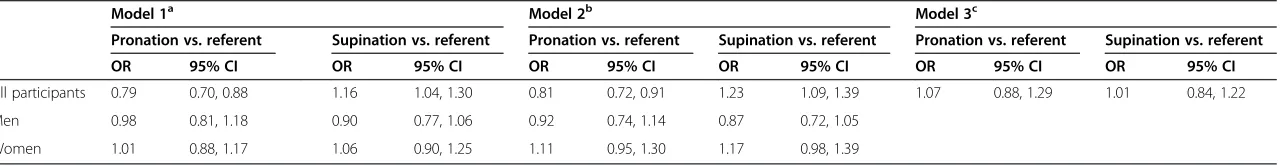
For all participants, a one standard deviation increase in leg lean mass was associated with 21% reduced odds of having pronation (OR = 0.79, 95% CI: 0.70, 0.88) and 16% greater odds of having supination (OR = 1.16, 95% CI: 1.04, 1.30), relative to the odds of being in the refer-ent foot function group, in unadjusted analyses (Table 4). Associations were similar after adjustment for age and BMI, but additional adjustment for sex attenuated the results. Among the men, leg lean mass was not associated with foot function. In women, a one standard deviation in-crease in leg lean mass was associated a modest inin-creased odds of both pronation (OR = 1.11, 95% CI: 0.95, 1.30) and supination (OR = 1.17, 95% CI: 0.98, 1.39), though confidence intervals included the null value.
The association of lean mass with foot pain, posture and function were similar after all analyses were re-peated using lean mass values adjusted for age-related loss of lean mass between the lean mass and foot assess-ments (data not shown).
Discussion
Among our population of older adults, we found that in the overall population higher leg lean mass was associated with lower odds of foot pain, lower odds of pronation, and higher odds of supination, but that these associations were completely explained by sex. Higher leg lean mass was, however, associated with lower odds of high (cavus) arch in the overall cohort after adjusting for sex, as well as in men and women separately. These findings suggest that Table 1 Characteristicsaof Framingham foot study participants, 2002–2008
All participants Men Women Pvalueb
N 1795 776 1,019
Age (years) 67.4 (10.2) 67.9 (10.1) 67.0 (10.2) 0.08
Body mass index (kg/m2) 28.1 (4.9) 28.6 (4.2) 27.6 (5.4) <0.0001
Leg lean mass (kg/m2) 5.05 (0.81) 5.75 (0.59) 4.52 (0.47) <0.0001
Foot pain (%) 21.5 16.6 25.1 <0.0001
Foot posture (%)
Cavus 30.5 29.0 31.6 0.07
Rectus 43.2 42.0 44.1
Planus 26.4 29.0 24.3
Foot function (%)
Pronation 31.1 21.5 38.4 <0.0001
Referent 39.2 40.2 38.5
Supination 29.7 38.3 23.2
a
Mean (SD) unless otherwise noted.
b
Pvalues for comparison between men and women.
Table 2 Odds ratios for the association between a 1-standard deviation increase in leg lean mass and foot pain among men and women in the Framingham foot study, 2002–2008
Model 1a Model 2b Model 3c
OR 95% CI OR 95% CI OR 95% CI
All participants 0.85 0.76, 0.96 0.76 0.67, 0.86 0.89 0.73, 1.08
Men 1.03 0.85, 1.25 0.93 0.75, 1.15
Women 1.08 0.94, 1.24 0.93 0.80, 1.09
Abbreviations:CIconfidence interval,ORodds ratio.
a
Unadjusted.
b
Adjusted for age, body mass index.
c
low muscle mass may be associated with high arch foot posture in the general community of older adults.
We are unaware of any previous reports from popu-lation-based studies of an association between lean mass and foot posture, yet investigations in clinical popula-tions suggest that lower extremity muscle characteristics are determinants of pes cavus. Patients with Charcot-Marie-Tooth disease, an inherited neurological disorder primarily affecting the peripheral nerves in the lower ex-tremities, frequently exhibit pes cavus resulting from weakness in the peroneus brevis and tibialis anterior muscles relative to their natural antagonist tibialis pos-terior and peroneus longus muscles, respectively [17,18]. Similar imbalances in the peroneal and anterior compart-ments of the leg muscles have been shown to contribute to cases of pes cavus associated with other pathologies [16]. Additionally, young adults with pes planus demon-strated different sizes and thicknesses of the intrinsic and extrinsic muscles of the foot on ultrasound compared with normal controls [42]. We found that greater overall mus-cle mass in the legs was associated with lower odds of pes cavus. DXA lean mass is, however, unable to assess spe-cific muscles in the leg, thus we are unable to determine if it is an imbalance in antagonist pairs, rather than general decreased muscle mass, which was associated with pes cavus in our study population.
While our results suggest an association between leg lean mass and foot posture, we did not observe an asso-ciation with foot function. This was not unexpected, as the path of the center of pressure through the foot when walking (measured with the CPEI) represents the sum-mation of several dynamic proximal influences. In particu-lar, variation in the pattern of lumbo-pelvic and thigh muscle activity when walking has been shown to influence foot function and predisposition to foot and ankle injury [43-45], however these variations cannot be evaluated by DXA measure of lean leg mass.
The lack of an association between leg lean mass and foot pain in our study is in agreement with the only other prior study, that we are aware of, to examine muscle mass
in relation to foot pain. In a group of 136 adults aged 25– 62 years recruited from the community, total skeletal muscle mass was similar between those who did and did not report foot pain, even prior to adjustment for sex [25]. These findings may be difficult to compare to our results as our study population included a relatively large number of older adults. Conversely, in another community-based study of 312 adults aged 60 years and older, participants reporting foot pain had lower ankle dorsiflexion strength than those who did not report pain [6]. The conflict be-tween this prior finding and our current observation may reflect the limitations of lean mass as a measure of muscle status. While lean mass is a highly precise and objective estimate of muscle mass, it is often not an accurate surro-gate for muscle strength, particularly among older adults. Although muscle mass is an important determinant of muscle strength [46], the decrease in strength with aging occurs at an accelerated rate compared to the concomi-tant decrease in mass [41,47]. This uncoupling is due to other age-related changes in muscle, including fat infiltra-tion into muscle tissue [48,49] and denervainfiltra-tion of muscle fibers [50]. Direct measures of muscle strength may pro-vide a more accurate assessment of the relation of muscle to foot problems.
Our finding that sex confounded the relations of lean mass with foot pain and function is not wholly unex-pected. It is well recognized that women tend to have less lean mass compared to men [51], and prior studies have indicated that women have higher rates of foot pain and extremes in foot posture and function [7,52,53]. Nevertheless, the results from our lone study should not be interpreted as conclusive evidence that lean mass is not associated with foot pain or function.
It is also important to interpret our findings in light of other limitations of our study. First, we were unable to establish a causal relation between lean mass and foot problems because our study was cross-sectional and could not determine whether loss of lean mass preceded foot pain, posture or function, or vice versa. For ex-ample, it may be that lower leg lean mass and weakness Table 3 Odds ratios for the association between a 1-standard deviation increase in leg lean mass and cavus (High) or Planus (Low) Foot arch (Compared with rectus (Referent) arch), among men and women in the Framingham foot study, 2002–2008
Model 1a Model 2b Model 3c
Cavus vs. rectus Planus vs. rectus Cavus vs. rectus Planus vs. rectus Cavus vs. rectus Planus vs. rectus
OR 95% CI OR 95% CI OR 95% CI OR 95% CI OR 95% CI OR 95% CI
All participants 0.77 0.69, 0.86 1.23 1.10, 1.38 0.93 0.82, 1.06 1.10 0.98, 1.24 0.73 0.60, 0.89 1.07 0.88, 1.30
Men 0.66 0.55, 0.80 1.31 1.10, 1.57 0.80 0.65, 0.98 1.17 0.96, 1.42
Women 0.70 0.60, 0.81 1.14 0.98, 1.33 0.81 0.69, 0.96 0.95 0.80, 1.13
Abbreviations:CIconfidence interval,ORodds ratio.
a
Unadjusted.
b
Adjusted for age, body mass index.
c
Table 4 Odds ratios for the association between a 1-standard deviation increase in leg lean mass and pronation or supination (Compared with referent), among men and women in the Framingham foot study, 2002–2008
Model 1a Model 2b Model 3c
Pronation vs. referent Supination vs. referent Pronation vs. referent Supination vs. referent Pronation vs. referent Supination vs. referent
OR 95% CI OR 95% CI OR 95% CI OR 95% CI OR 95% CI OR 95% CI
All participants 0.79 0.70, 0.88 1.16 1.04, 1.30 0.81 0.72, 0.91 1.23 1.09, 1.39 1.07 0.88, 1.29 1.01 0.84, 1.22
Men 0.98 0.81, 1.18 0.90 0.77, 1.06 0.92 0.74, 1.14 0.87 0.72, 1.05
Women 1.01 0.88, 1.17 1.06 0.90, 1.25 1.11 0.95, 1.30 1.17 0.98, 1.39
Abbreviations:CIconfidence interval,ORodds ratio.
a
Unadjusted.
b
Adjusted for age, body mass index.
c
Adjusted for age, body mass index, sex.
al.
Journal
of
Foot
and
Ankle
Research
2014,
7
:46
Page
6
o
f
8
es.com/con
are a consequence of the smaller range of motion associ-ated with pes cavus [54]. Second, the time difference be-tween our lean mass assessment and foot exam must be acknowledged. Although we repeated all analyses after adjusting lean mass measures for age-related loss of lean mass, we assumed a constant rate of loss over time that was identical across all individuals. It is possible that partic-ipants with foot problems may have been less active, which could contribute to an accelerated loss of muscle mass in this group. Thus, we may have underestimated lean mass in those with foot problems, potentially masking any asso-ciations in our cohort. Third, since the “legs” region of whole body DXA scans is composed of lean mass of the entire lower extremities, we were unable to separate the lean mass of individual legs to examine leg-specific associa-tions, and we could not specifically measure musculature of the foot. Although foot muscle impairments may be more directly related to foot posture and function, there is evidence to suggest involvement of leg muscles as well [14,17-20]. Fourth, our measures of foot posture and func-tion may have larger measurement error relative to other studies since only one scan was ascertained per participant due to time constraints. Thus, our sex-specific odds ratios may be biased toward null associations and may partially account for the absence of associations of lean mass with foot pain and function. Finally, our study included only Caucasians, limiting the generalizability of our results.
Despite the above limitations, our investigation has im-portant strengths. This was, to our knowledge, the largest population-based study of lean mass and foot pain, pos-ture and function. Our cohort included both men and women, across a wide age range of older adults, from the well-characterized Framingham Study. Additionally, our measures of both foot posture and foot function were ob-jectively ascertained using a pressure mat, as opposed to subjective clinical observation.
Conclusions
In conclusion, our findings suggest that while muscle mass is not associated with foot pain or function in older adults, reduced muscle mass may contribute to extreme foot pos-ture in older adults, perhaps playing a role in the etiology of physical limitations and disability due to foot disorders. Muscle mass and strength are potentially modifiable and could be considered as targets for intervention to prevent or improve foot problems and consequent physical impair-ments. Prospective studies that can evaluate the mass and strength of the muscles specific to foot posture and func-tion are needed to gain a better understanding of the eti-ology of foot problems and the associated consequences.
Abbreviations
BMI:Body mass index; CI: Confidence interval; CPEI: Center of pressure excursion index; DXA: Dual-energy x-ray absorptiometry; MAI: Modified arch index; OR: Odds ratio.
Competing interests
The authors declare that they have no competing interests.
Authors’contributions
MTH, HJH conceptualized and designed the study. RRM, TJH conducted literature review. ABD conducted all data analyses. RRM, ABD, PPK, TJH, HJH, MTH interpreted the data. RRM drafted the manuscript. THJ assisted in preparing the Methods section of the text. ABD, PPK, HJH, THJ, MTH critically reviewed the manuscript. All authors have reviewed and approved the final version of the manuscript as submitted.
Acknowledgments
Research reported in this publication was supported by the National Institute of Arthritis and Musculoskeletal and Skin Diseases and the National Institute on Aging award numbers R01 AR047853 and R01 AR/AG41398, and by the National Heart, Lung and Blood Institute's Framingham Heart Study (N01 HC25195). The content is solely the responsibility of the authors and does not necessarily represent the official views of the National Institutes of Health.
We gratefully acknowledge Professor Hylton B. Menz (La Trobe University, Bundoora, Victoria, Australia) for his helpful feedback and suggestions on the final version of the manuscript.
Author details
1Hebrew Senior Life Institute for Aging Research, Boston, MA, USA.2Harvard Medical School, Boston, MA, USA.3University of California, San Francisco, San Francisco, CA, USA.4Hospital for Special Surgery, New York, NY, USA.
Received: 1 May 2014 Accepted: 24 October 2014
References
1. Thomas MJ, Roddy E, Zhang W, Menz HB, Hannan MT, Peat GM:The population prevalence of foot and ankle pain in middle and old age: a systematic review.Pain2011,152:2870–2880.
2. Menz HB, Lord SR:Foot problems, functional impairment, and falls in older people.J Am Podiatr Med Assoc1999,89:458–467.
3. Menz HB, Lord SR:The contribution of foot problems to mobility impairment and falls in community-dwelling older people.J Am Geriatr Soc2001,49:1651–1656.
4. Menz HB, Morris ME, Lord SR:Foot and ankle characteristics associated with impaired balance and functional ability in older people.J Gerontol A Biol Sci Med Sci2005,60:1546–1552.
5. Menz HB, Lord SR:Foot pain impairs balance and functional ability in community-dwelling older people.J Am Podiatr Med Assoc2001, 91:222–229.
6. Mickle KJ, Munro BJ, Lord SR, Menz HB, Steele JR:Cross-sectional analysis of foot function, functional ability, and health-related quality of life in older people with disabling foot pain.Arthritis Care Res (Hoboken)2011, 63:1592–1598.
7. Benvenuti F, Ferrucci L, Guralnik JM, Gangemi S, Baroni A:Foot pain and disability in older persons: an epidemiologic survey.J Am Geriatr Soc 1995,43:479–484.
8. Chaiwanichsiri D, Janchai S, Tantisiriwat N:Foot disorders and falls in older persons.Gerontology2009,55:296–302.
9. Mickle KJ, Munro BJ, Lord SR, Menz HB, Steele JR:Foot pain, plantar pressures, and falls in older people: a prospective study.J Am Geriatr Soc2010,58:1936–1940.
10. Tinetti ME, Speechley M, Ginter SF:Risk factors for falls among elderly persons living in the community.N Engl J Med1988,319:1701–1707. 11. Metter EJ, Conwit R, Tobin J, Fozard JL:Age-associated loss of power and
strength in the upper extremities in women and men.J Gerontol A Biol Sci Med Sci1997,52:B267–B276.
12. Dufour AB, Hannan MT, Murabito JM, Kiel DP, McLean RR:Sarcopenia definitions considering body size and fat mass are associated with mobility limitations: the Framingham study.J Gerontol A Biol Sci Med Sci 2013,68:168–174.
14. Kulig K, Popovich JM, Noceti-Dewit LM, Reischl SF, Kim D:Women with posterior tibial tendon dysfunction have diminished ankle and hip muscle performance.J Orthop Sports Phys Ther2011,41:687–694. 15. Neville C, Flemister AS, Houck JR:Deep posterior compartment strength
and foot kinematics in subjects with stage II posterior tibial tendon dysfunction.Foot Ankle Int2010,31:320–328.
16. Tynan MC, Klenerman L, Helliwell TR, Edwards RH, Hayward M: Investigation of muscle imbalance in the leg in symptomatic forefoot pes cavus: a multidisciplinary study.Foot Ankle1992,13:489–501. 17. Mann RA, Missirian J:Pathophysiology of Charcot-Marie-tooth disease.
Clin Orthop Relat Res1988,234:221–228.
18. Holmes JR, Hansen ST Jr:Foot and ankle manifestations of Charcot-Marie-tooth disease.Foot Ankle1993,14:476–486.
19. Hintermann B, Nigg BM:Pronation in runners. Implications for injuries. Sports Med1998,26:169–176.
20. Ferber R, Hreljac A, Kendall KD:Suspected mechanisms in the cause of overuse running injuries: a clinical review.Sports Health2009,1:242–246. 21. Molgaard C, Lundbye-Christensen S, Simonsen O:High prevalence of foot problems in the Danish population: a survey of causes and associations. Foot (Edinb)2010,20:7–11.
22. Menz HB, Tiedemann A, Kwan MM, Plumb K, Lord SR:Foot pain in community-dwelling older people: an evaluation of the Manchester foot pain and disability index.Rheumatology (Oxford)2006,45:863–867. 23. Riskowski J, Dufour A, Hagedorn T, Hillstrom H, Casey V, Hannan M:
Associations of foot posture and function to lower extremity pain: the Framingham foot study.Arthritis Care Res (Hoboken). In press. 24. Fiatarone MA, O'Neill EF, Ryan ND, Clements KM, Solares GR, Nelson ME,
Roberts SB, Kehayias JJ, Lipsitz LA, Evans WJ:Exercise training and nutritional supplementation for physical frailty in very elderly people. N Engl J Med1994,330:1769–1775.
25. Tanamas SK, Wluka AE, Berry P, Menz HB, Strauss BJ, Davies-Tuck M, Proietto J, Dixon JB, Jones G, Cicuttini FM:Relationship between obesity and foot pain and its association with fat mass, fat distribution, and muscle mass. Arthritis Care Res (Hoboken)2012,64:262–268.
26. Dawber TR, Meadors GF, Moore FEJ:Epidemiological approaches to heart disease: the Framingham Study.Am J Public Health1951,41:279–286. 27. Kannel WB, Feinleib M, McNamara PM, Garrison RJ, Castelli WP:An
investigation of coronary heart disease in families. The Framingham offspring study.Am J Epidemiol1979,110:281–290.
28. McPoil TG, Cornwall MW, Dupuis L, Cornwell M:Variability of plantar pressure data. A comparison of the two-step and midgait methods. J Am Podiatr Med Assoc1999,89:495–501.
29. Shiang TY, Lee SH, Lee SJ, Chu WC:Evaluating different footprints parameters as a predictor of arch height.IEEE Eng Med Biol Mag1998, 17:62–66.
30. Crosbie J, Burns J:Are in-shoe pressure characteristics in symptomatic idiopathic pes cavus related to the location of foot pain?Gait Posture 2008,27:16–22.
31. Robbins SM, Birmingham TB, Callaghan JP, Jones GR, Chesworth BM, Maly MR:Association of pain with frequency and magnitude of knee loading in knee osteoarthritis.Arthritis Care Res (Hoboken)2011,63:991–997. 32. Riskowski JL, Dufour AB, Hagedorn TJ, Hillstrom HJ, Casey VA, Hannan MT:
Associations of foot posture and function to lower extremity pain: results from a population-based foot study.Arthritis Care Res (Hoboken) 2013,65:1804–1812.
33. Dufour AB, Casey VA, Golightly YM, Hannan MT:Characteristics associated with Hallux Valgus in a population-based study of older adults: the Framingham foot study.Arthritis Care Res (Hoboken)2014, doi: 10.1002/ acr.22391. [Epub ahead of print].
34. Song J, Hillstrom HJ, Secord D, Levitt J:Foot type biomechanics. comparison of planus and rectus foot types.J Am Podiatr Med Assoc1996,86:16–23. 35. Hagedorn TJ, Dufour AB, Golightly YM, Riskowski JL, Hillstrom HJ, Casey VA,
Hannan MT:Factors affecting center of pressure in older adults: the Framingham foot study.J Foot Ankle Res2013,6:18.
36. Visser M, Harris TB, Langlois J, Hannan MT, Roubenoff R, Felson DT, Wilson PW, Kiel DP:Body fat and skeletal muscle mass in relation to physical disability in very old men and women of the Framingham heart study. J Gerontol A Biol Sci Med Sci1998,53:M214–M221.
37. Baumgartner RN, Koehler KM, Gallagher D, Romero L, Heymsfield SB, Ross RR, Garry PJ, Lindeman RD:Epidemiology of sarcopenia among the elderly in New Mexico.Am J Epidemiol1998,147:755–763.
38. Newman AB, Kupelian V, Visser M, Simonsick E, Goodpaster B, Nevitt M, Kritchevsky SB, Tylavsky FA, Rubin SM, Harris TB:Sarcopenia: alternative definitions and associations with lower extremity function.J Am Geriatr Soc2003,51:1602–1609.
39. Gay A, Culliford D, Leyland K, Arden NK, Bowen CJ:
Associations between body mass index and foot joint pain in middle-aged and older women: a longitudinal population-based cohort study. Arthritis Care Res (Hoboken)2014, doi:10.1002/acr.22408 [Epub ahead of print]
40. Hughes VA, Frontera WR, Roubenoff R, Evans WJ, Singh MA:Longitudinal changes in body composition in older men and women: role of body weight change and physical activity.Am J Clin Nutr2002,76:473–481. 41. Goodpaster BH, Park SW, Harris TB, Kritchevsky SB, Nevitt M, Schwartz AV,
Simonsick EM, Tylavsky FA, Visser M, Newman AB:The loss of skeletal muscle strength, mass, and quality in older adults: the health, aging and body composition study.J Gerontol A Biol Sci Med Sci2006,61:1059–1064. 42. Angin S, Crofts G, Mickle KJ, Nester CJ:Ultrasound evaluation of foot
muscles and plantar fascia in pes planus.Gait Posture2014,40:48–52. 43. Bellchamber TL, van den Bogert AJ:Contributions of proximal and distal
moments to axial tibial rotation during walking and running.J Biomech 2000,33:1397–1403.
44. Chuter VH, Janse de Jonge XA:Proximal and distal contributions to lower extremity injury: a review of the literature.Gait Posture2012,36:7–15. 45. Barwick A, Smith J, Chuter V:The relationship between foot motion and
lumbopelvic-hip function: a review of the literature.Foot (Edinb)2012, 22:224–231.
46. Evans W:Functional and metabolic consequences of sarcopenia.J Nutr 1997,127:998S–1003S.
47. Delmonico MJ, Harris TB, Visser M, Park SW, Conroy MB, Velasquez-Mieyer P, Boudreau R, Manini TM, Nevitt M, Newman AB, Goodpaster BH:Longitudinal study of muscle strength, quality, and adipose tissue infiltration.Am J Clin Nutr2009,90:1579–1585.
48. Goodpaster BH, Carlson CL, Visser M, Kelley DE, Scherzinger A, Harris TB, Stamm E, Newman AB:Attenuation of skeletal muscle and strength in the elderly: the health ABC study.J Appl Physiol2001,90:2157–2165. 49. Visser M, Kritchevsky SB, Goodpaster BH, Newman AB, Nevitt M, Stamm E,
Harris TB:Leg muscle mass and composition in relation to lower extremity performance in men and women aged 70 to 79: the health, aging and body composition study.J Am Geriatr Soc2002,50:897–904. 50. Vandervoort AA:Aging of the human neuromuscular system.Muscle Nerve
2002,25:17–25.
51. Frontera WR, Hughes VA, Lutz KJ, Evans WJ:A cross-sectional study of muscle strength and mass in 45- to 78-yr-old men and women.J Appl Physiol1991,71:644–650.
52. Garrow AP, Silman AJ, Macfarlane GJ:The Cheshire foot pain and disability survey: a population survey assessing prevalence and associations. Pain2004,110:378–384.
53. Murphy DF, Beynnon BD, Michelson JD, Vacek PM:Efficacy of plantar loading parameters during gait in terms of reliability, variability, effect of gender and relationship between contact area and plantar pressure. Foot Ankle Int2005,26:171–179.
54. Buldt AK, Murley GS, Butterworth P, Levinger P, Menz HB, Landorf KB:The relationship between foot posture and lower limb kinematics during walking: a systematic review.Gait Posture2013,38:363–372.
doi:10.1186/s13047-014-0046-5