Predictors of Survival in Children Born With Down
Syndrome: A Registry-Based Study
WHAT’S KNOWN ON THIS SUBJECT: Survival of children born with Down syndrome has been improving, but few studies have used population-based data to examine the influence of fetal and maternal characteristics on survival.
WHAT THIS STUDY ADDS: This study examined predictors of survival for children born with Down syndrome using population-based data from the UK Northern Congenital Abnormality Survey and shows that year of birth, gestational age, birth weight, and presence of additional anomalies influence survival status.
abstract
OBJECTIVE:To examine the influence of fetal and maternal character-istics on the survival of children born with Down syndrome.
METHODS:We used prospectively collected population-based data on Down syndrome extracted from the UK Northern Congenital Abnormality Survey (NorCAS), January 1, 1985–December 31, 2003, matched to hospital and national mortality records to January 29, 2008, to determine survival status of liveborn children. Survival to 20 years was estimated by using Kaplan-Meier methods. Cox proportional hazards regression was used to examine factors that predict survival.
RESULTS:A total of 1115 Down syndrome pregnancies were notified to NorCAS during the 19 years, a total prevalence of 16.8 (95% CI, 15.8– 17.8) per 10 000 live births and stillbirths. Of these, 5.4% resulted in a spontaneous fetal loss (late miscarriage$20 weeks and stillbirth), 31.7% in a termination of pregnancy, and 63.0% in a live birth. Survival status was known for 95.3% of live births; 16.6% resulted in a death. Year of birth (P , .001), gestational age at delivery (P , .001), standardized birth weight (P,.001), karyotype (P,.01), and pres-ence of additional structural anomalies (P, .001) were significant predictors of survival. Infant gender, plurality, maternal age, and maternal deprivation were not significant predictors of survival.
CONCLUSIONS:These robust estimates of predictors of survival are important for the prenatal counseling of parents whose pregnancy is affected by Down syndrome and for health care planning for the future care needs of these children.Pediatrics2012;129:e1373–e1381
AUTHORS:Judith Rankin, PhD,a,bPeter W.G. Tennant, MSc,a Mary Bythell, MSc,band Mark S. Pearce, PhDa
aInstitute of Health & Society, Newcastle University Newcastle
upon Tyne, United Kingdom, andbRegional Maternity Survey
Office, Newcastle upon Tyne, United Kingdom
KEY WORDS
survival, Down syndrome, mortality, congenital abnormalities, register, trisomy 21
ABBREVIATIONS
aHR—adjusted hazard ratio CI—confidence interval HR—hazard ratio
IMD—Index of Multiple Deprivation NHS—National Health Service
NorCAS—Northern Congenital Abnormality Survey ONS—Office for National Statistics
PMS—Northern Perinatal Mortality Survey VLBW—very low birth weight
Prof Rankin conceived the study, designed the study with Dr Pearce and wrote the paper; Ms Bythell and Prof Rankin contributed to acquisition of the data; Mr Tennant undertook the data analysis and contributed to drafting the paper; and all authors contributed to the interpretation of the data and gave final approval for the paper to be published.
www.pediatrics.org/cgi/doi/10.1542/peds.2011-3051
doi:10.1542/peds.2011-3051
Accepted for publication Jan 25, 2012
Address correspondence to Judith Rankin, PhD, Institute of Health & Society, Baddiley-Clarke Building, Newcastle University, Richardson Rd, Newcastle upon Tyne, NE2 4AX, UK. E-mail: judith. [email protected]
PEDIATRICS (ISSN Numbers: Print, 0031-4005; Online, 1098-4275).
Copyright © 2012 by the American Academy of Pediatrics
FINANCIAL DISCLOSURE:The authors have indicated they have
nofinancial relationships relevant to this article to disclose.
FUNDING:This study was funded by the UK charity the Newlife
Down syndrome is a chromosomal con-genital anomaly caused by an additional copy of all, or part, of chromosome 21. It is the most common nonlethal chromo-somal anomaly, with a reported preva-lence, in the United States, of 1.3 per 1000 live births.1The live birth prevalence of Down syndrome in a specific population is determined by both the maternal age distribution and the availability and up-take of prenatal diagnosis and termina-tion of pregnancy. For those parents who decide to continue pregnancies affected by Down syndrome, advances in fetal and neonatal care have improved outcomes for children born with Down syndrome such that the majority of children can now be expected to reach adulthood.2–8 However, there are limited data on the influence of a range of fetal and mater-nal characteristics that may be impor-tant predictors of survival, including the presence of additional structural anom-alies. Such information is needed to in-form parents and health professionals of prognoses and to guide commissioning for both the future health care needs and the educational and social care require-ments of affected individuals and their families.
This study used prospectively collected, population-based register data, matched with 3 high-quality sources of mortality information, to investigate the influence of a range of fetal and maternal char-acteristics on the survival status of individuals born with Down syndrome over an 19-year period.
METHODS
Study Population
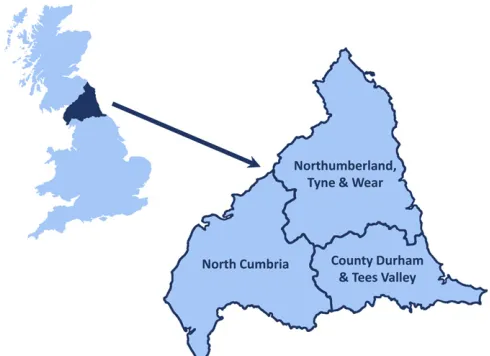
The North of England, UK (Fig 1), is a geographically distinct area with a sta-ble population of 3 million and∼32 000 deliveries per year. Data on all struc-tural and chromosomal congenital anomalies occurring within this pop-ulation are collected by the Northern Congenital Abnormality Survey (NorCAS) and include those arising in late
miscarriages (fetal deaths at 20–23 weeks’gestation), terminations of pre-gnancy for fetal anomaly after prenatal diagnosis at any gestation, stillbirths (fetal deaths delivered at$24 weeks’ gestation), and live births to mothers resident in the region, regardless of their delivery location. Cases are as-certained from multiple sources, in-cluding antenatal ultrasound, fetal medicine departments, cytogenetic laboratories, the regional cardiology center, pathology departments, and pediatric surgery, and are included when first diagnosed up to age 16 years (1985–2001) or, more recently, age 12 years (2001–present). Further details of data collection have been previously published.9 The NorCAS is a member of the British Isles Network of Congenital Anomaly Registers10and the European Surveillance of Congen-ital Anomalies.11
Classification
All anomalies are coded according to the World Health Organization Interna-tional Statistical Classification of Dis-eases and Related Health Problems 10th Revision12 and categorized into congenital anomaly group (the system affected), subtype (the specific con-dition), and syndrome (where appli-cable) according to the European
Surveillance of Congenital Anomalies guidelines.13Up to 6 congenital anom-alies can be recorded for each in-dividual.
All children with Down syndrome (in-cluding trisomy 21, Q90.0, mosaic Down syndrome, Q90.1, and translocations involving chromosome 21 Q90.2) who were delivered between January 1, 1985, to December 31, 2003, formed this population-based case series.
Information on Deaths
The Northern Perinatal Mortality Sur-vey (PMS) is a population-based surSur-vey of all perinatal and infant deaths in the North of England.14 The NorCAS and PMS are held in a common database at the Regional Maternity Survey Office in Newcastle and linked via the mother’s details. The PMS holds details of all deaths in the first year of life. In-formation on deaths occurring in sub-sequent years, and for those who moved out of the region before the age of 1 year, was obtained from the UK Office for National Statistics (ONS). Individuals were traced by National Health Service (NHS) number (where available), maternal surname, infant gender, date of birth, and last known address. Deaths were matched individ-uals with a corresponding mortality re-cord, whereas survivors were matched
FIGURE 1
individuals with no record of death be-fore January 28, 2008 (the date that the trace was carried out). Those individuals who were not found on the PMS or matched with records from the ONS, were identified from information held by NorCAS or hospital records. Survival status for those identified was estab-lished using the NHS National Strategic Tracing Service. Cases that could not be traced by any of these methods were excluded from the analysis.
Statistical Analysis
Prevalence rates were estimated as the total number of cases per 10 000 births (live births and stillbirths). The 95% confidence intervals (CIs) for prevalence rates were derived from the binomial distribution. Temporal trends in preva-lence (or proportion) were examined by the Cochran-Armitage test. Temporal trends for other variables were exam-ined by the Cuzick test for trend.
Surviving children with Down syndrome were censored with their age on Jan-uary 28, 2008. Survival in the general UK population was estimated from published life tables.15 The cumulative prob-ability of a spontaneous fetal loss was also estimated by the Kaplan-Meier method. Gestational age at delivery was used as the time scale variable and
‘failure’was defined as any spontaneous fetal death, including miscarriages (20– 23 weeks gestation age) and stillbirths ($24 weeks gestation). Cases delivered as elective terminations of pregnancy were censored at their gestational age of delivery, while cases delivered as live births were treated as having survived until the latest gestational age. Retaining live births in the denominator provides a more accurate estimate of the true probability of spontaneous fetal loss by avoiding distortions from late stillbirths at very rare gestational ages.
The following factors were examined as potential influences of survival: karyo-type (full trisomy 21, mosaicism, and
translocation), year of birth (1985–1990, 1991–1996, and 1997–2003), infant gen-der (male and female), plurality (sin-gleton and multiple), gestational age at delivery (,30, 30–36, and $37 weeks), maternal age at delivery (,20, 20–30, and.30 years), birth weight, index of multiple deprivation (IMD), and presence of additional structural anomalies. Birth weight was stan-dardized for gestational age, gender, and parity (z score ,1, between 21 and 1, and.1) by applying a custom-ized fetal growth formula to regional birth weight references.16The IMD 2004, an area-based measure of socioeco-nomic deprivation,17was determined for each case using the mother’s postal code at delivery and was analyzed as within-region tertiles. The presence of additional anomalies was classified into 5 categories: no additional anomalies, cardiovascular anomalies only, digestive system anomalies only, cardiovascular and digestive system anomalies only, or any other combination of anomalies.
Survival within each variable category, and 95% CIs were derived by the Kaplan-Meier method, with differences between categories being examined by using the log-rank test. To prevent pre-sentation of unreliable estimates de-rived from the tail of the Kaplan-Meier curve, survival probabilities were not determined where, or once, there were ,10 at-risk cases. In these instances, the probability of survival to a given age was approximated by using Cox proportional hazards regression. Cox proportional hazards regression was also used to examine the independent influence of each variable by constructing an ad-justed model containing all variables on test with year of birth, gestational age, and standardized birth weight included as continuous variables. Interaction terms were used to examine whether survival had improved similarly among cases with and without additional anom-alies. The Grambsch-Therneau test for
constancy of the log hazard ratio (HR) function was used to examine ad-herence to the proportional hazards assumption.
Statistical analyses were carried out by using Stata 10.1 (StataCorp, College Station, TX). P, .05 was considered statistically significant.
Ethical Approval
NorCAS, as part of the British Isles Network of Congenital Anomaly Regis-ters network, is exempt from requiring consent for inclusion on the register under section 251 of the NHS Act 2006 and has ethics approval (09/H0405/08) to undertake studies involving the data. A favorable ethical opinion for this study was given by the South Tees Local Re-search Ethics Committee.
RESULTS
A total of 1115 pregnancies affected by Down syndrome were notified to the NorCAS during the 19 years, giving a total prevalence of 16.8 (95% CI, 15.8– 17.8) per 10 000 live and stillbirths. Total prevalence increased from 14.0 (95% CI, 12.5–15.6) per 10 000 births in 1985–1990 to 20.4 (95% CI, 18.5–22.4) per 10 000 births in 1997–2003 (Ptest for trend ,.001). There were 1058 (94.9%) pregnancies with trisomy 21, 34 (3.1%) with a translocation affecting chromosome 21, and 23 (2.1%) with mosaic Down syndrome (Table 1). There were 24 (2.2%) twin or higher order pregnancies affected by Down syn-drome; 21 (87.5%) of these resulted in a live birth (Table 1).
in 1985–1990 to 34 years (95% CI, 34–35) in 1997–2003 (Ptest for trend,.001); the proportion of Down syndrome preg-nancies to older mothers ($30 years) increased from 52.5% (95% CI, 47.0%– 57.9%) in 1985–1990 to 77.2% (95% CI, 73.2%–81.1%) in 1997–2003 (Ptest for trend,.001).
Four hundred eighty-nine (43.9%) Down syndrome pregnancies occurred in women from the region’s least deprived tertile (Table 1). Also, 535 (48%) preg-nancies were delivered at term ($37 weeks) and 110 (9.9%) babies had a birth weightzscore.1.
In 416 (37.3%) pregnancies, there was one or more additional structural ano-maly (Table 2). In 348 (31.2%) Down syndrome pregnancies, there was a coincident cardiovascular anomaly; 308 (88.5%) had only a cardiovascular anomaly, 25 (7.2%) had a cardiovascu-lar and digestive anomaly. and 15 (4.3%) had a cardiovascular and other anomaly. The most common cardio-vascular subtypes were atrioventricu-lar septal defects (n= 155, 13.9%) and ventricular septal defects (n = 112, 10%). There were digestive system anomalies in 57 (5.1%) pregnancies; 28 (49.1%) pregnancies had only a digestive system anomaly, 25 (43.9%) pregnancies had a digestive system and cardiac anomaly, and 4 (7.0%) had a digestive system anomaly and another structural anomaly (but not cardiac). Duodenal atresia occurred in 36 (32.2%) preg-nancies with Down syndrome. Other additional structural anomalies included anomalies of the urinary system (n= 11, 1.1%) and nervous system (n= 7, 0.6%) (Table 2).
Sixty (5.4%) pregnancies resulted in a spontaneous fetal death and 353 (31.7%) in a termination of pregnancy for fetal anomaly (Table 1). The overall proba-bility of a spontaneous fetal loss, ac-counting for case censoring, was 7.9% (95% CI, 6.2%–10.0%). The proportion of pregnancies ending in termination of
pregnancy increased from 18.0% (95% CI, 13.9%–22.6%) in 1985–1990 to 39.0% (95% CI, 34.4%–43.8%) in 1997–2003 (P,.001). There were 702 (63.0%) live births, giving a live birth prevalence of 10.6 (95% CI, 9.9%–11.5%) per 10 000 live births. Live birth prevalence was 11.1 (95% CI, 9.8–12.5) per 10 000 live births in 1985–1990, 9.4 (95% CI, 8.1– 10.8) per 10 000 live births for 1991– 1996, and 11.5 (95% CI, 10.1–13.0) per 10 000 live births in 1997–2003 (Pfor trend = .81).
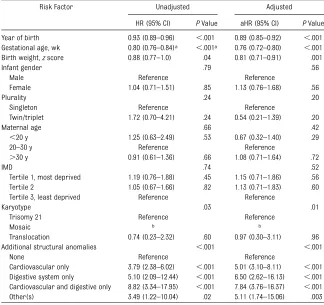
Survival status was known for 669 (95.3%) Down syndrome live births. Of the traced cases, 111 (16.6%) resulted in a death; survival status was unknown for 33 (4.7%) individuals with Down syn-drome. Seventy-eight deaths occurred in the first year of life, giving an infant mortality rate of 11.7% (95% CI, 9.3%– 14.3%). Infant mortality decreased signif-icantly from 14.0% (95% CI, 9.9%–19.2%) in 1985–1990 to 5.8% (3.2%–9.6%) in 1997–2003 (P = .002). Table 3 and Fig 2 show survival for children live born with Down syndrome over the study period; 10- and 20- year survival rates were 83.9% and 82.9%, respec-tively. Ten-year survival increased from 78.3% in 1985–1990 to 91.2% in 1997– 2003. There were few deaths from 10 to 20 years; 20-year survival increased from 77.5% in 1985–1990 to a predicted (by Cox proportional hazards regres-sion) 90.7% in 1997–2003.
There were no deaths among indi-viduals with trisomy 21 mosaicism; survival was significantly better compared with individuals with full trisomy 21 (HR indeterminate, me-dium unbiased rate ratio = 0.21 [95% CI, 0.00–0.93]; P= .04). No apparent difference was observed in the sur-vival of children with Down syndrome resulting from full trisomy and chil-dren with Down syndrome resulting from a translocation (Table 3) (ad-justed HR [aHR] = 0.97 [95% CI, 0.30– 3.10];P= .60).
TABLE
1
Continued
Risk
Factor
Total
Pr
egn
ancies
Spo
ntaneou
s
Fetal
Dea
ths
(%
Total
Pr
egnan
cies)
Termina
tions
of
Pr
egnancy
(%
Total
Pr
egnan
cies)
Live
Bir
ths
(%
Total
Pr
egnan
cies)
Tr
aced
Live
Bir
ths
(%
Live
Bir
ths)
Deaths
(%
Tr
ac
ed
Live
Bir
ths)
%
Surv
ival
(95%
CI)
1-y
5-y
10
-y
20-y
Car
diovascu
lar
and
digestive
25
2
(8.0)
0
(0.0)
23
(92.0)
23
(100.0)
11
(47.8)
65.2
(42.4
–
80
.8)
52
.2
(30.5
–
70.0)
52.2
(30.5
–
70
.0)
50
.1
a
Other(s)
55
3
(5.5)
31
(56.4
)
21
(38.2)
19
(90.5)
4
(21.1)
79.0
(53.2
–
91
.5)
79
.0
(53.2
–
91.5)
77.8
a
76
.2
a
NA,
not
applicable.
aEstimated
by
Cox
regression
because
there
wer
e
,
10
cases
at
risk
at
the
end
of
the
time
interval.
bK
aplan-Meier
CIs
una
Year of birth was a significant predictor of survival (aHR, per year = 0.89 [95% CI, 0.85–0.92];P,.001; Fig 1) with survival highest in the later epoch (1997–2003) (Table 3). There was a significant influence of gestational age at delivery (aHR = 0.76 [95% CI, 0.72–0.80];P,
.001) on survival; only 23.1% (95% CI, 5.6%–47.5%) of children with Down syndrome born at,30 weeks’ gesta-tion survived to 1 year compared with 92.0% (95% CI, 89.2%–94.1%) of those born at term. Increasing standardized birth weight also positively predicted survival (aHR, perzscore = 0.80 [95% CI, 0.71–0.91]; P , .001). There was a nonsignificant relationship between being large for gestational age and survival (aHR = 0.64 [95% CI, 0.27– 1.53];P= .32).
The presence of additional anomalies increased mortality (Table 3, Fig 2); with a 5- to 8-fold increased risk of mortality in the presence of a cardiovascular, digestive, or both cardiovascular and
digestive system anomalies. The survival of children with both cardiovascular and a digestive system anomalies was not significantly lower than for those with digestive system anomalies only (P= .27). There was no evidence that temporal improvements in survival were different between cases with and with-out additional anomalies (Fig 2). The 10-year survival for children born with Down syndrome in 1997–2003 with no additional structural anomalies was 99.1% (95% CI, 93.4%–99.9%), not sig-nificantly less than the general pop-ulation of the United Kingdom during 2000 (P= .78).
There was little evidence that infant gender, plurality, maternal age, or IMD were significant predictors of survival (P..2) (Table 3).
DISCUSSION
This large, population-based study es-timated the influence of a range of fetal
and maternal characteristics on sur-vival in children born with Down syn-drome over a 19-year study period by using data from an established high-quality congenital anomaly registry. There were no deaths among individ-uals with mosaic trisomy 21, and sur-vival was similar between individuals with trisomy 21 arising from a trans-location and those with trisomy 21. Year of birth, gestational age at delivery, and standardized birth weight were inde-pendent positive predictors of survival. The presence of additional anomalies significantly reduced survival; however, survival was improved over time for all individuals with Down syndrome, regardless of the presence of additional anomalies. Infant gender, plurality, ma-ternal age, and mama-ternal deprivation were not found to significantly influence survival.
Our study has several strengths. We have used data on Down syndrome derived from a longstanding, high-quality congenital anomaly registry. The NorCAS ascertains cases from multiple sources including cytogenetic laboratories and undertakes regular validation with the Northern Genetics Service. The NorCAS contributes to established UK and European networks that use similar inclusion criteria and have a consistent approach to data collection, coding, and recording. NorCAS includes notifications of cases up to 12 years of age. Death information was obtained from death registrations held by the UK ONS. This information is very complete18 and will include all deaths including those that occur be-fore surgery has taken place. This is likely to explain our lower survival rates for children with Down syndrome and a cardiac anomaly compared with a re-cent study from the same region that examined survival using information based solely on postsurgical mortality.19 Although primarily a study of post-natal survival, we have also included
TABLE 2 Additional Anomalies in Pregnancies Affected by Down Syndrome in the North of
England, 1985–2003
Additional Anomaliesa No. of Cases (%)
All Pregnancies(n= 1115) Live Births (n= 702)
One or more additional anomaliesb 416 (37.3%) 330 (47.0%)
Nervous system 7 (0.6%) 2 (0.3%)
Hydrocephalus 5 (0.5%) 1 (0.1%)
Eye 1 (0.1%) 1 (0.1%)
Cardiovascular anomaly 348 (31.2%) 293 (41.7%)
Ventricular septal defect 112 (10.0%) 93 (13.2%)
Atrial septal defect 52 (4.7%) 52 (7.4%)
Atrioventricular septal defect 155 (13.9%) 127 (18.1%)
Tetralogy of Fallot 18 (1.6%) 15 (2.1%)
Pulmonary valve stenosis 7 (0.6%) 7 (1.0%)
Coarctation of the aorta 10 (0.9%) 8 (1.1%)
Respiratory 3 (0.3%) 1 (0.1%)
Digestive system 57 (5.1%) 48 (6.8%)
Esophageal atresia 5 (0.5%) 4 (0.6%)
Duodenal atresia/stenosis 36 (32.2%) 30 (4.3%)
Hirschsprung disease 10 (0.9%) 10 (1.4%)
Abdominal wall 1 (0.1%) 0 (0.0%)
Urinary 11 (1.0%) 4 (0.6%)
Hydronephrosis 7 (0.6%) 3 (0.4%)
Genital 1 (0.1%) 1 (0.1%)
Limb 5 (0.5%) 5 (0.7%)
Musculoskeletal 1 (0.1%) 1 (0.1%)
Cystic hygroma 12 (1.1%) 0 (0.0%)
No additional anomalies 699 (62.7%) 372 (53.0%)
pregnancies ending in spontaneous fetal loss and termination of pregnancy for fetal anomaly after prenatal di-agnosis to give a complete picture of the natural history of Down syndrome– affected pregnancies.
The study also has some limitations. Despite the use of 3 comprehensive sources of information on deaths, we were unable to trace almost 5% of individuals with Down syndrome. It is likely that a proportion of these children will have been adopted, making tracing difficult. For some variables, we did not have enough liveborn cases in each category to observe the survival, so less accurate approximations (using Cox regression modeling), were used. We used an area-based measure of dep-rivation derived from the maternal residential postal code rather than in-dividual measures such as maternal
educational attainment or parental occupation, which were not available to the study. We have accurate information on the date of death, but information on the cause of death was not available to the study. However, previous studies have shown that the main causes of death in children born with Down syn-drome are cardiac in origin, infection, and leukemia.20
The total prevalence of Down syndrome in the region during this 19-year period was 16.8 per 10 000 births. Total preva-lence has increased during the study period; 2 contributors to this increase are advancing maternal age and in-creased prenatal detection of cases that would have been undiagnosed fetal losses. Live birth prevalence remained constant, reflecting a balance between increasing prenatal detection and elec-tive termination of pregnancy.
We found a male preponderance among total Down syndrome pregnancies but no significant difference in the proportion of live births for females compared with the proportion of live births for males. Infant gender did not influence survival. Some previous studies have also reported no dif-ference in survival by gender.6,20,21 However, Glasson et al’s study from Western Australia reported a longer life expectancy among males with Down syndrome (61.1 years) com-pared with females (57.8 years), which is contrary to that in the general pop-ulation.22
There was a significant association between year of birth and the probability of survival, with survival increasing over time. In the United Kingdom, diagnostic testing for Down syndrome has been an integral part of routine antenatal screening for over three decades. Uni-versal screening has been offered since April 2004.23 The increase in survival over time is likely to result from a number of improvements in medical care including surfactant therapy and corticosteroids for respiratory distress syndrome,24 intrapartum treatment of chorioamnionitis to prevent neonatal sepsis,25 public health campaigns that have lowered the incidence of sudden unexpected death in infancy,26and ad-vances in echocardiography and cardiac surgery.27Overall survival for individuals with Down syndrome is still below that of the general UK population. However, our results suggest the majority of this is due to the presence of addi-tional anomalies; indeed, we found the 10-year survival rate for children born with Down syndrome and no additional structural anomalies was similar to that of the general pop-ulation.
Maternal age is a well-known risk factor for Down syndrome, and we found that two-thirds of Down syndrome pregnan-cies occurred in mothers.30 years old.
TABLE 3 Predictors of Survival in Children Live Born With Down Syndrome
Risk Factor Unadjusted Adjusted
HR (95% CI) PValue aHR (95% CI) PValue
Year of birth 0.93 (0.89–0.96) ,.001 0.89 (0.85–0.92) ,.001 Gestational age, wk 0.80 (0.76–0.84)a ,.001a 0.76 (0.72–0.80) ,.001 Birth weight,zscore 0.88 (0.77–1.0) .04 0.81 (0.71–0.91) .001
Infant gender .79 .56
Male Reference Reference
Female 1.04 (0.71–1.51) .85 1.13 (0.76–1.68) .56
Plurality .24 .20
Singleton Reference Reference
Twin/triplet 1.72 (0.70–4.21) .24 0.54 (0.21–1.39) .20
Maternal age .66 .42
,20 y 1.25 (0.63–2.49) .53 0.67 (0.32–1.40) .29
20–30 y Reference Reference
.30 y 0.91 (0.61–1.36) .66 1.08 (0.71–1.64) .72
IMD .74 .52
Tertile 1, most deprived 1.19 (0.76–1.88) .45 1.15 (0.71–1.86) .56
Tertile 2 1.05 (0.67–1.66) .82 1.13 (0.71–1.83) .60
Tertile 3, least deprived Reference Reference
Karyotype .03 .01
Trisomy 21 Reference Reference
Mosaic b b
Translocation 0.74 (0.23–2.32) .60 0.97 (0.30–3.11) .96
Additional structural anomalies ,.001 ,.001
None Reference Reference
Cardiovascular only 3.79 (2.38–6.02) ,.001 5.01 (3.10–8.11) ,.001 Digestive system only 5.10 (2.09–12.44) ,.001 6.50 (2.62–16.13) ,.001 Cardiovascular and digestive only 8.82 (3.34–17.95) ,.001 7.84 (3.76–16.37) ,.001
Other(s) 3.49 (1.22–10.04) .02 5.11 (1.74–15.06) .003
aThe model containing gestational age alone did not satisfy the Cox proportional hazards assumption. Gestational age,
however, remained significant in a univariate accelerated failure time model assuming a generalizedghazard function (increase in life expectancy per week of gestation = 0.75 y [95% CI, 0.51–1.00],P,.001).
Nearly half of these mothers chose to have a termination of pregnancy, reflecting the age-related screening policies available in the United King-dom during the study period as op-posed to universal screening policies now in place. However, maternal age at delivery was not a significant predictor of survival, as has been found by others.7
Gestational age at delivery and stan-dardized birth weight were also found to be significant predictors of sur-vival. In 2010, Boghossian et al28found that very low birth weight (VLBW) children born with Down syndrome were at an increased risk of death compared with VLBW children
with-out Down syndrome. Withwith-out survival information for VLBW infants with-out Down syndrome in the general population, we were not able to confirm this.
As other studies have reported,29,30we found a higher prevalence of Down syndrome pregnancies in women living in the least deprived parts of the region. More women from the least deprived areas had a ter-mination of pregnancy compared with women from the most de-prived areas. Nevertheless, we found no association between deprivation and survival; although this may be due to limited study power or that the IMD, despite being a standard
estimate of deprivation used in the United Kingdom, did not adequately assess the relevant individual-level exposures.
CONCLUSIONS
Survival for children born with Down syndrome has increased over time. However, there is little available population-based data on the influence of a range of fetal and maternal char-acteristics on survival status. We have found that year of birth, gestational age at delivery, standardized birth weight, and presence of additional structural anomalies predict survival status. It is essential that parents are presented
FIGURE 2
Survival of children born with Down syndrome in the North of England, 1985–2003. (A) Overall, showing 95% confidence intervals. (B) By year of birth. (C) By
with accurate information on expected outcome during prenatal counseling and that health, education, and social care planning for the future needs of these children and their families is based on high-quality data. However, while
improving survival is essential, further research on subjective quality of life is also needed if we are to attempt to address the many challenges fac-ing individuals livfac-ing with Down syndrome.
ACKNOWLEDGMENTS
We thank all the Link clinicians in the North of England for their continued support of the NorCAS. NorCAS is funded by the UK Healthcare Quality Im-provement Partnership.
REFERENCES
1. Canfield MA, Honein MA, Yuskiv N, et al.
National estimates and race/ethnic-specific
variation of selected birth defects in the
United States, 1999-2001.Birth Defects Res
A Clin Mol Teratol. 2006;76(11):747–756
2. Baird PA, Sadovnick AD. Life tables for Down
syndrome.Hum Genet. 1989;82(3):291–292
3. Dastgiri S, Gilmour WH, Stone DH. Survival of children born with congenital
anoma-lies.Arch Dis Child. 2003;88(5):391–394
4. Forrester MB, Merz RD. First-year mortality rates for selected birth defects, Hawaii,
1986-1999.Am J Med Genet A. 2003;119A(3):311–318
5. Nembhard WN, Waller DK, Sever LE, Canfield
MA. Patterns of first-year survival among
infants with selected congenital anomalies
in Texas, 1995-1997. Teratology. 2001;64(5):
267–275
6. Rasmussen SA, Wong LY, Correa A, Gambrell D, Friedman JM. Survival in infants with Down syndrome, Metropolitan Atlanta,
1979-1998.J Pediatr. 2006;148(6):806–812
7. Hayes C, Johnson Z, Thornton L, et al.
Ten-year survival of Down syndrome births.Int
J Epidemiol. 1997;26(4):822–829
8. Leonard S, Bower C, Petterson B, Leonard
H. Survival of infants born with Down’s
syndrome: 1980-96. Paediatr Perinat
Epi-demiol. 2000;14(2):163–171
9. Richmond S, Atkins J. A population-based study of the prenatal diagnosis of
con-genital malformation over 16 years.BJOG.
2005;112(10):1349–1357
10. British Isles Network of Congenital Anomaly Registers. Available at: www.binocar.org/. Accessed March 19, 2012
11. European Surveillance of Congenital Anoma-lies. Available at: www.eurocat-network.eu/. Accessed on March 19, 2012
12. World Health Organization. International
statistical classification of diseases and
related health problems 10th revision:
version for 2007. Available at: www.who.
int/classifications/icd10/. Accessed March 19,
2012
13. European Surveillance of Congenital Anom-alies. Coding of EUROCAT subgroups of congenital anomalies. Available at: www.
eurocat-network.eu/content/EUROCAT-Defi
nition-New-Subgroups-Feb-2007.pdf. Accessed March 19, 2012
14. Hey EN, Welch RG, Lawson JB, et al. Peri-natal mortality: a continuing collaborative
regional survey. Br Med J (Clin Res Ed).
1984;288(6432):1717–1720
15. World Health Organization. Life tables for WHO member states. Available at: www.who. int/healthinfo/statistics/mortality_life_tables/ en/. Accessed March 19, 2012
16. Tin W, Wariyar UK, Hey EN; The Northern Neonatal Network. Selection biases invalidate current low birthweight weight-for-gestation
standards.Br J Obstet Gynaecol. 1997;104(2):
180–185
17. Noble M, Wright G, Dibben C, et al.The
En-glish Indices of Deprivation 2004 (Revised). London, UK: Neighbourhood Renewal Unit,
Office of the Deputy Prime Minister; 2004
18. Tennant PWG, Pearce MS, Bythell M, Rankin J. 20-Year survival of children born with congenital anomalies: a population-based
study.Lancet. 2010;375(9715):649–656
19. Irving CA, Chaudhari MP. Cardiovascular
abnormalities in Down’s syndrome:
spec-trum, management and survival over 22 years [published online ahead of print
August 11, 2011]. Arch Dis Child. doi:
10.1136/adc.2010.210534
20. Day SM, Strauss DJ, Shavelle RM, Reynolds RJ. Mortality and causes of death in per-sons with Down syndrome in California.
Dev Med Child Neurol. 2005;47(3):171–176
21. Masaki M, Higurashi M, Iijima K, et al. Mortality and survival for Down syndrome
in Japan. Am J Hum Genet. 1981;33(4):
629–639
22. Glasson EJ, Sullivan SG, Hussain R, Petterson BA, Montgomery PD, Bittles AH. Comparative survival advantage of males with Down
syndrome.Am J Hum Biol. 2003;15(2):192–
195
23. UK National Screening Committee.Antenatal
Screening - Working Standards for Down’s Syndrome Screening 2007. 2nd ed. Exeter, UK: UK NSC; 2007
24. Palta M, Weinstein MR, McGuinness G, Gabbert D, Brady W, Peters ME. A pop-ulation study. Mortality and morbidity after availability of surfactant therapy. Newborn
Lung Project. Arch Pediatr Adolesc Med.
1994;148(12):1295–1301
25. Gilstrap LC III, Leveno KJ, Cox SM, Burris JS, Mashburn M, Rosenfeld CR. Intrapartum treatment of acute chorioamnionitis: impact
on neonatal sepsis. Am J Obstet Gynecol.
1988;159(3):579–583
26. BMJ. Cot deaths.BMJ. 1995;310(6971):7–10
27. Perloff JK, Warnes CA. Challenges posed by adults with repaired congenital heart
disease. Circulation. 2001;103(21):2637–
2643
28. Boghossian NS, Hansen NI, Bell EF, et al; Eunice Kennedy Shriver National Institute of Child Health and Human Development Neo-natal Research Network. Survival and mor-bidity outcomes for very low birth weight
infants with Down syndrome.Pediatrics. 2010;
126(6):1132–1140
29. Vrijheid M, Dolk H, Stone D, Abramsky L, Alberman E, Scott JE. Socioeconomic in-equalities in risk of congenital anomaly.
Arch Dis Child. 2000;82(5):349–352
30. Lopez PM, Stone D, Gilmour H. Epidemiology
of Down’s syndrome in a Scottish city.
DOI: 10.1542/peds.2011-3051 originally published online May 21, 2012;
2012;129;e1373
Pediatrics
Judith Rankin, Peter W.G. Tennant, Mary Bythell and Mark S. Pearce
Registry-Based Study
Predictors of Survival in Children Born With Down Syndrome: A
Services
Updated Information &
http://pediatrics.aappublications.org/content/129/6/e1373
including high resolution figures, can be found at:
References
http://pediatrics.aappublications.org/content/129/6/e1373#BIBL
This article cites 22 articles, 5 of which you can access for free at:
Subspecialty Collections
http://www.aappublications.org/cgi/collection/genetics_sub
Genetics
following collection(s):
This article, along with others on similar topics, appears in the
Permissions & Licensing
http://www.aappublications.org/site/misc/Permissions.xhtml
in its entirety can be found online at:
Information about reproducing this article in parts (figures, tables) or
Reprints
http://www.aappublications.org/site/misc/reprints.xhtml
DOI: 10.1542/peds.2011-3051 originally published online May 21, 2012;
2012;129;e1373
Pediatrics
Judith Rankin, Peter W.G. Tennant, Mary Bythell and Mark S. Pearce
http://pediatrics.aappublications.org/content/129/6/e1373
located on the World Wide Web at:
The online version of this article, along with updated information and services, is
by the American Academy of Pediatrics. All rights reserved. Print ISSN: 1073-0397.