ARTICLE
Adverse Birth Outcome Among Mothers With Low
Serum Cholesterol
Robin J. Edison, MD, MPHa, Kate Berg, PhDa, Alan Remaley, MDb, Richard Kelley, MD, PhDc, Charles Rotimi, PhDd, Roger E. Stevenson, MDe, Maximilian Muenke, MDa
aMedical Genetics Branch, National Human Genome Research Institute, National Institutes of Health, Bethesda, Maryland;bNational Institutes of Health Clinical Center,
Bethesda, Maryland;cKennedy Krieger Institute, Baltimore, Maryland;dNational Human Genome Research Center, Howard University, Washington, DC;eGreenwood
Genetic Center, Greenwood, South Carolina
The authors have indicated they have no financial relationships relevant to this article to disclose.
ABSTRACT
OBJECTIVE.The objective of this study was to assess whether low maternal serum cholesterol during pregnancy is associated with preterm delivery, impaired fetal growth, or congenital anomalies in women without identified major risk factors for adverse pregnancy outcome.
METHODS.Mother-infant pairs were retrospectively ascertained from among a cohort of 9938 women who were referred to South Carolina prenatal clinics for routine second-trimester serum screening. Banked sera were assayed for total cholesterol;
⬍10th percentile of assayed values (159 mg/dL at mean gestational age of 17.6
weeks) defined a “low total cholesterol” prenatal risk category. Eligible women were aged 21 to 34 years and nonsmoking and did not have diabetes; neonates were liveborn after singleton gestations. Total cholesterol values of eligible moth-ers were adjusted for gestational age at screening before risk group assignment. The study population included 118 women with low total cholesterol and 940 women with higher total cholesterol. Primary analyses used multivariate regres-sion models to compare rates of preterm delivery, fetal growth parameters, and congenital anomalies between women with low total cholesterol and control
subjects with mid–total cholesterol values⬎10th percentile but⬍90th percentile.
RESULTS.Prevalence of preterm delivery among mothers with low total cholesterol was 12.7%, compared with 5.0% among control subjects with mid–total choles-terol. The association of low maternal serum cholesterol with preterm birth was observed only among white mothers. Term infants of mothers with low total cholesterol weighed on average 150 g less than those who were born to control mothers. A trend of increased microcephaly risk among neonates of mothers with low total cholesterol was found. Low maternal serum cholesterol was unassociated with risk for congenital anomalies.
CONCLUSIONS.Total serum cholesterol⬍10th population percentile was strongly as-sociated with preterm delivery among otherwise low-risk white mothers in this pilot study population. Term infants of mothers with low total cholesterol weighed less than control infants among both racial groups.
www.pediatrics.org/cgi/doi/10.1542/ peds.2006-1939
doi:10.1542/peds.2006-1939
Key Words
cholesterol, preterm birth, birth defects, congenital defects, birth weight, embryonic and fetal development, lipoproteins
Abbreviations
LDL-C—low-density lipoprotein cholesterol
TC—total cholesterol
IUGR—intrauterine growth restriction LMSC—low maternal serum cholesterol GA— gestational age
GGC—Greenwood Genetic Center NIH—National Institutes of Health OR— odds ratio
CI— confidence interval
Accepted for publication Mar 14, 2007
Address correspondence to Maximilian Muenke, MD, Medical Genetics Branch, National Human Genome Research Institute, National Institutes of Health, Department of Health and Human Services, 35 Convent Dr, MSC 3717, Building 35, Room 1B-203, Bethesda, MD 20892-3717. E-mail: mmuenke@nhgri.nih.gov
M
ATERNAL CHOLESTEROL IS essential for both the hormonal and physical changes of earlypregnan-cy.1–8 Circulating low-density lipoprotein cholesterol
(LDL-C) is the chief substrate for placental progesterone
biosynthesis.9,10 Subclasses of high-density lipoprotein
cholesterol also participate in placental cholesterol
bal-ance.11Cholesterol in plasma membranes is a bulk
con-stituent of decidual tissue critical to implantation and
uteroplacental vascularization.12–15Alterations in
placen-tal cholesterol concentrations have been associated with changes in placental transport functions during
gesta-tion.16 Gestational disorders such as preeclampsia and
gestational diabetes, as well as maternal alcohol con-sumption, have been associated with lipoprotein chang-es.11,17–21
Maternal cholesterol is probably transported to the early embryo and would be available for development of
both embryonic and placental tissues.22–28 Longitudinal
studies have documented specific changes in total and fractionated cholesterol levels in maternal serum as ges-tation progresses; total cholesterol increases substantially
during the second and third trimesters.29–35This
physio-logic hypercholesterolemia of later pregnancy suggests an adaptive function for pregnancy maintenance or fetal
growth.36Decreased levels of maternal total cholesterol
(TC) and LDL-C have been reported in association with
intrauterine growth restriction (IUGR).37,38 Conversely,
maternal hypercholesterolemia is suspected to be
inju-rious, because concentrations ⬎300 mg/dL have been
linked to increased cholesterol deposition in the fetal
aorta39; the “fetal origins hypothesis” links this
phenom-enon to subsequently increased risk for cardiovascular
disease in the adult offspring.40–42 It is not known
whether optimal levels of maternal serum cholesterol during pregnancy can be defined. We are not aware of data addressing any potential risk to the pregnancy when maternal serum cholesterol falls below a lower bound. This pilot study investigated the premise that low maternal serum cholesterol (LMSC) during gestation may be associated with adverse pregnancy outcomes. In view of the evidence for maternal transport of choles-terol to the embryo in early pregnancy, we reasoned that maternal cholesterol may have a disproportionate im-pact during critical periods for placentation and early
neuroepithelial expansion.5,6,43–48 Specifically, we
hy-pothesized a priori that LMSC may increase the risk for preterm delivery, microcephaly, or other central
ner-vous system anomalies.7,49–53 Secondarily, we
hypothe-sized an increased risk for fetal growth restriction and
congenital anomalies.7,50,54
Our study population was retrospectively sampled from a population-based cohort of 9938 women whose blood had been banked concurrently with routine serum screening performed at prenatal clinics that serve west-ern South Carolina. This screening occurred over a broad spectrum of gestational ages (GAs) throughout the
sec-ond trimester (range: 13–23 weeks). We derived the population distribution of maternal TC from all banked
sera and defined a low-TC risk exposure as TC ⬍10th
percentile of this screened population (159 mg/dL at a mean GA 17.6 weeks, or 4.11 mmol/L at that date). For facilitation of comparisons among cholesterol values sampled at different GAs, all TC values in the study population were adjusted for GA at date of screening using linear regression methods. Women with higher levels of TC formed the pool of potential control subjects; their adjusted TC values were separated into mid-TC and high-TC categories encompassing the 10th to 90th and
⬎90th population percentiles, respectively (90th
popu-lation percentile at 17.6 weeks’ GA was 261 mg/dL, or 6.75 mmol/L). Eligibility criteria were designed to min-imize identifiable pregnancy risk factors or potential confounders; among other characteristics, participants were aged 21 to 34; had no history of smoking, type 1 diabetes, or other medical or gestational risk conditions; and had ultrasound-dated singleton pregnancies that re-sulted in a live birth. The study hypotheses were tested by assessing risk ratios for specific adverse outcomes in infants of mothers with low TC compared with mid-TC control mothers, using multivariate regression models.
METHODS
Study Population Ascertainment
The Greenwood Genetic Center (GGC) in Greenwood, South Carolina, has an established protocol for collecting baseline maternal data and banking serum samples from all consenting women who are referred for routine sec-ond-trimester serum screening to clinics that serve urban and rural areas of western South Carolina. Insti-tutional review boards of participating institutions ap-proved this study protocol. Serum samples and clinical data were identified to National Institutes of Health (NIH) investigators only by a study number assigned at GGC. Banked sera from all women who were consecu-tively screened between 13 and 23 weeks’ gestation (mean: 17.6 weeks; SD: 1.5 weeks) during 1996 –2001
were assayed for TC (n ⫽ 9938). Although women in
this cohort delivered primarily at 2 hospitals, for this pilot investigation, ascertainment of hospital charts was limited to women who delivered at the hospital closest
to GGC (composing⬃40% of the total screened cohort).
We defined LMSC pregnancies as those in which mater-nal TC fell below the 10th percentile of the screened
cohort (⬍159 mg/dL, after adjusting the assayed TC
groups. The majority of exclusions in each group were
because of age ⬍21 years, positive smoking history,
and/or pregnancy dating by last menstrual period rather than by ultrasound. The final cohort available for anal-ysis included 118 mothers with low-TC and 940 com-parison mothers classified as having mid-TC or high-TC.
Serum Cholesterol Assays
Frozen sera (⫺80°C) were shipped on dry ice from GGC
to the NIH. TC in serum was analyzed enzymatically by the cholesterol oxidase method on a Hitachi 917 ana-lyzer using reagents from the manufacturer (Roche, In-dianapolis, IN). Both the interassay and intra-assay
co-efficients of variation were⬍5%.
Determination of Eligibility
Baseline data recorded by participants and clinic staff at the time of serum screening were sent to the NIH in anonymized files identified by study codes linked to the serum samples. Eligibility criteria were designed to in-crease uniformity among the study population and to exclude those who were at elevated risk for adverse
pregnancy outcome: we selected participants who were aged 21 to 34 years at screening and had a singleton gestation, race/ethnicity identified as black or white non-Hispanic only, no history of type 1 diabetes, no current or previous smoking, no other described sub-stance use, and no reports of previous abnormal preg-nancy history. Medical charts for the index pregpreg-nancy and its outcome were sought for potentially eligible
women. Mothers who were evaluated for ⬎1 eligible
pregnancy during the screening period had data
in-cluded for 1 randomly selected pregnancy only (n ⫽
112).
As clinical data were reviewed at the NIH, additional patients were excluded when charts indicated significant intercurrent infections or other illness, preeclampsia or other gestational disorders except idiopathic IUGR, sub-stance use, or a genetic syndrome diagnosed in the ne-onate. We also excluded patients with conflicting data regarding GA at delivery or other key outcome variables. Posthoc, we excluded neonates with a structural cardiac defect, because such infants had extremely high rates of IUGR and preterm delivery.
TABLE 1 Ascertainment of Low-TC Risk Group and Higher-TC Control Group
Parameter Maternal Sera Assayed for TC (N⫽9938)
Low-TC Risk Group Selection (975 Pregnancies With Screened Maternal TC
⬍159 mg/dL)
Higher-TC Control Group Selection (8963 Pregnancies With Screened Maternal TC
ⱖ159 mg/dL)
Pa
Retained,
n(%)
Excluded,
n(%)
Retained,
n(%)
Excluded,
n(%)
Maternal chart not retrievedb 519 5814 ⬍.001
Maternal charts reviewed 476 (48.8) 3149 (35.1) ⬍.001
Pregnancies excluded at baseline 313 (65.8) 1940 (61.6) .08
Frequency of individual exclusion
criteriac
Age⬍21 y 183 (38.4) 872 (27.7) ⬍.001
Age⬎34 y 21 (4.4) 144 (4.6) .88
Not dated by ultrasound 89 (18.7) 414 (13.1) .001
Smoking 142 (29.8) 390 (12.4) ⬍.001
Race/ethnicity Hispanic, Asian, or Other 35 (7.4) 69 (2.2) ⬍.001
Pregestational diabetes 15 (3.2) 16 (0.5) ⬍.001
Twin gestation 4 (0.8) 54 (1.7) ⬍.001
⬎1 eligible pregnancy to same
mother
9 (1.9) 45 (1.4) .44
Pregnancy lost to follow-up 47 (9.9) 233 (7.4) .06
Total baseline exclusion criteria 545 (1.7 per excluded individual) 2237 (1.2 per excluded individual) ⬍.001
Maternal and neonatal charts reviewed 163 (34.2) 1209 (38.4) .08
Pregnancies excluded after data review
45 (27.6) 269 (22.2) .13
Substance use, intercurrent illnessd 19 (11.7) 102 (8.4) .17
Fetal deathe 3 (1.8) 24 (2.0) .90
Cardiac malformation 1 (0.6) 7 (0.6) .96
Missing or conflicting data 22 (13.5) 136 (11.2) .40
Total analyzed mother-infant pairs 118 (12.1) 940 (10.5) .12
aAssessed between groups by2analysis.
bMedical charts were retrieved for mothers who delivered at a single hospital convenient to GGC.
cEach exclusion criterion listed separately; total count of exclusion criteria exceeds number of excluded pregnancies. dPreeclamptic pregnancies excluded.
Predictor, Covariate, and Outcome Variables
In addition to analyzing primary data, we generated specific predictor, covariate, and outcome variables to model our results. Because our chief hypothesis con-cerned LMSC as a predictor of adverse pregnancy out-come, we sought to isolate intrinsic differences in ma-ternal TC levels from the introduced component of TC attributable to GA when samples were drawn. It is well established that, in general, maternal TC rises progres-sively with GA from the second trimester forward in pregnancy, with various percentage increases of LDL-C and TC described during the second and third trimesters
by several authors.33,34,55,56For investigation of whether
the increase of TC with GA in our cohort could be expressed as a percentage rise in TC per unit of increase in GA, a model would be required to use logarithms of TC rather than arithmetic values themselves in a linear regression equation. Such log transformations are com-monly applicable to biological variables and have been used in other applications of human TC data, generally
to correct for the nonnormal distribution of TC.57–60The
model that best fit our study data is as follows:
logTC-(adjusted)⫽logTC(raw)⫹slope(17.6⫺GA). This
equa-tion yields a downward adjustment of raw TC values
where GA⬎17.6 and an upward adjustment where GA
⬍ 17.6. The slope values for GA (0.026 for white
women, 0.032 for black women) were significant atP⬍
.0001 in the linear regression model. All TC values that were adjusted via this model represent the expected value of an individual’s TC if it had been sampled at the mean GA of 17.6 (Table 2 gives distributions of raw and adjusted TC). Adjusted TC was examined as a continu-ous and an ordinal variable; however, on the basis of our a priori definition of a low-cholesterol exposure,
most of our analyses used TC ⬍10th percentile as the
risk variable. The outcome of preterm delivery was defined as delivery before 37 completed weeks of ges-tation and term delivery as 37 to 41 completed weeks.
Inspection of the relationship between preterm birth and maternal cholesterol on an ordinal scale (as in Fig 1) revealed a nonlinear relationship with increased prevalence at both tails of the cholesterol distribution. Because previous reports suggested a possibly in-creased risk for prematurity associated with very high
maternal cholesterol,61 we dichotomized cholesterol
risk as ⬍10th percentile versus 10th to 90th
percen-tiles (159 –261 mg/dL). We further defined a variable
dichotomizing cholesterol values ⬎90th percentile
(261 mg/dL) versus values in the 10th to 90th percen-tile range to characterize this posthoc association of elevated serum cholesterol with preterm delivery. The low-TC risk group for prematurity was subdivided into progressively lower levels of TC (less than fifth per-centile, less than third percentile).
We tested potential covariates on the basis of the literature of prematurity and availability of data. Season and year of delivery were evaluated in initial models. Maternal weight at screening was used as a surrogate adjustment for effects that are known to be associated with extremes of BMI, prepregnancy weight, and/or
weight gain in pregnancy.62,63Maternal weight was not
correlated with GA at screening (P⫽.56), so the
mea-sured value at screening was used. Maternal age at screening was used in adjusted models as a categorical variable (ages 21–24, 25–29, and 30 –34). Gender of infant and maternal race were covariates in many mod-els.
We dichotomized outcome variables reflecting fetal growth. Infants who were born at each GA were classi-fied as less than or more than the 5th or 10th percentile
for weight, length, and head circumference.64–66We then
defined IUGR as weight and length both⬍10th
percen-tile for GA, regardless of head circumference. Infants were classified as having microcephaly when the head
circumference was⬎2 SD below the mean for GA (less
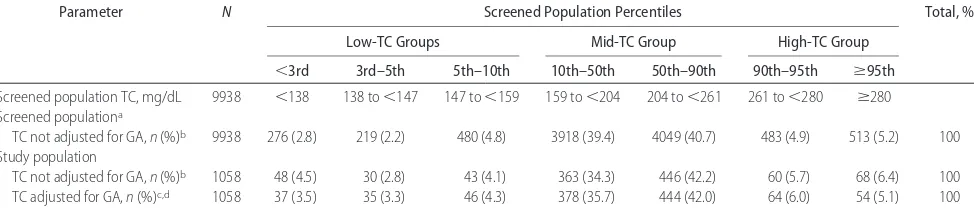
TABLE 2 Distribution of Maternal Serum Cholesterol Values According to Percentile Ranges, as Derived From Screened Pregnant Population and Applied to Study Population
Parameter N Screened Population Percentiles Total, %
Low-TC Groups Mid-TC Group High-TC Group
⬍3rd 3rd–5th 5th–10th 10th–50th 50th–90th 90th–95th ⱖ95th
Screened population TC, mg/dL 9938 ⬍138 138 to⬍147 147 to⬍159 159 to⬍204 204 to⬍261 261 to⬍280 ⱖ280
Screened populationa
TC not adjusted for GA,n(%)b 9938 276 (2.8) 219 (2.2) 480 (4.8) 3918 (39.4) 4049 (40.7) 483 (4.9) 513 (5.2) 100
Study population
TC not adjusted for GA,n(%)b 1058 48 (4.5) 30 (2.8) 43 (4.1) 363 (34.3) 446 (42.2) 60 (5.7) 68 (6.4) 100
TC adjusted for GA,n(%)c,d 1058 37 (3.5) 35 (3.3) 46 (4.3) 378 (35.7) 444 (42.0) 64 (6.0) 54 (5.1) 100
aTC risk groups: low-TC,n⫽975, 9.8%; mid-TC,n⫽7967, 80.1%; high-TC,n⫽996, 10.1%.
bThese lines represent the distribution of TC values as assayed directly (raw values). The GA at which they were obtained range from weeks 13 to 23 (mean: 17.6; SD: 1.5) for the screened population
and from weeks 15 to 23 (mean: 17.7; SD: 1.3) for the study population.
cTC risk groups (by adjusted TC): low-TC,n⫽118, 11.1%; mid-TC,n⫽822, 77.7%; high-TC,n⫽118, 11.1%.
dValues in this line result from adjusting the assayed TC values for GA at which serum was obtained and enumerating the numbers and percentages of mothers in the study population whose
than fifth percentile), whereas the length was ⬎10th percentile.
Analysis
We performed 3 levels of analysis. First, we directly tested our a priori hypotheses, with adjustment for an-ticipated covariates. Results are reported from models that fit the data best. Next, we performed supplemental testing of alternative risk, covariate, and outcome vari-ables to evaluate robustness of the original findings against potential sources of classification error and par-ticularities of model selection. Finally, we conducted posthoc analyses to characterize patterns that were evi-dent in the data but had not been anticipated. All anal-yses were performed using procedures from SAS 8.2
(SAS Institute, Inc, Cary, NC).67 Statistical significance
was assessed by nominalPvalue for a priori hypotheses.
Supplemental testing was not designed to test alternative
hypotheses, so these confidence intervals and P values
were interpreted as descriptive measures characterizing patterns in our data and robustness of primary hypoth-eses.
Relationship of maternal cholesterol to preterm de-livery was assessed by logistic regression models that estimated the odds ratios (ORs), 95% confidence
inter-vals (CIs), and P values associated with preterm birth
among infants of low-TC mothers compared with those with maternal cholesterol values in the mid-TC 10th to 90th percentile range. Models were adjusted for mater-nal race, age category, weight in pounds, infant gender, and presence of IUGR. Secondary analyses tested robust-ness of OR estimates by modifying definitions of key variables. These measures included using as controls only pregnancies with maternal TC between 25th and 75th percentiles (179 –231 mg/dL), examining risks for
delivery atⱕ35 weeks compared with the more
homo-geneous term weeks 39 to 41, replicating key analyses with unadjusted cholesterol values, and incorporating
different covariates. We further characterized maternal subgroups with TC less than fifth and less than third population percentiles (147 and 138 mg/dL, respec-tively). Postterm deliveries were excluded from analyses. Direct measurements of fetal growth at term were tabulated, comparing both low-TC and high-TC groups with the mid-TC reference group. Both univariate and multivariate adjusted models were used to compare size of term infants, excluding those who were classified as
growth-restricted or macrosomic (weight ⬍10th or
⬎90th percentile, examined separately). Multivariate
lo-gistic regression models were used to estimate ORs
as-sociated with microcephaly, IUGR, or size ⬍10th
per-centile for GA.
The rate of congenital anomalies among cohort in-fants was compared between low-TC and control groups
by univariate 2 and multivariate regression analysis.
This was also done for category of anomaly by organ system.
RESULTS
The 1058 mother-infant pairs that were retained for data
analysis represent just ⬎10% each of all LMSC and
higher cholesterol pregnancies that were screened for the original cohort (Table 1). Mothers with LMSC were
more often excluded for age⬍21 years, were more likely
to smoke, and were less likely to have had sonographic gestational dating. Mothers with LMSC in the study group were somewhat younger, heavier, and more likely to be of black race than were control mothers (Table 3). The prevalence of preterm delivery in this highly selected study cohort (6.6%) was considerably less than that observed in the background South Carolina
single-ton population (⬃12% in the sampled counties).68 All
analyses that tested the association of LMSC with pre-term delivery showed statistically significant elevation of risk in analyses that compared mothers with low-TC with mothers with mid-TC (Table 4). Subgroup analyses
<147
<5th 5th 10th to 10th to 25th 25th to 50th 50th to 75th 75th to 90th 90th to >95th95th 147–159 159–179 179–204 204–231 231–261 261–280 >280
Maternal TC percentile and TC values, mg/dL
Prevalence of preterm
b
irth,
%
White mothers Black mothers
0 5 10 15 20 25
Deliveries by cesarean section 7/35
(20)
1/37 (2.7)
6/28 (21.4)
1/18 (5.6)
1/78 (1.3)
3/51 (5.9) 7/151
(4.6) 4/98(4.1) 11/165
(6.7) 5/94 (5.3) 7/140(5.0)
3/45 (6.7)
5/45 (11.1)
1/19 (5.3)
4/35 (11.4)
4/19 (21.1)
FIGURE 1
indicated that this association was present exclusively
among white mothers; black mother-infant pairs
showed no association between LMSC and preterm de-livery in any model (Fig 1, Table 4). Black women showed an excess of preterm delivery exclusively among the high-TC group. This substantial qualitative differ-ence between the races in patterns of prematurity led us to perform additional analyses of this and other birth outcomes separately by race, as posthoc findings. The
unadjusted OR among white mothers with TC ⬍10th
population percentile was 5.22 (95% CI: 2.52–10.8;P⬍
.0001), which increased slightly to 5.63 after adjustment for infant IUGR and gender, maternal age subgroup, and
maternal weight ⬎90th percentile (Table 4). The same
regression model when used to compare the risk for
birth atⱕ35 gestational weeks against birth at weeks 39
to 41 gave similar results (adjusted OR: 6.77; 95% CI:
2.93–15.6;P⬍.0001). All secondary analyses that tested
robustness of preterm findings among white mother-infant pairs gave results comparable to the primary anal-yses. In addition, analyses consistently indicated that maternal cholesterol values less than the third percentile had higher associated risk ratios than the corresponding 5th or 10th percentile thresholds for LMSC (Table 4).
Infants who were born at 37 to 41 weeks to mothers with low TC weighed on average 124 g less than those
who were born to control mothers (P ⫽ .021, 1-way
analysis of variance; Table 5). This difference increased to 147 g with adjustment for specific GA within the term interval, race, infant gender, maternal age group, and
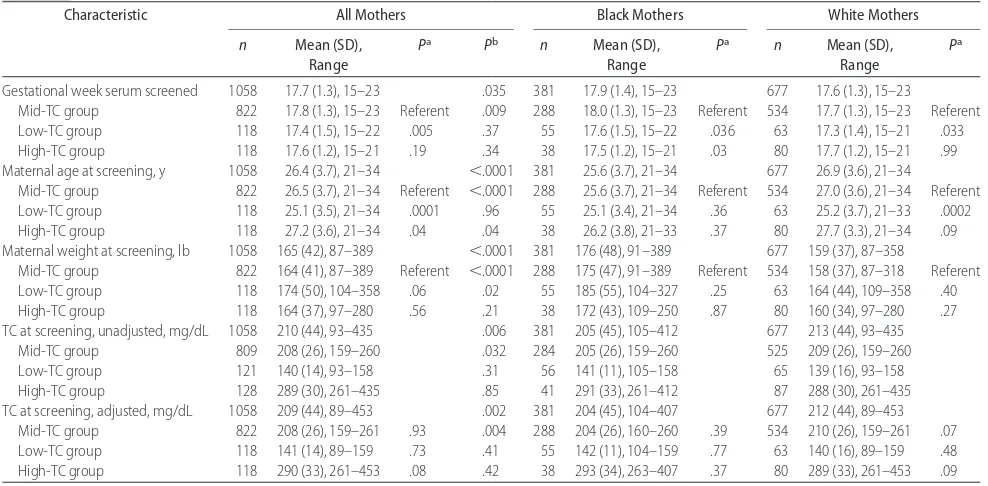
TABLE 3 Maternal Baseline Characteristics According to Serum Cholesterol Level and Race
Characteristic All Mothers Black Mothers White Mothers
n Mean (SD), Range
Pa Pb n Mean (SD), Range
Pa n Mean (SD), Range
Pa
Gestational week serum screened 1058 17.7 (1.3), 15–23 .035 381 17.9 (1.4), 15–23 677 17.6 (1.3), 15–23
Mid-TC group 822 17.8 (1.3), 15–23 Referent .009 288 18.0 (1.3), 15–23 Referent 534 17.7 (1.3), 15–23 Referent
Low-TC group 118 17.4 (1.5), 15–22 .005 .37 55 17.6 (1.5), 15–22 .036 63 17.3 (1.4), 15–21 .033
High-TC group 118 17.6 (1.2), 15–21 .19 .34 38 17.5 (1.2), 15–21 .03 80 17.7 (1.2), 15–21 .99
Maternal age at screening, y 1058 26.4 (3.7), 21–34 ⬍.0001 381 25.6 (3.7), 21–34 677 26.9 (3.6), 21–34
Mid-TC group 822 26.5 (3.7), 21–34 Referent ⬍.0001 288 25.6 (3.7), 21–34 Referent 534 27.0 (3.6), 21–34 Referent
Low-TC group 118 25.1 (3.5), 21–34 .0001 .96 55 25.1 (3.4), 21–34 .36 63 25.2 (3.7), 21–33 .0002
High-TC group 118 27.2 (3.6), 21–34 .04 .04 38 26.2 (3.8), 21–33 .37 80 27.7 (3.3), 21–34 .09
Maternal weight at screening, lb 1058 165 (42), 87–389 ⬍.0001 381 176 (48), 91–389 677 159 (37), 87–358
Mid-TC group 822 164 (41), 87–389 Referent ⬍.0001 288 175 (47), 91–389 Referent 534 158 (37), 87–318 Referent
Low-TC group 118 174 (50), 104–358 .06 .02 55 185 (55), 104–327 .25 63 164 (44), 109–358 .40
High-TC group 118 164 (37), 97–280 .56 .21 38 172 (43), 109–250 .87 80 160 (34), 97–280 .27
TC at screening, unadjusted, mg/dL 1058 210 (44), 93–435 .006 381 205 (45), 105–412 677 213 (44), 93–435
Mid-TC group 809 208 (26), 159–260 .032 284 205 (26), 159–260 525 209 (26), 159–260
Low-TC group 121 140 (14), 93–158 .31 56 141 (11), 105–158 65 139 (16), 93–158
High-TC group 128 289 (30), 261–435 .85 41 291 (33), 261–412 87 288 (30), 261–435
TC at screening, adjusted, mg/dL 1058 209 (44), 89–453 .002 381 204 (45), 104–407 677 212 (44), 89–453
Mid-TC group 822 208 (26), 159–261 .93 .004 288 204 (26), 160–260 .39 534 210 (26), 159–261 .07
Low-TC group 118 141 (14), 89–159 .73 .41 55 142 (11), 104–159 .77 63 140 (16), 89–159 .48
High-TC group 118 290 (33), 261–453 .08 .42 38 293 (34), 263–407 .37 80 289 (33), 261–453 .09
aVersus referent, assessed by 1-way analysis of variance.
bValue for difference between races, assessed by multivariate regression models.
TABLE 4 Prevalence of Preterm Birth and Adjusted Associations of Preterm Birth With Maternal Serum Cholesterol Level According to Maternal Race
Parameter All Mothers Black Mothers White Mothers
n/N
(% Preterm)
OR (95% CI)a Pa n/N (% Preterm)
OR (95% CI)a Pa n/N (% Preterm)
OR (95% CI)a Pa
Preterm birthb 70/1058 (6.6) 22/381 (5.8) 48/677 (7.1)
Mid-TC group 41/822 (5.0) Referent 15/288 (5.2) Referent 26/534 (4.9) Referent
Low-TC group
TC⬍10th percentile 15/118 (12.7) 2.93 (1.54–5.56) .001 2/55 (3.6) 0.81 (0.18–3.74) .79 13/63 (20.6) 5.63 (2.58–12.3) ⬍.0001
TC⬍5th percentile 8/72 (11.1) 2.51 (1.11–5.67) .027 1/37 (2.7) 0.57 (0.07–4.51) .59 7/35 (20.0) 5.32 (1.97–14.3) .001
TC⬍3rd percentile 6/37 (16.2) 3.62 (1.38–9.38) .008 0/16 (0) c c 6/21 (28.6) 7.69 (2.56–23.1) .0003
High-TC group 14/118 (11.9) 2.66 (1.39–5.09) .003 5/38 (13.2) 2.60 (0.84–8.00) .096 9/80 (11.8) 2.74 (1.22–6.18) .015
aAssessed by multivariate logistic regression adjusted for maternal race, maternal weight group (⬍10th, 10th–90th, and⬎90th cohort percentiles), age group (20 –24, 25–29, and 30 –34 years),
infant gender, and presence of IUGR.
bNumbers and prevalence rates of delivery at⬍37 completed weeks’ GA.
maternal weight (P⫽.0006, linear regression, excluding outliers to the normal birth weight distribution). The distributions of infant length and head circumference did not differ in any comparisons of LMSC and control
groups. Macrosomia (weight⬎90th US population
per-centile for GA at term66) was not associated with
mater-nal TC level (P⫽.83,2test for trend). Among preterm
infants, GA was the only significant predictor of size. Infants in the left tail of the size distribution,
measur-ing⬍10th percentile for their GA in weight, length, or
head circumference or meeting the composite definition of IUGR were no more likely to be born to mothers with LMSC than to control mothers (Table 6). This was true whether the thresholds for small size were derived from
1 of several published distributions64,66,69or classified by
internal cohort percentiles. However, maternal TC less than the third percentile was consistently associated with low birth weight. Low maternal weight was the most significant predictor of low birth weight for GA. Microcephaly was approximately twice as prevalent among infants of mothers with LMSC as among infants of control mothers with mid-TC; significance testing in-dicated a trend in adjusted logistic regression (Table 6). Low-TC pregnancies in our study were not more likely than control pregnancies to produce an infant with a congenital anomaly. Infants with anomalies did have markedly increased frequency of either very low or very high maternal TC or maternal weight, as well as all combinations of these extremes (7 of 8 infants with cardiac anomalies and 11 of 15 with other major
anom-alies were born to mothers in the⬍5% or⬎90% tails of
maternal cholesterol and/or maternal weight
distribu-tion [P⬍.0001 in posthoc2analysis]; 7 of these infants
also weighed ⬎90th percentile for GA). There was no
trend toward preterm delivery or IUGR as maternal weight increased in this study group; however, neonatal
weight⬎4000 g was strongly associated with increasing
maternal weight (P⬍.0001,2test for trend).
DISCUSSION
Our data indicate a substantially elevated risk for pre-term delivery among white women whose TC was among the lowest 10% of the background population as sampled at 17 to 18 weeks’ GA. This finding was statis-tically significant in the initial pooled analysis as well and so does not represent exclusively a posthoc sub-group result. Factors that support the validity of this finding include the exceptionally high point estimate for risk for prematurity among mothers with very low ma-ternal cholesterol (138 mg/dL, the third population per-centile of the original screened cohort) and the consis-tent finding that LMSC was the strongest predictor of preterm delivery in every model tested. We considered possible sources of both systematic and random error: confirmatory analyses were conducted to address possi-ble classification error in the assignment of GA, to test
TABLE 5 Comparative Measurements of Term Infants by Maternal Serum Cholesterol Level and Race Parameter All Term Infants ( N ⫽ 958) Black Infants ( N ⫽ 349) White Infants ( N ⫽ 609) n Mean (SD) Unadjusted Difference From Referent P a
Adjusted Difference From Referent
b
P
b
n
Mean (SD) Unadjusted Difference From
Referent
P
a
Adjusted Difference From Referent
b
P
b
n
Mean (SD) Unadjusted Difference From
Referent
P
a
Adjusted Difference From Referent
the robustness of low-TC and higher-TC definitions, and to examine multivariate models for sensitivity to
covari-ate selection and other factors.70–72 All such tests of
ro-bustness yielded consistent, statistically significant risk estimates for prematurity among white mothers with LMSC. Whether this finding can be replicated or ex-tended to other populations of pregnant women will be essential to examine.
Our a priori hypothesis that risk for microcephaly would be increased among infants who are born to mothers with LMSC was not confirmed statistically; however, the presence of a statistical trend and an esti-mated twofold increase in risk is provocative and like-wise deserves additional scrutiny. These data did not support the hypothesized associations of LMSC with size
⬍10th percentile for GA, with the exception of an excess
of infants with low weight for GA among mothers with TC in the lowest subgroup (less than third percentile). There was also a shift toward lower birth weights still within the reference range among term infants who were born to mothers with LMSC. As a posthoc finding, this must be regarded with caution; the additional rela-tive decrease in birth weight among term infants of mothers with LMSC after adjustment for multiple factors that are known to affect birth weight does support its
potential validity. The hypothesized association of LMSC with congenital anomalies was not supported.
The observed association between LMSC and preterm delivery requires validation. If real, then such an asso-ciation could be mediated directly by restricting the availability of substrate for hormonal and nutritional support of early pregnancy, including an effect on
pla-centation.12,18LMSC could also indicate altered
lipopro-tein fractions or apolipoprolipopro-tein profiles, which have been associated with altered pregnancy outcome in var-ious scenarios implicating both maternal and fetal
geno-types.3,23,24,45,73–76 It would be of great interest to know
how commonly TC in the moderately low 5% to 10% range as measured in midpregnancy correlates with a substantially lower value in early pregnancy, which could have affected first-trimester events, or how com-monly LMSC represents a relatively normal periconcep-tional cholesterol level that failed to rise as expected in the second trimester, affecting later events, such as week of delivery. As pregnancy progresses, a reduction in physiologic gestational hypercholesterolemia could af-fect aspects of lipid homeostasis in pregnancy (eg, fetal erythrocyte membranes normally have altered choles-terol concentrations in later pregnancy, with concomi-tant alterations in the function of membrane-based ion
TABLE 6 Adjusted Associations of Small Birth Size for GA With Maternal Serum Cholesterol Level According to Race
Parameter All Infants Black Infants White Infants
n/N(%) OR (95% CI)a Pa n/N(%) OR (95% CI)a Pa n/N(%) OR (95% CI)a Pa
Weight⬍10th percentile for GAb 60/1057 (5.7) 29/381 (7.6) 31/676 (4.6)
Mid-TC group 46/821 (5.6) Referent 22/288 (7.9) Referent 24/533 (4.5) Referent
Low-TC group
TC⬍10th percentile 8/118 (6.8) 1.28 (0.58–2.84) .55 4/55 (7.3) 1.11 (0.36–3.45) .85 4/63 (6.4) 1.41 (0.44–4.44) .56
TC⬍5th percentile 6/72 (8.3) 1.65 (0.66–4.10) .28 3/37 (8.1) 1.35 (0.37–4.94) .65 3/35 (8.6) 1.92 (0.51–7.26) .34
TC⬍3rd percentile 5/37 (13.5) 2.86 (1.03–7.93) .044 2/16 (12.5) 2.00 (0.41–9.76) .39 3/21 (14.3) 3.42 (0.84–13.9) .085
High-TC group 6/118 (5.1) 0.90 (0.37–2.19 .82 3/38 (7.9) 1.14 (0.31–4.27) .84 3/80 (3.8) 0.83 (0.24–2.86) .77
Length⬍10th percentile for GAb 59/1053 (5.6) 26/381 (6.8) 33/672 (4.9)
Mid-TC group 45/820 (5.5) Referent . 21/288 (7.3) Referent 24/532 (4.5) Referent
Low-TC group 9/116 (7.8) 1.40 (0.65–3.03) .39 3/55 (5.5) 0.86 (0.24–3.07) .81 6/61 (9.8) 2.03 (0.74–5.52) .17
High-TC group 5/117 (4.3) 0.71 (0.27–1.88) .49 2/38 (5.3) 0.56 (0.12–2.62) .46 3/79 (3.8) 0.83 (0.24–2.90) .78
HC⬍10th percentile for GAb 198/1053 (18.8) 105/380 (27.6) 93/673 (13.8)
Mid-TC group 156/820 (19.0) Referent 79/288 (27.4) Referent 77/532 (14.5) Referent
Low-TC group 23/115 (20.0) 1.11 (0.66–1.87) .68 15/54 (27.8) 1.17 (0.59–2.32) .65 8/61 (13.1) 0.95 (0.42–2.16) .91
High-TC group 19/118 (16.1) 0.74 (0.42–1.29) .28 11/38 (29.0) 0.91 (0.41–1.99) .81 8/80 (10) 0.62 (0.27–1.42) .26
IUGRc 22/1056 (2.1) 11/381 (2.9) 11/675 (1.6)
Mid-TC group 19/820 (2.3) Referent 10/288 (3.5) Referent 9/532 (1.7) Referent
Low-TC group 2/118 (1.7) 0.68 (0.15–3.09) .61 1/55 (1.8) 0.58 (0.07–4.90) .62 1/63 (1.6) 0.69 (0.07–6.37) .74
High-TC group 1/118 (0.9) 0.34 (0.04–2.59) .29 0/38 (0) —e —e 1/80 (1.3) 0.65 (0.08–5.43) .69
Microcephalyd 23/1053 (2.2) 14/380 (3.7) 9/673 (1.3)
Mid-TC group 16/822 (2.0) Referent 10/288 (3.5) Referent 6/534 (1.1) Referent
Low-TC group 5/115 (4.4) 2.56 (0.87–7.50) .087 3/54 (5.6) 1.91 (0.48–7.58) .36 2/61 (3.3) 3.41 (0.59–19.7) .17
High-TC group 2/118 (1.7) 0.96 (0.21–4.40) .95 1/38 (2.6) 0.70 (0.08–6.02) .74 1/80 (1.3) 1.46 (0.16–13.5) .74
HC indicates head circumference.
aAssessed by multivariate logistic regression models adjusted for infant gender, preterm versus term delivery, maternal weight group, age group, and race (in pooled models). All analyses compare
risk for indicated outcome for low-TC or high-TC mothers compared with the mid-TC reference group.
bAs defined by Fenton.65
cDefined as weight and length both⬍10th percentile for GA, irrespective of head size. dDefined as HC⬍2 SD below mean for GA, with lengthⱖ1 SD below mean.55
channels36). The complex pathways that are associated
with onset of labor may also potentially be affected by
altered steroid balance.49
Although low serum cholesterol level is known to be correlated with poor nutritional status, there was no correlation between maternal TC and maternal weight in this cohort. However, micronutrient deficiencies may be more common among the low-TC risk group studied here and could account for the observed adverse out-comes. Many such nutritional deficiencies have been studied as predictors of preterm delivery or low birth
weight.77–80 Why any of these potential mechanisms
might manifest among white but not black mothers would be critical to address should these findings be
replicated.81,82By contrast, the extremely high risk ratios
observed among mothers with TC below the third pop-ulation percentile suggests a severe and persistent dys-lipidemia, which might exert complex effects
through-out pregnancy.4,83 Our data also indicate a significantly
increased risk for preterm delivery among mothers with
TC ⬎ 90th population percentile (261 mg/dL at 17.6
weeks’ GA). Therefore, the concept of an optimal range for maternal serum cholesterol during pregnancy may have merit.
Limitations are inherent in our methods and findings. The specific numeric thresholds for low and high TC are based on a mean sampling GA of 17.6 weeks and cannot be generalized to other populations with differing pro-files of gestational risk. The ascertainment of potential study subjects was incomplete, and the LMSC group differed in baseline characteristics from the control group: the specific effects of any resulting selection bi-ases cannot be predicted. We did not have access to some sociodemographic variables that are known to correlate with birth outcome, and we collected a subset of rele-vant clinical data commensurate with the goal of deter-mining whether comprehensive prospective studies are indicated. This pilot study had several a priori hypothe-ses, reducing somewhat the statistical impact of the ob-served associations.
Our strict inclusion criteria preclude extrapolation of these results to the general population, yet this design strategy has allowed us to discern an important prelim-inary finding. The strength and consistency of the ele-vated risk for preterm delivery among mothers with LMSC in this study should spur the prospective, longi-tudinal characterization of maternal cholesterol and li-poprotein profiles in subsequent investigations of pre-term birth.
ACKNOWLEDGMENTS
This research was supported by the Division of Intramu-ral Research, National Human Genome Research Insti-tute, NIH, Department of Health and Human Services.
We thank our GGC colleagues Ericka Strickland, RN, for extraction of clinical data from hospital records, Kim
Stewart for preparation of coded serum samples, and Karen Buchanan for compilation of anonymized data sets. We thank our NIH colleagues Robert T. Long for maintenance of serum samples and testing logs, Mau-reen Sampson for performance of all TC assays, and Julia Fekecs for drafting the figure and tables.
REFERENCES
1. Woollett LA. The origins and roles of cholesterol and fatty acids in the fetus.Curr Opin Lipidol.2001;12:305–312
2. Petraglia F, Santuz M, Florio P, et al. Paracrine regulation of human placenta: control of hormonogenesis.J Reprod Immunol.
1998;39:221–233
3. Miller WL. Steroid hormone biosynthesis and actions in the materno-feto-placental unit.Clin Perinatol.1998;25:799 – 817 4. Herrera E. Lipid metabolism in pregnancy and its consequences
in the fetus and newborn.Endocrine.2002;19:43–55
5. Beachy PA, Cooper MK, Young KE, et al. Multiple roles of cholesterol in hedgehog protein biogenesis and signaling.Cold Spring Harb Symp Quant Biol.1997;62:191–204
6. Mauch DH, Nagler K, Schumacher S, et al. CNS synaptogenesis promoted by glia-derived cholesterol. Science. 2001;294: 1354 –1357
7. Kelley RI, Herman GE. Inborn errors of sterol biosynthesis.
Annu Rev Genomics Hum Genet.2001;2:299 –341
8. Goto M, Brickwood S, Wilson DI, Wood PJ, Mason JI, Hanley NA. Steroidogenic enzyme expression within the adrenal cor-tex during early human gestation. Endocr Res. 2002;28: 641– 645
9. Tuckey RC. Progesterone synthesis by the human placenta.
Placenta.2005;26:273–281
10. Henson MC, Shi W, Greene SJ, Reggio BC. Effects of pregnant human, nonpregnant human, and fetal bovine sera on human chorionic gonadotropin, estradiol, and progesterone release by cultured human trophoblast cells. Endocrinology. 1996;137: 2067–2074
11. Knopp RH, Warth MR, Charles D, et al. Lipoprotein metabo-lism in pregnancy, fat transport to the fetus, and the effects of diabetes.Biol Neonate.1986;50:297–317
12. Murphy CR. The plasma membrane transformation of uterine epithelial cells during pregnancy.J Reprod Fertil Suppl. 2000; 55:23–28
13. Woollett LA. Maternal cholesterol in fetal development: trans-port of cholesterol from the maternal to the fetal circulation.
Am J Clin Nutr.2005;82:1155–1161
14. Herrera E, Amusquivar E, Lopez-Soldado I, Ortega H. Maternal lipid metabolism and placental lipid transfer.Horm Res.2006; 65(suppl 3):59 – 64
15. Weissgerber TL, Wolfe LA. Physiological adaptation in early human pregnancy: adaptation to balance maternal-fetal de-mands.Appl Physiol Nutr Metab.2006;31:1–11
16. Sen A, Ghosh PK, Mukherjea M. Changes in lipid composition and fluidity of human placental basal membrane and modula-tion of bilayer protein funcmodula-tions with progress of gestamodula-tion.Mol Cell Biochem.1998;187:183–190
17. Vanderjagt DJ, Patel RJ, El Nafaty AU, Melah GS, Crossey MJ, Glew RH. High-density lipoprotein and homocysteine levels correlate inversely in preeclamptic women in northern Nigeria.
Acta Obstet Gynecol Scand.2004;83:536 –542
18. Murata M, Kodama H, Goto K, Hirano H, Tanaka T. Decreased very-low-density lipoprotein and low-density lipoprotein re-ceptor messenger ribonucleic acid expression in placentas from preeclamptic pregnancies. Am J Obstet Gynecol. 1996;175: 1551–1556
Diabe-tes in Early Pregnancy Study: changes in cholesterol, triglyc-erides, body weight, and blood pressure. The National Institute of Child Health and Human Development—the Diabetes in Early Pregnancy Study.Am J Obstet Gynecol.1992;166:513–518 20. Guizzetti M, Costa LG. Disruption of cholesterol homeostasis in the developing brain as a potential mechanism contributing to the developmental neurotoxicity of ethanol: an hypothesis.
Med Hypotheses.2005;64:563–567
21. Valimaki M, Halmesmaki E, Keso L, Ylikorkala O, Ylikahri R. Serum lipids and lipoproteins in alcoholic women during preg-nancy.Metabolism.1990;39:486 – 493
22. Wadsack C, Hammer A, Levak-Frank S, et al. Selective cho-lesteryl ester uptake from high density lipoprotein by human first trimester and term villous trophoblast cells.Placenta.2003; 24:131–143
23. Descamps OS, Bruniaux M, Guilmot PF, Tonglet R, Heller FR. Lipoprotein concentrations in newborns are associated with allelic variations in their mothers. Atherosclerosis. 2004;172: 287–298
24. Witsch-Baumgartner M, Gruber M, Kraft HG, et al. Maternal apo E genotype is a modifier of the Smith-Lemli-Opitz syn-drome.J Med Genet.2004;41:577–584
25. Madsen EM, Lindegaard ML, Andersen CB, Damm P, Nielsen LB. Human placenta secretes apolipoprotein B-100-containing lipoproteins.J Biol Chem.2004;279:55271–55276
26. Wittmaack FM, Gafvels ME, Bronner M, et al. Localization and regulation of the human very low density lipoprotein/ apolipoprotein-E receptor: trophoblast expression predicts a role for the receptor in placental lipid transport.Endocrinology.
1995;136:340 –348
27. Rindler MJ, Traber MG, Esterman AL, Bersinger NA, Dancis J. Synthesis and secretion of apolipoprotein E by human placenta and choriocarcinoma cell lines.Placenta.1991;12:615– 624 28. Lopez D, McLean MP. Estrogen regulation of the scavenger
receptor class B gene: anti-atherogenic or steroidogenic, is there a priority?Mol Cell Endocrinol.2006;247:22–33
29. Winkler K, Wetzka B, Hoffmann MM, et al. Low density li-poprotein (LDL) subfractions during pregnancy: accumulation of buoyant LDL with advancing gestation. J Clin Endocrinol Metab.2000;85:4543– 4550
30. Alvarez JJ, Montelongo A, Iglesias A, Lasuncion MA, Herrera E. Longitudinal study on lipoprotein profile, high density li-poprotein subclass, and postheparin lipases during gestation in women.J Lipid Res.1996;37:299 –308
31. Brizzi P, Tonolo G, Esposito F, et al. Lipoprotein metabolism during normal pregnancy. Am J Obstet Gynecol. 1999;181: 430 – 434
32. Warth MR, Arky RA, Knopp RH. Lipid metabolism in preg-nancy. II. Altered lipid composition in intermediate, very low, low and high-density lipoprotein fractions.J Clin Endocrinol Metab.1975;41:649 – 655
33. Jimenez DM, Pocovi M, Ramon-Cajal J, Romero MA, Martinez H, Grande F. Longitudinal study of plasma lipids and lipopro-tein cholesterol in normal pregnancy and puerperium.Gynecol Obstet Invest.1988;25:158 –164
34. Desoye G, Schweditsch MO, Pfeiffer KP, Zechner R, Kostner GM. Correlation of hormones with lipid and lipoprotein levels during normal pregnancy and postpartum.J Clin Endocrinol Metab.1987;64:704 –712
35. Qureshi IA, Xi XR, Limbu YR, Bin HY, Chen MI. Hyperlipidae-mia during normal pregnancy, parturition and lactation.Ann Acad Med Singapore.1999;28:217–221
36. Tranquilli AL, Cester N, Giannubilo SR, Corradetti A, Nanetti L, Mazzanti L. Plasma lipids and physicochemical properties of the erythrocyte plasma membrane throughout pregnancy.Acta Obstet Gynecol Scand.2004;83:443– 448
37. Sattar N, Greer IA, Galloway PJ, et al. Lipid and lipoprotein
concentrations in pregnancies complicated by intrauterine growth restriction.J Clin Endocrinol Metab.1999;84:128 –130 38. Wadsack C, Tabano S, Maier A, et al. Intrauterine growth
restriction is associated with alterations in placental lipoprotein receptors and maternal lipoprotein composition.Am J Physiol Endocrinol Metab.2007;292:E476 –E484
39. Napoli C, D’Armiento FP, Mancini FP, et al. Fatty streak for-mation occurs in human fetal aortas and is greatly enhanced by maternal hypercholesterolemia. Intimal accumulation of low density lipoprotein and its oxidation precede monocyte recruit-ment into early atherosclerotic lesions.J Clin Invest.1997;100: 2680 –2690
40. Napoli C, Glass CK, Witztum JL, Deutsch R, D’Armiento FP, Palinski W. Influence of maternal hypercholesterolaemia dur-ing pregnancy on progression of early atherosclerotic lesions in childhood: Fate of Early Lesions in Children (FELIC) study.
Lancet.1999;354:1234 –1241
41. Nabel EG. Cardiovascular disease. N Engl J Med. 2003;349: 60 –72
42. Skilton MR, Evans N, Griffiths KA, Harmer JA, Celermajer DS. Aortic wall thickness in newborns with intrauterine growth restriction.Lancet.2005;365:1484 –1486
43. Coukos G, Gafvels ME, Wittmaack F, et al. Potential roles for the low density lipoprotein receptor family of proteins in im-plantation and placentation. Ann N Y Acad Sci. 1994;734: 91–102
44. Robinson J, Chidzanja S, Kind K, Lok F, Owens P, Owens J. Placental control of fetal growth. Reprod Fertil Dev. 1995;7: 333–344
45. Reis FM, Florio P, Cobellis L, et al. Human placenta as a source of neuroendocrine factors.Biol Neonate.2001;79:150 –156 46. Winkel CA, Snyder JM, MacDonald PC, Simpson ER.
Regula-tion of cholesterol and progesterone synthesis in human pla-cental cells in culture by serum lipoproteins. Endocrinology.
1980;106:1054 –1060
47. Gimpl G, Burger K, Fahrenholz F. Cholesterol as modulator of receptor function.Biochemistry.1997;36:10959 –10974 48. Ramsay JE, Ferrell WR, Crawford L, Wallace AM, Greer IA,
Sattar N. Divergent metabolic and vascular phenotypes in pre-eclampsia and intrauterine growth restriction: relevance of adiposity.J Hypertens.2004;22:2177–2183
49. Norwitz ER, Robinson JN, Challis JR. The control of labor.
N Engl J Med.1999;341:660 – 666
50. Sanchez-Vera I, Bonet B, Viana M, Quintanar A, Lopez-Salva A. Increased low-density lipoprotein susceptibility to oxidation in pregnancies and fetal growth restriction. Obstet Gynecol.
2005;106:345–351
51. Thiele C, Hannah MJ, Fahrenholz F, Huttner WB. Cholesterol binds to synaptophysin and is required for biogenesis of syn-aptic vesicles.Nat Cell Biol.2000;2:42– 49
52. Waterham HR. Inherited disorders of cholesterol biosynthesis.
Clin Genet.2002;61:393– 403
53. Robertson AF, Sprecher H. A review of human placental lipid metabolism and transport. Acta Paediatr Scand. 1968;(suppl 183):3–18
54. Brodsky D, Christou H. Current concepts in intrauterine growth restriction.J Intensive Care Med.2004;19:307–319 55. Potter JM, Nestel PJ. The hyperlipidemia of pregnancy in
nor-mal and complicated pregnancies.Am J Obstet Gynecol.1979; 133:165–170
56. Amundsen AL, Khoury J, Iversen PO, et al. Marked changes in plasma lipids and lipoproteins during pregnancy in women with familial hypercholesterolemia.Atherosclerosis. 2006;189: 451– 457
58. Walker G.Common Statistical Methods for Clinical Research With SAS Examples. Cary, NC: SAS Institute, Inc; 1997
59. Yu Y, Wyszynski DF, Waterworth DM, et al. Multiple QTLs influencing triglyceride and HDL and total cholesterol levels identified in families with atherogenic dyslipidemia.J Lipid Res.
2005;46:2202–2213
60. Elias PK, Elias MF, D’Agostino RB, Sullivan LM, Wolf PA. Serum cholesterol and cognitive performance in the Framing-ham Heart Study.Psychosom Med.2005;67:24 –30
61. Khoury J, Henriksen T, Christophersen B, Tonstad S. Effect of a cholesterol-lowering diet on maternal, cord, and neonatal lipids, and pregnancy outcome: a randomized clinical trial.
Am J Obstet Gynecol.2005;193:1292–1301
62. Clausen T, Burski TK, Oyen N, Godang K, Bollerslev J, Hen-riksen T. Maternal anthropometric and metabolic factors in the first half of pregnancy and risk of neonatal macrosomia in term pregnancies. A prospective study.Eur J Endocrinol.2005;153: 887– 894
63. Ramsay JE, Ferrell WR, Crawford L, Wallace AM, Greer IA, Sattar N. Maternal obesity is associated with dysregulation of metabolic, vascular, and inflammatory pathways.J Clin Endo-crinol Metab.2002;87:4231– 4237
64. Gunn VL, Nechyba C, eds. Nutrition and growth. In: Johns Hopkins: The Harriet Lane Handbook—A Manual for Pediatric House Officers.16th ed. Philadelphia, PA: Mosby; 2002:433–504 65. Fenton TR. A new growth chart for preterm babies: Babson and Benda’s chart updated with recent data and a new format.
BMC Pediatr.2003;3:13–22
66. Zhang J, Bowes WA Jr. Birth-weight-for-gestational-age pat-terns by race, sex, and parity in the United States population.
Obstet Gynecol.1995;86:200 –208
67. The SAS System For Windows[computer program]. Version 8.2. Cary, NC: SAS Institute Inc; 2001
68. National Center for Health Statistics. Final natality data. Available at: www.MarchofDimes.com/peristats [see: Preterm among singleton deliveries: South Carolina, 2001–2004 aver-age (by county) at www.MarchofDimes.com/peristats/level1. aspx?reg⫽45&top⫽3&stop⫽187&lev⫽1&slev⫽4obj⫽18 and Preterm among singleton deliveries: South Carolina, 1994 – 2004 at www.MarchofDimes.com/peristats / level1.aspx?reg⫽ 45&top⫽3&stop⫽187&lev⫽1&slev⫽4obj⫽1]. Accessed August 7, 2007
69. National Center for Health Statistics. Birth to 36 months: boys and girls weight, length and head circumference percentiles.
National Center for Chronic Disease Prevention and Health Promotion. Available at: www.cdc.gov/growthcharts. Accessed June 12, 2006
70. Flegal KM, Keyl PM, Nieto FJ. Differential misclassification arising from nondifferential errors in exposure measurement.
Am J Epidemiol.1991;134:1233–1244
71. Greenland S. Model-based estimation of relative risks and other epidemiologic measures in studies of common outcomes and in case-control studies.Am J Epidemiol.2004;160:301–305 72. Pan Z, Lin DY. Goodness-of-fit methods for generalized linear
mixed models.Biometrics.2005;61:1000 –1009
73. Wright RO, Hu H, Silverman EK, et al. Apolipoprotein E ge-notype predicts 24-month bayley scales infant development score.Pediatr Res.2003;54:819 – 825
74. Utermann G. Apolipoprotein E polymorphism in health and disease.Am Heart J.1987;113:433– 440
75. Pouvreau S, Berthier C, Blaineau S, Amsellem J, Coronado R, Strube C. Membrane cholesterol modulates dihydropyridine receptor function in mice fetal skeletal muscle cells.J Physiol.
2004;555:365–381
76. Craig JE, Savage V, Cowley D, Clague A, Glass IA. Low mater-nal serum oestriol at mid-trimester may indicate a fetal disor-der of cholesterol biosynthesis. Aust N Z J Obstet Gynaecol.
1999;39:249 –251
77. Scholl TO. Iron status during pregnancy: setting the stage for mother and infant.Am J Clin Nutr.2005;81:1218S–1222S 78. Crosby WM, Metcoff J, Costiloe JP, et al. Fetal malnutrition: an
appraisal of correlated factors.Am J Obstet Gynecol.1977;128: 22–31
79. Groenen PM, van Rooij IA, Peer PG, Ocke MC, Zielhuis GA, Steegers-Theunissen RP. Low maternal dietary intakes of iron, magnesium, and niacin are associated with spina bifida in the offspring.J Nutr.2004;134:1516 –1522
80. Lagiou P, Tamimi RM, Mucci LA, Adami HO, Hsieh CC, Tricho-poulos D. Diet during pregnancy in relation to maternal weight gain and birth size.Eur J Clin Nutr.2004;58:231–237 81. Gennaro S. Overview of current state of research on pregnancy
outcomes in minority populations.Am J Obstet Gynecol.2005; 192:S3–S10
82. Collins FS. What we do and don’t know about ‘race,’ ‘ethnic-ity,’ genetics and health at the dawn of the genome era.Nat Genet.2004;36:S13–S15
83. Pepe GJ, Albrecht ED. Regulation of the primate fetal adrenal cortex.Endocr Rev.1990;11:151–176
RANDOMIZED CLINICAL TRIALS
Pediatricsrequires investigators to register their clinical trials in a public trials registry. The members of the International Committee of Medical Journal Editors (ICMJE) will consider most clinical trials for publication only if they
have been registered (see N Engl J Med. 2004;351:1250 –1251). Current
DOI: 10.1542/peds.2006-1939
2007;120;723
Pediatrics
Stevenson and Maximilian Muenke
Robin J. Edison, Kate Berg, Alan Remaley, Richard Kelley, Charles Rotimi, Roger E.
Adverse Birth Outcome Among Mothers With Low Serum Cholesterol
Services
Updated Information &
http://pediatrics.aappublications.org/content/120/4/723
including high resolution figures, can be found at:
References
http://pediatrics.aappublications.org/content/120/4/723#BIBL
This article cites 77 articles, 11 of which you can access for free at:
Subspecialty Collections
sub
http://www.aappublications.org/cgi/collection/fetus:newborn_infant_ Fetus/Newborn Infant
following collection(s):
This article, along with others on similar topics, appears in the
Permissions & Licensing
http://www.aappublications.org/site/misc/Permissions.xhtml
in its entirety can be found online at:
Information about reproducing this article in parts (figures, tables) or
Reprints
http://www.aappublications.org/site/misc/reprints.xhtml
DOI: 10.1542/peds.2006-1939
2007;120;723
Pediatrics
Stevenson and Maximilian Muenke
Robin J. Edison, Kate Berg, Alan Remaley, Richard Kelley, Charles Rotimi, Roger E.
Adverse Birth Outcome Among Mothers With Low Serum Cholesterol
http://pediatrics.aappublications.org/content/120/4/723
located on the World Wide Web at:
The online version of this article, along with updated information and services, is
by the American Academy of Pediatrics. All rights reserved. Print ISSN: 1073-0397.