Young Maternal Age and Poor Child Development:
Predictive Validity From a Birth Cohort
WHAT’S KNOWN ON THIS SUBJECT: Teen-aged mothers and their children are targeted by policies and programs aimed at improving child development. Teenage motherhood may be a risk factor for poor childhood development, but it may be an
inaccurate criterion for predicting risk of developmental outcomes.
WHAT THIS STUDY ADDS: To reach the goal of improving child development outcomes across the population, factors such as maternal education level, financial difficulties, smoking, and depression during pregnancy should be considered in addition to young maternal age when recruiting women to preventive programs.
abstract
OBJECTIVE:We aimed to examine the ability of mother’s age, and other factors measured during pregnancy (education, financial difficulties, partner status, smoking, and depression), to predict child develop-ment outcomes up to age 5 years.
METHODS:Data were obtained from the Avon Longitudinal Study of Parents and Children (ALSPAC). Poor child development was defined as scoring in the worst 10% of a parent-reported ALSPAC developmental scale (ADS) at 18 months (n⫽7546), the Strengths and Difficulties Questionnaire (SDQ) at 47 months (n ⫽8328), or teacher-reported School Entry Assessment (SEA) scores at 4 to 5 years (n⫽7345).
RESULTS:Only a small proportion of children with poor development had mothers aged younger than 20 years at their birth (3.3%, 6.4%, and 9.2%, for the ADS, SDQ, and SEA, respectively). A greater proportion with each measure of poor development would be identified (48.9%, 63.6%, and 74.4%, respectively) if all 6 predictors were used and a woman had at least 1 of these. Model discrimination was poor using maternal age only (area under the receiver operator characteristic curve⬃0.5 for all 3 outcomes). This improved when all 6 predictors were included in the model (ADS: 0.56; SDQ: 0.66; SEA: 0.67). Calibration also improved with the model including all 6 predictors.
CONCLUSIONS:Even if programs targeted at teen-aged mothers are successful in improving child development, they will have little impact on population levels of poor child development if young maternal age is the sole or main means of identifying eligibility for the program.
Pediatrics2011;127:e1436–e1444
AUTHORS:Catherine R. Chittleborough, PhD,a,bDebbie A.
Lawlor, PhD, MB, ChB,a,cand John W. Lynch, PhDa,b,d
aSchool of Social and Community Medicine, University of Bristol,
Bristol, United Kingdom;bSchool of Population Health and
Clinical Practice, University of Adelaide, Adelaide, Australia;
cMRC Centre for Causal Analysis in Translational Epidemiology,
University of Bristol, Bristol, United Kingdom; anddSansom
Institute for Health Research, Division of Health Sciences, University of South Australia, Adelaide, Australia
KEY WORDS
ALSPAC, child development, maternal age, maternal health services, predictive value of tests
ABBREVIATIONS
ALSPAC—Avon Longitudinal Study of Parents and Children ADS—ALSPAC developmental scale
SDQ—Strengths and Difficulties Questionnaire SEA—School Entry Assessment
EPDS—Edinburgh Postnatal Depression Scale PPV—positive predictive value
AUROC—area under the receiver operator characteristic curve All authors contributed to the conceptual development, analysis plan, and interpretation of results. Dr Chittleborough undertook the analyses and wrote the first draft of the paper. Drs Lawlor and Lynch contributed later drafts. All authors approve the final version to be published and take responsibility for the analyses of data collected and provided by ALSPAC and act as guarantors. www.pediatrics.org/cgi/doi/10.1542/peds.2010-3222
doi:10.1542/peds.2010-3222 Accepted for publication Feb 1, 2011
Address correspondence to Catherine R. Chittleborough, PhD, School of Social and Community Medicine, University of Bristol, Canynge Hall, Whatley Road, Bristol BS8 2PS United Kingdom. E-mail: [email protected]
PEDIATRICS (ISSN Numbers: Print, 0031-4005; Online, 1098-4275). Copyright © 2011 by the American Academy of Pediatrics
The highest priority recommendation in the recent Marmot Review to reduce health inequalities was to give every child the best start in life,1with actions
that are universal “but with a scale and intensity that is proportionate to the level of disadvantage”1 so that more
support goes to those with greater need. This progressive universalism is challenging for early child development services because an accurate method of identifying those most in need has to be balanced against efficient use of limited resources and the risk of stigmatizing mothers and families who may be la-beled as poor parents.2–7
Programs such as the Family Nurse Partnership in the United Kingdom,8
Family Home Visiting in Australia,9and
Nurse Family Partnership in the United States10 offer extended services
be-yond immediate postnatal contact to “vulnerable” families often identified by maternal age, with mothers aged
⬍20 years eligible for the program.8,9
Although teen-age motherhood can be an important risk factor for poor child-hood development,11,12it may be an
in-accurate predictor of developmental risk in children.13Other risk factors in
combination might improve identifica-tion of those at greatest risk of poorer development. If such additional factors were routinely obtainable in the ante-natal or early postante-natal period, they would increase the ability to effectively target limited program resources to those most likely to benefit. The pres-ent study examines the predictive va-lidity of young maternal age (⬍20 years) and 5 other factors (maternal education, financial difficulties, partner status, smoking during pregnancy, and depression) in predicting poor develop-ment in childhood up to age 5 years.
METHODS
The Avon Longitudinal Study of Parents and Children (ALSPAC) is a prospec-tive, geographically representative
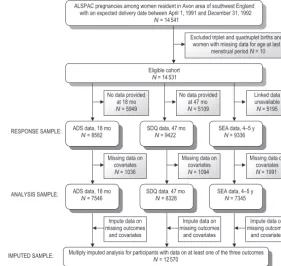
study of children born to women res-ident in the Avon area of southwest England with an expected delivery date between April 1, 1991, and De-cember 31, 1992. Details of the back-ground, methods, recruitment, and re-sponse rates have been reported elsewhere (www.bristol.ac.uk/alspac/).14
The core ALSPAC sample consists of 14 541 pregnancies (Fig 1). Ethical ap-proval was obtained from the ALSPAC Law and Ethics committee and local re-search ethics committees.
Child Outcomes
Child developmental abilities at 18 months were assessed using the ALSPAC developmental scale (ADS), created using items derived from the Denver Developmental Screening Test shown to be most predictive of devel-opmental abnormality.15 Because
many of the Denver items were de-signed to be observed by trained exam-iners, the ADS was adapted for paren-tal report after focus group piloting with members of the ALSPAC cohort.
Parents reported whether their child could do 56 activities within 4 develop-mental domains (gross motor, fine mo-tor, communication, and social skills). The number of passes, indicated by “yes, can do well” responses, was summed in each of the 4 subscales, and the total development score was summed across subscales. Age for completion of the ADS was restricted to an 8-week window around 18 months given the developmental age-specific nature of the questions.16
The parent version of the Strengths and Difficulties Questionnaire (SDQ)17
was completed by the main caregiver (usually the mother) when the child was 47 months old, using a scale from 1 to 3 (does not apply, applies some-what, definitely applies). The scale con-sisted of 25 items in 5 subscales (prosocial behavior, hyperactivity, emotional symptoms, conduct prob-lems, and peer problems). A total diffi-culties score was created by summing the scores from the last 4 subscales. ALSPAC pregnancies among women resident in Avon area of southwest England
with an expected delivery date between April 1, 1991 and December 31, 1992
N = 14 541
Eligible cohort
N = 14 531
Excluded triplet and quadruplet births and women with missing data for age at last
menstrual period N = 10
No data provided at 47 mo
N = 5109 No data provided
at 18 mo
N = 5949
Linked data unavailable
N = 5195
Missing data on covariates
N = 1036
Missing data on covariates
N = 1094
Missing data on covariates
N = 1991 ADS data, 18 mo
N = 8582
SDQ data, 47 mo
N = 9422
SEA data, 4–5 y
N = 9336
ADS data, 18 mo
N = 7546
SDQ data, 47 mo
N = 8328
SEA data, 4–5 y
N = 7345
Multiply imputed analysis for participants with data on at least one of the three outcomes
N = 12 570 RESPONSE SAMPLE:
ANALYSIS SAMPLE:
IMPUTED SAMPLE:
Impute data on missing outcomes
and covariates
Impute data on missing outcomes
and covariates
Impute data on missing outcomes
and covariates
FIGURE 1
The prosocial subscale was excluded because it measures positive aspects of behavior. High scores on the SDQ have been shown to be predictive of psychiatric disorders among children.18
Children were rated by their teacher in the School Entry Assessment (SEA) dur-ing the first half of their first term in re-ception class at ages 4 to 5 years.19This
assessment is undertaken in all recep-tion classes in England, and scores for ALSPAC participants were obtained through consented record linkage with data provided by local education author-ities. Integer scores between 2 and 7 on each of 4 required scales (language, reading, writing, and mathematics) were summed to provide a total SEA score.
Potential Predictors of Childhood Development Problems
Age of mother at last menstrual period was obtained for 14 531 women (Fig 1) and dichotomized at younger than 20 years, the cutoff point commonly used to identify mothers eligible for pro-grams.8,9Highest education level was
categorized into “O level or higher” (where O level is ordinary level exami-nations most commonly taken at 16 years of age, the legal minimum age for leaving school in the United King-dom) and “less than O level” (Certifi-cate of Secondary Education com-monly taken at age 16 years by individuals considered to be unable to obtain an O level in that subject, a vo-cational qualification, or no educa-tional qualifications). The financial dif-ficulties factor was assessed using 5 questions asking how difficult the mother found it to afford food, cloth-ing, heatcloth-ing, rent or mortgage, and things she will need for the infant, with a score of 1 (very difficult) to 4 (not difficult) for each response. The algo-rithm for calculating the overall finan-cial difficulties score was 20 minus the sum of the scores of each of the 5
items, resulting in an overall score in which 0 represented no financial diffi-culties and 15 the maximum financial difficulties. Participants scoring ⬎8 were defined as experiencing financial difficulties.20 Partner status at study
enrollment (married or cohabitating versus no partner or not living with partner) and whether women had smoked during the first 3 months of their pregnancy were assessed by us-ing a questionnaire.
Ten items that formed the depression scale of the Edinburgh Postnatal De-pression Scale (EPDS)21,22were
admin-istered via questionnaire at 18 to 20 weeks’ gestation. None of the 10 items is specific to the postnatal experience, and this scale has been validated for use postnatally and during pregnan-cy.23–25Each question had 4 response
categories scored from 0 to 3 and re-ferred to the feelings of the mother in the past week. A score⬎12 is used to indicate probable depressive disorder.21
Analysis
Distributions of continuous outcome variables were skewed and so each distribution was dichotomized, with the lower tail (or upper for SDQ) con-taining 10% of those with the poorest child developmental outcome.16,17
We calculated the proportion of chil-dren with poor developmental out-comes whose mothers had each of the individual binary predictive factors, and also whose mothers had at least 1 and at least 2 of the 6 binary predic-tors. Specificity, positive predictive value (PPV) and likelihood ratio of each binary predictor were calculated (Sup-plemental Table 5). Univariable and multivariable (with mutual adjustment for all other predictors) logistic re-gression examined associations of predictors with each child outcome. The predicted probability of poor child development was calculated from these regression models. In clinical
practice, the predictors would likely be used as binary variables, but because calibration statistics cannot be easily in-terpreted using a single binary predic-tor, maternal age, financial difficulties, and EPDS score were included as contin-uous variables in the prediction models.
The area under the receiver operator characteristic curve (AUROC) was used to assess the discriminatory ca-pability of the models, or how accu-rately each model separates mothers into those with and without children with poor outcomes. Model 1 con-tained only maternal age; model 2 in-cluded all 6 predictors. An AUROC of 1 represents a model that perfectly dis-criminates the outcome; an AUROC of 0.5 represents a prediction tool that is no better than chance at identifying those at risk. AUROCs were also calcu-lated using all binary predictor vari-ables, as would be more commonly used in clinical practice, and these were lower but consistent with predic-tive models that included continuous variables (data not shown).
Calibration of the 2 models, or the agreement between observed and pre-dicted outcomes, was assessed by ranking mothers into deciles of their predicted risk and comparing the pre-dicted to observed proportion within each decile. The Hosmer-Lemeshow goodness-of-fit2statistic was used to
test the accuracy of calibration.26This
statistic tests the null hypothesis that the predicted proportion equals the observed proportion within ranked groupings (deciles) of predicted risk. A highPvalue suggests good calibration of predicted and observed risk.
The integrated discrimination im-provement27 for model 2 compared
chil-dren do not have poor development. The integrated discrimination im-provement is greater when the second model correctly assigns individuals to higher or lower probabilities of having the outcome in comparison to the first model.
Missing Data
Sensitivity analyses were conducted on an imputed data set to examine the influence of missing data on the find-ings. Multiple imputation by chained equation was used to impute missing data on child outcomes and predictors for respondents who had data on at least 1 child outcome (N⫽12 570; Fig 1) using the ice command in Stata (Stata Corp, College Station, TX).28The
imputation model included all child outcomes and predictors as well as predictors of missingness (birth weight, parity, social class, ethnicity,
and reaction to pregnancy). We gener-ated 20 data sets and undertook 20 cy-cles of regression switching.28Table 1
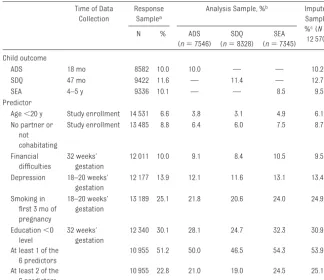
shows the prevalence and amount of data available for each child outcome and predictor.
RESULTS
Table 2 displays the proportion of chil-dren with poor development whose
mothers had each predictive factor. A small proportion of children with poor development had mothers aged ⬍20 (3.3%, 6.4%, and 9.2% for ADS, SDQ, and SEA, respectively). High proportions of poor development could be identified if information on all 6 predictors was used and a woman had at least 1 of these predictors (48.9%, 63.6%, and 74.4% for ADS, SDQ, and SEA). The pre-dictor that alone identified the highest proportion of each child outcome was mother’s low education.
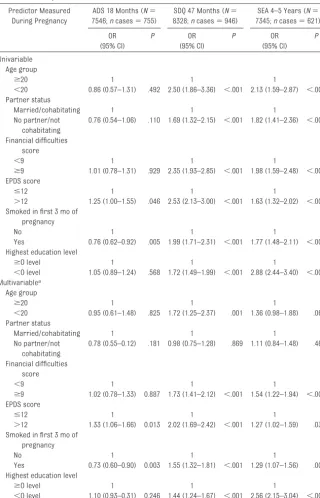
Table 3 shows univariable and multi-variable associations between the potential predictors and child develop-mental outcomes. Associations be-tween the potential predictors and child outcomes using the multiply im-puted data set (Supplemental Table 6) were consistent with analyses of com-plete cases.
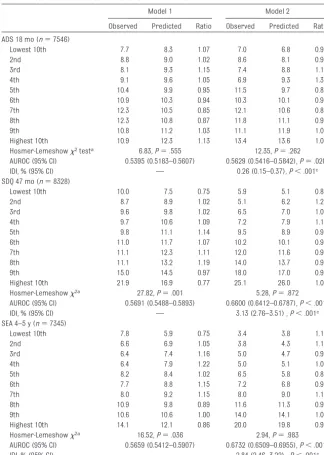
Table 4 shows calibration and discrim-ination for both models. Discrimina-tion was poor using model 1 (maternal age only). This finding improved a little for ADS and more so for SDQ and SEA when all 6 predictors were used in model 2. AUROC values calculated us-ing the multiply imputed data set (Sup-plemental Table 7) were consistent with complete case analyses. The Hosmer-Lemeshow goodness-of-fit tests indicated better calibration using model 2 than model 1 for SDQ and SEA, whereas both models showed good calibration for ADS. Model 1
underesti-TABLE 1 Prevalence and Amount of Data Available for Each Child Outcome and Potential Predictor Measured During Pregnancy
Time of Data Collection
Response Samplea
Analysis Sample, %b Imputed
Sample, %c(N⫽
12 570)
N % ADS
(n⫽7546) SDQ (n⫽8328)
SEA (n⫽7345) Child outcome
ADS 18 mo 8582 10.0 10.0 — — 10.2
SDQ 47 mo 9422 11.6 — 11.4 — 12.7
SEA 4–5 y 9336 10.1 — — 8.5 9.5
Predictor
Age⬍20 y Study enrollment 14 531 6.6 3.8 3.1 4.9 6.1 No partner or
not cohabitating
Study enrollment 13 485 8.8 6.4 6.0 7.5 8.7
Financial difficulties
32 weeks’ gestation
12 011 10.0 9.1 8.4 10.5 9.5
Depression 18–20 weeks’ gestation
12 177 13.9 12.1 11.6 13.1 13.4
Smoking in first 3 mo of pregnancy
18–20 weeks’ gestation
13 189 25.1 21.8 20.6 24.0 24.9
Education⬍O level
32 weeks’ gestation
12 340 30.1 28.1 24.7 32.3 30.9
At least 1 of the 6 predictors
10 955 51.2 50.0 46.5 54.3 53.9
At least 2 of the 6 predictors
10 955 22.8 21.0 19.0 24.5 25.1
aResponse sample is the number who responded to specific questionnaire/assessment for each child outcome or predictor. bAnalysis sample includes respondents with complete data on the relevant child outcome and all 6 predictors. cImputed sample includes data imputed on child outcomes or predictors for participants who provided data on at least 1 of the 3 child outcomes.
TABLE 2 Proportion of Child Outcome Cases That Would be Detected With Potential Predictors Measured During Pregnancy
Predictor Measured During Pregnancy
ADS 18 Months (N⫽7546;
ncases⫽755), %
SDQ 47 Months (N⫽8328;
ncases⫽946), %
SEA 4–5 Years (N⫽7345;
ncases⫽621), %
Age⬍20 y 3.3 6.4 9.2
No partner or not cohabitating 5.0 9.1 12.2
Financial difficulties 9.1 16.0 17.7
Depression 14.3 22.3 19.0
Smoking 17.7 31.9 34.6
Education⬍O level 29.0 34.5 55.4
mated the likelihood of poor develop-ment according to SDQ and SEA among those at highest risk (Table 4 and Fig 2). Integrated discrimination improve-ments indicated that model 2 resulted in an improvement in calibration over model 1, particularly for SDQ and SEA with⬃3% of the children being
cor-rectly reclassified by model 2 com-pared with model 1.
DISCUSSION
The main finding of our study is that programs, which have been shown to be effective at improving child develop-ment, will have little impact on child
development outcomes at the popula-tion level if young maternal age is used as the sole or main criterion for iden-tifying eligible mothers. This finding is sound because, in general the propor-tion of births to women aged 15 to 19 years is low, at 6.1% of live births in England and Wales in 2009,2910.2% of
births in the United States in 200630
and 4.2% of births in Australia in 2008.31Therefore, only a small
propor-tion of children with poor development have teen-aged mothers. Maternal age
⬍20 years identifies only 9% of the cases of poor development at 5 years, whereas 74% of these cases would be identified among mothers withⱖ1 of the 6 predictors, and 44% would be identified among mothers withⱖ2 of the 6 predictors. If the 23% of women experiencingⱖ2 of these characteris-tics could be engaged in programs aimed at supporting the development of their children, 44% of cases of poor child development at school entry could be identified and potentially prevented. Furthermore, a model in-cluding all predictors provides bet-ter discrimination and calibration for predicting these child outcomes than a model based solely on moth-er’s age. Mothmoth-er’s low education is the single characteristic that ac-counts for the highest proportion of cases of poor child development, from almost 30% at 18 months to 58% at 4 to 5 years. Low education is more common than teen-age moth-erhood in the population, and par-ents with higher levels of education are thought to positively influence their children’s academic achieve-ment through use of more varied and complex language and reading inter-actions, and exposing children to in-creased educational opportunities.32
The strengths of this study are the large sample size and longitudinal de-sign with inclusion of a large number of relevant predictors measured
dur-TABLE 3 Univariable and Multivariable Associations of Potential Predictors With Child Developmental Outcomes
Predictor Measured During Pregnancy
ADS 18 Months (N⫽
7546;ncases⫽755)
SDQ 47 Months (N⫽
8328;ncases⫽946)
SEA 4–5 Years (N⫽
7345;ncases⫽621) OR
(95% CI)
P OR
(95% CI)
P OR
(95% CI)
P
Univariable Age group
ⱖ20 1 1 1
⬍20 0.86 (0.57–1.31) .492 2.50 (1.86–3.36) ⬍.001 2.13 (1.59–2.87) ⬍.001 Partner status
Married/cohabitating 1 1 1
No partner/not cohabitating
0.76 (0.54–1.06) .110 1.69 (1.32–2.15) ⬍.001 1.82 (1.41–2.36) ⬍.001
Financial difficulties score
⬍9 1 1 1
ⱖ9 1.01 (0.78–1.31) .929 2.35 (1.93–2.85) ⬍.001 1.98 (1.59–2.48) ⬍.001 EPDS score
ⱕ12 1 1 1
⬎12 1.25 (1.00–1.55) .046 2.53 (2.13–3.00) ⬍.001 1.63 (1.32–2.02) ⬍.001 Smoked in first 3 mo of
pregnancy
No 1 1 1
Yes 0.76 (0.62–0.92) .005 1.99 (1.71–2.31) ⬍.001 1.77 (1.48–2.11) ⬍.001 Highest education level
ⱖO level 1 1 1
⬍O level 1.05 (0.89–1.24) .568 1.72 (1.49–1.99) ⬍.001 2.88 (2.44–3.40) ⬍.001 Multivariablea
Age group
ⱖ20 1 1 1
⬍20 0.95 (0.61–1.48) .825 1.72 (1.25–2.37) .001 1.36 (0.98–1.88) .062 Partner status
Married/cohabitating 1 1 1
No partner/not cohabitating
0.78 (0.55–0.12) .181 0.98 (0.75–1.28) .869 1.11 (0.84–1.48) .465
Financial difficulties score
⬍9 1 1 1
ⱖ9 1.02 (0.78–1.33) 0.887 1.73 (1.41–2.12) ⬍.001 1.54 (1.22–1.94) ⬍.001 EPDS score
ⱕ12 1 1 1
⬎12 1.33 (1.06–1.66) 0.013 2.02 (1.69–2.42) ⬍.001 1.27 (1.02–1.59) .036 Smoked in first 3 mo of
pregnancy
No 1 1 1
Yes 0.73 (0.60–0.90) 0.003 1.55 (1.32–1.81) ⬍.001 1.29 (1.07–1.56) .007 Highest education level
ⱖO level 1 1 1
⬍O level 1.10 (0.93–0.31) 0.246 1.44 (1.24–1.67) ⬍.001 2.56 (2.15–3.04) ⬍.001 OR indicates odds ratio; CI, confidence interval.
ing pregnancy. Self-reported smoking status may underestimate smoking prevalence among pregnant women,33
but self-reported smoking still contrib-uted to the prediction of poor child de-velopment and reflects the clinical sit-uation in which pregnant women report their smoking status at antena-tal consultations. Given that calibra-tion cannot be assessed with a single
binary predictor, we used the continu-ous age variable, which may underes-timate the poor calibration of mater-nal age with a cutoff⬍20 years, as is used in practice. Reduced power from cohort attrition is not a major problem in a study of this size, and analyses us-ing multivariate multiple imputation produced similar results to complete case analyses, suggesting little bias
due to missing data. Societal changes (eg, downward trends in the propor-tion of births to young mothers,29
smoking during pregnancy,34 and
in-creased participation of young people in higher education35) mean that our
findings do not necessarily generalize to more contemporary populations or those from other countries. However, our conclusion that young maternal age is likely to identify only a small pro-portion of children with developmental problems is likely to hold across most high-income countries where the prev-alence of young maternal age is low. Differences in prediction between the SDQ and SEA, despite being measured at similar ages, reflect the fact that children with behavioral difficulties (as reported by parents) were not nec-essarily the same group as those with poor SEA scores (as assessed by teachers).
Association of mother’s age, and other factors, with child development out-comes have been shown previous-ly11,36–38but this is the first study, to our
knowledge, to demonstrate discrimi-nation, calibration, and sensitivity of these maternal factors in predicting child development. Such analyses may more directly inform targeting of pro-grams to support parenting and child development. An analysis of the UK Mil-lennium Cohort Study found that ap-proximately one quarter of children with poor development and behavior would be identified among the 10% of children with the highest risk, as pre-dicted by a model using many predic-tors, including depression, smoking during pregnancy, educational qualifi-cations, and socioeconomic position.38
Higher AUROC values (⬃0.80) for pre-dicting poor child development at age 5 years than we have found were sub-sequently reported.39These prediction
models included, in addition to the characteristics we examined, birth weight, gender, and breastfeeding,
TABLE 4 Calibration and Discrimination of the 2 Models
Model 1 Model 2
Observed Predicted Ratio Observed Predicted Ratio ADS 18 mo (n⫽7546)
Lowest 10th 7.7 8.3 1.07 7.0 6.8 0.98
2nd 8.8 9.0 1.02 8.6 8.1 0.94
3rd 8.1 9.3 1.15 7.4 8.8 1.19
4th 9.1 9.6 1.05 6.9 9.3 1.35
5th 10.4 9.9 0.95 11.5 9.7 0.85
6th 10.9 10.3 0.94 10.3 10.1 0.98
7th 12.3 10.5 0.85 12.1 10.6 0.88
8th 12.3 10.8 0.87 11.8 11.1 0.95
9th 10.8 11.2 1.03 11.1 11.9 1.07
Highest 10th 10.9 12.3 1.13 13.4 13.6 1.01 Hosmer-Lemeshow2testa 6.83,P⫽.555 12.35,P⫽.262
AUROC (95% CI) 0.5395 (0.5183–0.5607) 0.5629 (0.5416–0.5842),P⫽.020b
IDI, % (95% CI) — 0.26 (0.15–0.37),P⬍.001c
SDQ 47 mo (n⫽8328)
Lowest 10th 10.0 7.5 0.75 5.9 5.1 0.86
2nd 8.7 8.9 1.02 5.1 6.2 1.21
3rd 9.6 9.8 1.02 6.5 7.0 1.09
4th 9.7 10.6 1.09 7.2 7.9 1.10
5th 9.8 11.1 1.14 9.5 8.9 0.94
6th 11.0 11.7 1.07 10.2 10.1 0.99
7th 11.1 12.3 1.11 12.0 11.6 0.97
8th 11.1 13.2 1.19 14.0 13.7 0.98
9th 15.0 14.5 0.97 18.0 17.0 0.94
Highest 10th 21.9 16.9 0.77 25.1 26.0 1.03 Hosmer-Lemeshow2a 27.82,P⫽.001 5.28,P⫽.872
AUROC (95% CI) 0.5691 (0.5488–0.5893) 0.6600 (0.6412–0.6787),P⬍.001b
IDI, % (95% CI) — 3.13 (2.76–3.51) ,P⬍.001c
SEA 4–5 y (n⫽7345)
Lowest 10th 7.8 5.9 0.75 3.4 3.8 1.13
2nd 6.6 6.9 1.05 3.8 4.3 1.13
3rd 6.4 7.4 1.16 5.0 4.7 0.93
4th 6.4 7.9 1.22 5.0 5.1 1.03
5th 8.2 8.4 1.02 6.5 5.8 0.88
6th 7.7 8.8 1.15 7.2 6.8 0.94
7th 8.0 9.2 1.15 8.0 9.0 1.12
8th 10.9 9.8 0.89 11.6 11.3 0.97
9th 10.6 10.6 1.00 14.0 14.1 1.01
Highest 10th 14.1 12.1 0.86 20.0 19.8 0.99 Hosmer-Lemeshow2a 16.52,P⫽.036 2.94,P⫽.983
AUROC (95% CI) 0.5659 (0.5412–0.5907) 0.6732 (0.6509–0.6955),P⬍.001b
IDI, % (95% CI) 2.84 (2.46–3.22) ,P⬍.001c
Model 1, maternal age; Model 2, maternal age, highest education level⬍O level, financial difficulties score, no partner or not cohabitating, smoked in first 3 months of pregnancy, and EPDS score. IDI, integrated discrimination improvement. aPvalue tests null hypothesis that the predicted proportion equals the observed proportion within deciles. bPvalue tests null hypothesis that there is no difference in the AUROC of model 1 and model 2.
which we did not include because these factors would be unavailable for selecting women for programs during pregnancy.
Although a broader range of risk fac-tors may more accurately identify mothers whose children are at high risk of poor development, there are
many issues to consider. First, collec-tion of all of the characteristics would need to be feasible in routine clinical settings and acceptable to pregnant
2
l
e
d
o
M
1
l
e
d
o
M
ALSPAC developmental scale 18m
Strengths and Difficulties Questionnaire 47m
School Entry Assessment 4-5y
.06 .08 .1 .12 .14
.08 .09 .1 .11 .12
predicted (proportion) observed
predicted
.06 .08 .1 .12 .14
.06 .08 .1 .12 .14
predicted (proportion) observed
predicted
.05 .1 .15 .2 .25
.08 .1 .12 .14 .16 .18
predicted (proportion) observed
predicted
.05 .1 .15 .2 .25
.05 .1 .15 .2 .25
predicted (proportion) observed
predicted
.05 .1 .15 .2
.06 .08 .1 .12
predicted (proportion) observed
predicted
.05 .1 .15 .2
.05 .1 .15 .2
predicted (proportion) observed
predicted
FIGURE 2
women. Forms completed by Family Nurse Partnership nurses in the second-wave pilot sites in England had missing data for 8.8% of women on marital status, 9.3% on employment status, and 10.1% on education.40
Al-though responding to a research ques-tionnaire is different compared with answering questions in a clinic setting, our study suggests that most pregnant women provide information on the characteristics we have examined. It is possible that the 15% to 17% who did not answer questions about education, depression, or financial difficulties are those with children at particular high risk of childhood development prob-lems. Second, a simple tool would be needed for using the collected data and generating a risk score for each individual. This could range from a simple checklist of predictors in which, for example, women with ⱖ2 of the binary predictors are consid-ered for interventions, through to computer-based tools that make use of predictive risk algorithms contain-ing continuous variables. The former is likely to be feasible in most settings; the latter is becoming increasingly common, for example, in the predic-tion of cardiovascular risk. Third, al-though there is some randomized con-trolled trial evidence that these interventions improve outcomes for children of teen-aged mothers,41–43for
the other predictors that we examined there is little such evidence, and it
would be important to determine the effectiveness of programs among women identified using a larger num-ber of predictive factors. Fourth, avail-able resources would be needed to provide programs to all families iden-tified as at risk. One advantage of a multiple characteristic prediction score with good calibration is that it allows policy makers to decide the number of people to whom they are able to provide the programs, and a well-calibrated prediction score will identify those at most risk. For exam-ple, policy makers might decide to pro-vide programs to the top 10% of those at predicted risk.
CONCLUSIONS
Programs and services designed for teen-aged mothers may remain neces-sary to provide for the specific needs of this group.44,45However, even if
pro-grams for teen-aged mothers are suc-cessful in improving child outcomes, they will have little impact on improv-ing population levels of poor child de-velopment because maternal young age is not an adequate singular predic-tor, and few children with poor devel-opmental outcomes have teen-aged mothers. If the goal of improving child development outcomes across the population is to be reached, factors such as maternal education level, fi-nancial difficulties, smoking, and de-pression during pregnancy should be considered when recruiting women to preventive programs. Additional
re-search is needed to examine the feasi-bility of collecting these data in prac-tice, the effectiveness and cost-effectiveness of providing programs to these targeted groups in real-world settings, and how this broader range of factors can be used in clinical deci-sions about which women should be offered preventive programs.
ACKNOWLEDGMENTS
This research was funded by a grant from the UK Economic and Social Re-search Council (RES-060-23-0011). The UK Medical Research Council (grant 74882), the Wellcome Trust (grant 076467), and the University of Bristol provide core support for ALSPAC. Prof Lawlor works in a center that receives support from the UK Medical Research Council (G0600705) and the University of Bristol. Prof Lynch is supported by an Australia Fellowship from the Na-tional Health and Medical Research Council of Australia. Dr Chittleborough is also supported by funds from the Australia Fellowship awarded to Prof Lynch. The funding bodies had no role in the decision to publish or the con-tent of this article.
We are extremely grateful to all the families who took part in this study, the midwives for their help in recruit-ing them, and the whole ALSPAC team, which includes interviewers, com-puter and laboratory technicians, cler-ical workers, research scientists, vol-unteers, managers, receptionists, and nurses.
REFERENCES
1. The Marmot Review.Fair Society, Healthy Lives. London, United Kingdom: UK Depart-ment of Health; 2010
2. Lynch JW, Law C, Brinkman S, Chittlebor-ough C, Sawyer M. Inequalities in child healthy development: some challenges for effective implementation. Soc Sci Med. 2010;71(7):1244 –1248
3. Hall D, Hall S.The “Family-Nurse Partner-ship”: Developing an Instrument for Identi-fication, Assessment and Recruitment of Clients. London, United Kingdom:
Depart-ment for Children, Schools and Families; 2007
4. McDermott E, Graham H, Hamilton V. Expe-riences of Being a Teenage Mother in the
UK: A Report of a Systematic Review of Qual-itative Studies.Lancaster, United Kingdom: Institute for Health Research, Lancaster University; 2004
5. Yardley E. Teenage mothers’ experiences of stigma.J Youth Studies. 2008;11(6):671– 684
6. Wilson H, Huntington A. Deviant (m)others:
The construction of teenage motherhood in contemporary discourse.J Soc Policy. 2005; 35(1):59 –76
7. Duncan S, Alexander C, Edwards R. What’s the problem with teenage parents? In: Dun-can S, Edwards R, Alexander C, eds.Teenage Parenthood: What’s the Problem?London, United Kingdom: The Turfell Press; 2010 8. Barnes J, Ball M, Meadows P, McLeish J,
Imple-mentation in England. London, United Kingdom: Institute for the Study of Children, Families and Social Issues, Birkbeck, Uni-versity of London; 2008
9. Children, Youth and Women’s Health Ser-vice.Family Home Visiting. Service Outline. Adelaide, Australia: Children, Youth and Women’s Health Service; 2005
10. Olds D, Kitzman H, Cole R, Robinson J. Theo-retical foundations of a program of home visitation for pregnant women and parents of young children.J Community Psychol. 1997;25(1):9 –25
11. Shaw M, Lawlor DA, Najman JM. Teenage children of teenage mothers: psychological, behavioural and health outcomes from an Australian prospective longitudinal study.
Soc Sci Med. 2006;62(10):2526 –2539 12. Paranjothy S, Broughton H, Adappa R, Fone
D. Teenage pregnancy: who suffers?Arch Dis Child. 2009;94(3):239 –245
13. Pepe MS, Janes H, Longton G, Leisenring W, Newcomb P. Limitations of the odds ratio in gauging the performance of a diagnostic, prognostic, or screening marker.Am J Epi-demiol. 2004;159(9):882– 890
14. Golding J, Pembrey M, Jones R, ALSPAC Study Team. ALSPAC—the Avon longitudinal Study of Parents and Children. I. Study methodology.Paediatr Perinat Epidemiol. 2001;15(1):74 – 87
15. Frankenburg WK, Dodds J, Archer P, Sha-piro H, Bresnick B. The Denver II: a major revision and restandardization of the Den-ver Developmental Screening Test. Pediat-rics. 1992;89(1):91–97
16. Heron J, Golding J, the ALSPAC Study Team. Thimerosal exposure in infants and devel-opmental disorders: a prospective cohort study in the United Kingdom does not sup-port a causal association.Pediatrics. 2004; 114:577–583
17. Goodman R. The Strengths and Difficulties Questionnaire: a research note.J Child Psy-chol Psychiatry. 1997;38(5):581–586 18. Goodman R, Ford T, Simmons H, Gatward R,
Meltzer H. Using the Strengths and Difficul-ties Questionnaire (SDQ) to screen for child psychiatric disorders in a community sam-ple.Br J Psychiatry. 2000;177:534 –539 19. South Gloucestershire Professional and
Curriculum Support Service.Entry Assess-ment in South Gloucestershire. Weston-super-mare, United Kingdom: Woodspring Educational Resource Centre; 1996 20. Bowen E, Heron J, Waylen A, Wolke D, ALSPAC
Study Team. Domestic violence risk during and after pregnancy: findings from a British
longitudinal study. BJOG. 2005;112(8): 1083–1089
21. Cox JL, Holden JM, Sagovsky R. Detection of postnatal depression. Development of the Edinburgh Postnatal Depression Scale.Br J Psychiatr. 1987;150(6):782–786
22. Evans J, Heron J, Francomb H, Oke S, Gold-ing J. Cohort study of depressed mood dur-ing pregnancy and after childbirth.BMJ. 2001;323(7307):257–260
23. Murray D, Cox JL. Screening for depression during pregnancy with the Edinburgh de-pression scale (EPDS).J Reprod Infant Psy-chol. 1990;8(2):99 –107
24. Thorpe K. A study of the Edinburgh postnatal depression scale for use with parent groups outside the postpartum period.J Reprod Infant Psychol. 1993;11(2):119 –125 25. Murray L, Carrothers AD. The validation of
the Edinburgh Postnatal Depression Scale on a community sample. Br J Psychiatr. 1990;157(2):288 –290
26. Steyerberg EW, Vickers AJ, Cook NR, et al. Assessing the performance of prediction models: a framework for traditional and novel measures.Epidemiology. 2010;21(1): 128 –138
27. Pencina MJ, D’Agostino RB Sr, D’Agostino RB Jr, Vasan RS. Evaluating the added predic-tive ability of a new marker: From area un-der the ROC curve to reclassification and beyond.Stat Med. 2008;27(2):157–172; dis-cussion 207–212
28. Royston P. Multiple imputation of missing values.Stata J. 2004;4(3):227–241 29. Office for National Statistics. Births in
England and Wales 2009. Available at: www. s t a t i s t i c s . g o v . u k / s t a t b a s e / P r o d u c t . asp?vlnk⫽14408. Accessed October 1, 2010 30. Martin JA, Hamilton BE, Sutton PD, et al.
Births: Final Data for 2006.National Vital Statistics Report, Vol 57, No. 7. Hyattsville, MD: National Center for Health Statistics; 2009
31. Australian Bureau of Statistics.Births 2008.
Catalogue No. 3301.0. Canberra: Australian Bureau of Statistics; 2009
32. Eccles JS, Davis-Kean PE. Influences of par-ents’ education on their children’s educa-tional attainments: the role of parent and child perceptions.London Review of Educa-tion. 2005;3(3):191–204
33. Shipton D, Tappin DM, Vadiveloo T, Crossley JA, Aitken DA, Chalmers J. Reliability of self reported smoking status by pregnant women for estimating smoking prevalence: a retrospective, cross sectional study.BMJ. 2009;339:b4347
34. The Information Centre for Health and
So-cial Care.Statistics on Smoking, England 2006. London, United Kingdom: The Informa-tion Centre; 2006
35. Higher Education Funding Council for Eng-land. Trends in Young Participation in Higher Education: Core Results for England. London, United Kingdom: HEFCE; 2010 36. Turley RN. Are children of young mothers
disadvantaged because of their mother’s age or family background?Child Dev. 2003; 74(2):465– 474
37. Deave T. Associations between child devel-opment and women’s attitudes to preg-nancy and motherhood.J Reprod Infant Psy-chol. 2005;23(1):63–75
38. Kiernan KE, Mensah FK.Maternal Indicators in Pregnancy and Children’s Infancy that Signal Future Outcomes for Children’s De-velopment, Behaviour and Health: Evidence from the Millennium Cohort Study.York, United Kingdom: University of York; 2009 39. Hobcraft JN, Kiernan KE.Predictive Factors
from Age 3 and Infancy for Poor Child Out-comes at Age 5 Relating to Children’s Devel-opment, Behaviour and Health: Evidence from the Millennium Cohort Study.York, United Kingdom: University of York; 2010 40. Barnes J, Ball M, Meadows P, Belsky J.
Nurse-Family Partnership Programme. Sec-ond Year Pilot Sites Implementation in Eng-land. The Infancy Period. London, United Kingdom: Institute for the Study of Children, Families and Social Issues, Birkbeck, Uni-versity of London; 2009
41. Olds DL, Henderson CR Jr, Tatelbaum R, Chamberlin R. Improving the delivery of pre-natal care and outcomes of pregnancy: a randomized trial of nurse home visitation.
Pediatrics. 1986;77(1):16 –28
42. Kitzman H, Olds DL, Henderson CR Jr, et al. Effect of prenatal and infancy home visita-tion by nurses on pregnancy outcomes, childhood injuries, and repeated childbear-ing. A randomized controlled trial.JAMA. 1997;278(8):644 – 652
43. Olds D, Kitzman H, Cole R, Robinson J, Sidora K, Luckey DW, et al. Effects of nurse home-visiting on maternal life-course and child development: age six follow-up results of a randomized trial.Pediatrics. 2004;114(6): 1550 –1559
44. de Jonge A. Support for teenage mothers: a qualitative study into the views of women about the support they received as teenage mothers.J Adv Nurs. 2001;36(1):49 –57 45. Department for Children Schools and
DOI: 10.1542/peds.2010-3222 originally published online May 2, 2011;
2011;127;e1436
Pediatrics
Catherine R. Chittleborough, Debbie A. Lawlor and John W. Lynch
Services
Updated Information &
http://pediatrics.aappublications.org/content/127/6/e1436
including high resolution figures, can be found at:
References
http://pediatrics.aappublications.org/content/127/6/e1436#BIBL
This article cites 29 articles, 10 of which you can access for free at:
Subspecialty Collections
vices_sub
http://www.aappublications.org/cgi/collection/community_health_ser
Community Health Services
_sub
http://www.aappublications.org/cgi/collection/community_pediatrics
Community Pediatrics
following collection(s):
This article, along with others on similar topics, appears in the
Permissions & Licensing
http://www.aappublications.org/site/misc/Permissions.xhtml
in its entirety can be found online at:
Information about reproducing this article in parts (figures, tables) or
Reprints
http://www.aappublications.org/site/misc/reprints.xhtml
DOI: 10.1542/peds.2010-3222 originally published online May 2, 2011;
2011;127;e1436
Pediatrics
Catherine R. Chittleborough, Debbie A. Lawlor and John W. Lynch
Birth Cohort
Young Maternal Age and Poor Child Development: Predictive Validity From a
http://pediatrics.aappublications.org/content/127/6/e1436
located on the World Wide Web at:
The online version of this article, along with updated information and services, is
http://pediatrics.aappublications.org/content/suppl/2011/04/21/peds.2010-3222.DC1
Data Supplement at:
by the American Academy of Pediatrics. All rights reserved. Print ISSN: 1073-0397.