Kernicterus in the 1990s
WHAT’S KNOWN ON THIS SUBJECT: Kernicterus is the driving concern behind treating neonatal hyperbilirubinemia. Some authors have suggested that the incidence of kernicterus increased dramatically during the 1990s, but the evidence to support such an increase is weak.
WHAT THIS STUDY ADDS: This population-based study uses independent sources of data from the California Department of Developmental Services and United States national cause-of-death registries to estimate kernicterus incidence. Both sources suggest a flat incidence rate of⬍1 in 100 000 live births per year.
abstract
BACKGROUND:Although some have suggested that kernicterus disap-peared in the United States in the 1970s to 1980s and dramatically reappeared in the 1990s, population-based data to support such a resurgence are lacking.
METHODS:We used diagnosis codes on data collection forms from the California Department of Developmental Services (DDS) to identify ker-nicterus cases among children born from 1988 to 1997. We examined kernicterus mortality trends in the United States from 1979 to 2006 using death certificate data from the National Center for Health Statistics.
RESULTS:We identified 25 cases of physician-diagnosed kernicterus. This figure was augmented to reflect estimates of cases lost to infant mortality, yielding incidence estimates of 1 in 200 000 California live births, 1 in 2500 among children who received services from DDS, and 1 in 400 children with cerebral palsy. There was no significant trend in kernicterus incidence from 1988 to 1997 (P⫽.77). Incidence before and after the 1994 publication of the AAP practice parameter for hy-perbilirubinemia in healthy term infants was not significantly different (P⫽.92). Nationally, there were 3 reported infant deaths from ker-nicterus in 1994 and 2 or fewer in the other 28 years from 1979 to 2006 (0.28 deaths per million live births): there was no significant increase in kernicterus mortality over this period.
CONCLUSION:Data from California do not support a resurgence of kernicterus in the 1990s. Deaths from kernicterus in the United States have remained rare, with no apparent increase during the last 25 years.Pediatrics2011;127:672–679
AUTHORS:Jordan C. Brooks, MPH,a,bSusan A.
Fisher-Owens, MD, MPH,cYvonne W. Wu, MD, MPH,c,dDavid J.
Strauss, PhD, FASA,aand Thomas B. Newman, MD, MPHc,e
aLife Expectancy Project, San Francisco, California;bDepartment
of Biostatistics, University of California, Berkeley, California; and Departments ofcPediatrics,dNeurology, andeEpidemiology and
Biostatistics, University of California, San Francisco, California
KEY WORDS
kernicterus, hyperbilirubinemia, neonatal jaundice, incidence, mortality
ABBREVIATIONS
DDS—Department of Developmental Services CDER—Client Development Evaluation Report
ICD-9—International Classification of Diseases, Ninth Revision CI—confidence interval
www.pediatrics.org/cgi/doi/10.1542/peds.2010-2476
doi:10.1542/peds.2010-2476
Accepted for publication Dec 17, 2010
Address correspondence to Jordan C. Brooks, MPH, 1439 17th Ave, San Francisco, CA 94122. E-mail: brooks@lifeexpectancy.org
PEDIATRICS (ISSN Numbers: Print, 0031-4005; Online, 1098-4275).
Copyright © 2011 by the American Academy of Pediatrics
Kernicterus, a rare but potentially pre-ventable cause of neurologic damage, is the driving concern behind treating neo-natal hyperbilirubinemia.1,2 Some
au-thors have suggested that in the United States, kernicterus “had been virtually eradicated by the 1970s and early 1980s”3and that there was “a dramatic
rise in cases” in the 1990s.4This
conclu-sion seems to be based on personal or anecdotal experience and an increase in case reports in the 1990s.2,5–16Although
certainly deserving consideration, these reports do not allow conclusions about time trends or incidence cause they lack denominators and be-cause interest in and reporting of ker-nicterus cases may vary over time.17
One study has specifically examined ker-nicterus time trends in the United States, using data from the Healthcare Cost and Utilization Project Nationwide Inpatient Sample and Kids’ Inpatient databases.18
These authors reported a 70% decline in neonatal hospitalizations with a diagno-sis of kernicterus from 1988 to 2005, most of which occurred before 1997. Use of neonatal discharge diagnoses to esti-mate kernicterus incidence is problem-atic, however, because of coding errors, possible false-positive “rule out” diagno-ses, and possible missed cases if the di-agnosis of kernicterus was not made in the neonatal period.19However, there is
no reason to believe that these problems changed over time.
We sought to estimate the incidence of kernicterus during the time of this pos-sible reemergence from an entirely dif-ferent data source. In California, chil-dren with developmental disabilities are eligible for services at regional centers through the Department of Developmen-tal Services (DDS). We estimated ker-nicterus incidence on the basis of data collected at the regional centers regard-ing underlyregard-ing diagnoses responsible for children’s developmental disabilities. We complemented the California data with national mortality data obtained
from cause of death listed on death certificates.
METHODS
Study Population and Case Ascertainment
The study base included observations of 64 346 children and adolescents who were born 1988 –1997 and received ser-vices from the DDS during years 1988 through 2002, the period for which data were available.
These individuals were evaluated annu-ally with the Client Development Evalua-tion Report (CDER).20This report
charac-terizes each individual’s major developmental disabilities (eg, mental retardation, cerebral palsy, autism, epi-lepsy) and contains⬎200 medical, func-tional, behavioral, and cognitive items. Physicians make the assessments of medical diagnoses, including the assess-ment of kernicterus, which are coded with International Classification of Dis-eases, Ninth Revision (ICD-9), codes. Functional status (walking, feeding, vi-sion and hearing, etc) is assessed by physicians or other professionals most familiar with that aspect of the client’s development.
Cases were identified using astrict defi-nition of kernicterus, ie, ICD-9 codes 773.4 for kernicterus because of isoim-munization or 774.7 for kernicterus not because of isoimmunization. Ascertain-ment was defined to be the date of each individual’s first CDER evaluation. In an attempt to capture any additional cases, we also considered a loose definition that included diagnoses that might be associated with kernicterus, even in the absence of a diagnosis of kernicterus. The loose definition included ICD-9 codes 773, 773.0 –773.2 for isoimmunization; 774, 774.0 –774.6 for neonatal jaundice; and 282, 282.0 –282.3, 282.8 –283 for he-molytic anemias.
Descriptive summaries of functional abilities and disabilities were tabulated
for children who met the strict definition or loose definition and were compared with those for children with more typical cerebral palsy. Comparisons of the pro-portion of children with hearing loss were used to estimate the extent of true kernicterus in the loose definition group. The items on the CDER forms have been externally validated and have been deemed satisfactory.21
Incidence
Incidence estimation was restricted to births in the 10-year period 1988 to 1997 to allow adequate time for follow-up. The incidence numerator was defined as the number of kernicterus cases born in a given calendar year, identified via the CDER database. The denominator was to-tal California live births in the same year.22Confidence intervals were
calcu-lated under the assumption that ker-nicterus counts follow a Poisson distri-bution. Similar proportions were computed using each of the following 2 denominators: cases of cerebral palsy or other significant motor dysfunction in the CDER database born in a given year, and the total number of individuals in the CDER database born in a given year. The incidence figures were then augmented to account for early mortality.
Linear trends in the rates over time were tested using Poisson regression analysis. We also tested the differ-ences in kernicterus incidence during birth years 1988 –1993 and 1995–1997, ie, before and after the October 1994 publication of the American Academy of Pediatrics practice parameter on management of hyperbilirubinemia in the healthy term newborn.23
National Mortality Incidence Trends
It may be used as a rough indicator of incidence if the case fatality rate is fairly constant. The case fatality rate from ker-nicterus has been estimated to be⬃10%.24
National mortality data from 1979 to 2006 were accessed from the Centers for Disease Control and Prevention’s Wide-ranging Online Data for Epidemio-logic Research, or WONDER, using the compressed mortality database.25,26This
database draws from death certificates in the 50 United States and the District of Columbia. The number of live births taken from National Center on Health Statistics data was used for the denomi-nator. Queries were run for children younger than 1 for cause of death de-fined in the period from 1979 to 1998 by ICD-9 codes 773.4 (kernicterus due to iso-immunization) and 774.7 (kernicterus not due to isoimmunization); and from 1999 to 2003 by ICD-10 codes P57.0 (ker-nicterus due to isoimmunization), P57.8 (other specified kernicterus), and P57.9 (kernicterus, unspecified).
RESULTS
California Kernicterus Case Ascertainment
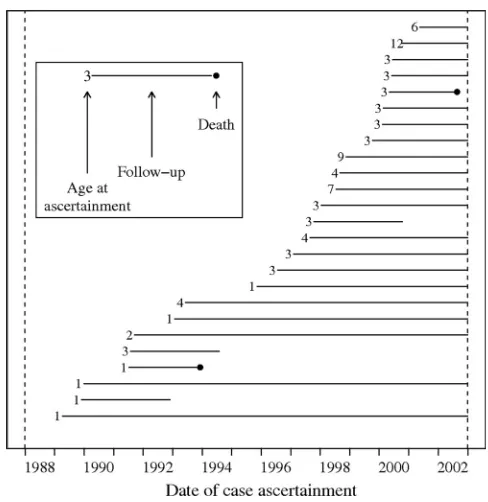
We identified 25 children with a strict physician diagnosis of kernicterus, and another 95 (120 total), who met the loose definition (Table 1).* Fig 1 depicts ascer-tainment and follow-up of incident
strict kernicterus cases during calen-dar years 1988 to 2002. The median age of ascertainment was 3 years, with 84% of strict kernicterus cases en-rolled as DDS clients by age 5 (Fig 2). The youngest age of ascertainment was younger than 1 year. The 4 oldest ascertain-ment ages were 6, 7, 9, and 12.
Comparison of Strict Cases, Loose Definition Cases, and Typical Cerebral Palsy
In Table 2 the functional abilities and medical diagnoses, as given on the most recent CDER, are compared be-tween children with strict diagnoses of *Of the 25 incident cases, 5 were because of
isoim-munization. Four of these children were born 1990 or earlier, and in the final isoimmunization ker-nicterus case the child was born in 1995. Three children (2 born in 1997 and 1 in 1989) were born prematurely and/or at low birth weight. There were 2 deaths and 3 cases lost to follow-up.
Group Total Persons
All persons in CDER database 64 346
Cerebral palsy 9962
Kernicterus, loose definitiona 95 Kernicterus, strict definitionb 25
aIncludes ICD-9 codes for isoimmunization (773, 773.0 –
773.2), jaundice (774, 774.0 –774.6), and hemolytic ane-mias (282, 282.0 –282.3, 282.8 –282.9, 2830).
bIncludes ICD-9 codes for Kernicterus (773.4 or 774.7).
FIGURE 1
Incident kernicterus ascertainment and follow-up.
FIGURE 2
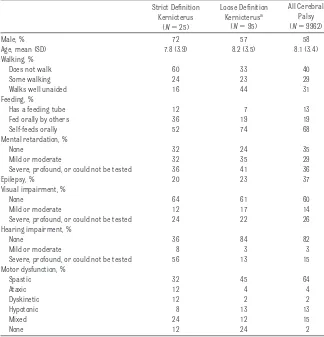
kernicterus, children who only met our loose definition, and all children with cerebral palsy. The strict kernicterus group (72% male) had disabilities that were, on average, more severe than in the loose definition group. For exam-ple, only 16% of children in the strict group were able to walk well alone, whereas 44% in the loosely defined group were able to do so. In addition, the patterns of abilities and disabili-ties in the strict group were more con-sistent with classical descriptions of kernicterus in the medical literature, whereas those in the loose definition group were more consistent with typi-cal cerebral palsy. In the strict group, 64% had hearing loss or were so dis-abled that formal testing could not be
completed. The corresponding propor-tions in the loose definition group and in all those with cerebral palsy were 16% and 18%, respectively. The propor-tion of male children in the loose defi-nition group, 57%, was also more con-sistent with that in typical cerebral palsy (58%).
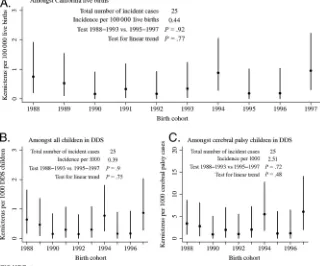
California Kernicterus Incidence
Fig 3A shows the estimated California population incidence of kernicterus by birth year. There were 25 strict ker-nicterus cases born in the 10-year pe-riod, 1988 to 1997, for an incidence es-timate of⬃0.44 per 100 000. Because the clinical profile of children who only met the loose definition was much more consistent with that of typical
ce-rebral palsy than with physician-diagnosed kernicterus, we did not in-clude these 95 children in the incidence numerator.
With time trends, the data were consis-tent with a constant incidence of 0.44 cases (95% confidence interval [CI]: 0.28 – 0.65) per 100 000 California live births per year. Kernicterus was most frequent in birth cohorts for years 1988 (n⫽4), 1994 (n⫽5), and 1997 (n⫽5). There were no significant dif-ferences in kernicterus incidence in birth years 1988 to 1993 versus 1995 to 1997 (P⫽.92), nor was there any sig-nificant linear trend (P⫽.77).
The findings did not change signifi-cantly after excluding low birth weight or premature infants. Approximately 1 in 2500 individuals who received ser-vices from DDS had a diagnosis of nicterus. There was roughly 1 ker-nicterus case for every 400 cases of cerebral palsy. These ratios also did not vary significantly with calendar year of birth (Fig 3 B and C).
National Kernicterus Mortality
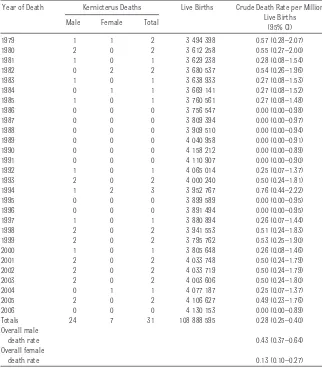
Nationally, there were a total of 31 infant deaths reported with kernicterus as an underlying cause during the period 1979 to 2006. The highest number of infant kernicterus deaths, 3, was reported in 1994, with 2 or fewer deaths reported during all other years (Table 3). To fur-ther investigate time trends, the first 14 years (1979 –1992) were compared with the latter 14 years (1993–2006). The crude kernicterus death rates were 0.21 (95% CI: 0.10 – 0.37) and 0.36 (95% CI: 0.22– 0.56) per million, respec-tively; the difference (0.15 per million) was not statistically significant. There was also no statistical difference be-tween the ICD-9-coded kernicterus deaths 0.25 (95% CI: 0.15– 0.39) per million and those from ICD-10 codes 0.38 (95% CI: 0.19 – 0.66) per million.
The crude kernicterus death rates per million were significantly higher for TABLE 2 Comparison of Functional Profile of Children With Possible Kernicterus According to Case
Definition With All Cerebral Palsy, on Most Recent CDER
Strict Definition Kernicterus
(N⫽25)
Loose Definition Kernicterusa
(N⫽95)
All Cerebral Palsy (N⫽9962)
Male, % 72 57 58
Age, mean (SD) 7.8 (3.9) 8.2 (3.5) 8.1 (3.4)
Walking, %
Does not walk 60 33 40
Some walking 24 23 29
Walks well unaided 16 44 31
Feeding, %
Has a feeding tube 12 7 13
Fed orally by others 36 19 19
Self-feeds orally 52 74 68
Mental retardation, %
None 32 24 35
Mild or moderate 32 35 29
Severe, profound, or could not be tested 36 41 36
Epilepsy, % 20 23 37
Visual impairment, %
None 64 61 60
Mild or moderate 12 17 14
Severe, profound, or could not be tested 24 22 26
Hearing impairment, %
None 36 84 82
Mild or moderate 8 3 3
Severe, profound, or could not be tested 56 13 15
Motor dysfunction, %
Spastic 32 45 64
Ataxic 12 4 4
Dyskinetic 12 2 2
Hypotonic 8 13 13
Mixed 24 12 15
None 12 24 2
aBecause the clinical profile of children who met the criteria for our loose definition of kernicterus was much more
consistent with that of children with more typical cerebral palsy, these children were not included as kernicterus cases in incidence estimation.
male children 0.43 (95% CI: 0.37– 0.64) than female children 0.13 (95% CI: 0.10 – 0.27). Boys made up 77% of the kernicterus infant deaths. During the same period, kernicterus was re-ported as an underlying cause of death in an additional 12 male children and 4 female children who died after 1 year of age. The preponderance of male children observed in national death counts (77%) is consistent with that observed in the California incidence data (72%).
DISCUSSION
This is the first study to provide population-based estimates of ker-nicterus incidence in the United States that does not rely on hospital dis-charge abstracts. Kernicterus inci-dence in California remained low be-tween 1988 and 1997. There is no evidence that incidence increased over the study period. There was also no significant difference in incidence before and after publication of the
1994 American Academy of Pediatrics practice parameter on management of hyperbilirubinemia, which, in at least 2 hospitals in Israel where this was
ex-amined, was associated with a dra-matic reduction in use of phototherapy and exchange transfusions.27
The actual incidence estimate we re-port here must be regarded as approx-imate. One issue is that children who receive services from DDS may not have been born in California. During
the period of this study there was net in-migration to California.28,29In
addi-tion, the fact that California provides services to persons with developmen-tal disability is an additional incentive for migration into the state, particu-larly for families of children with devel-opmental disabilities. Although birth certificate data were not available to verify this, children with kernicterus who entered the DDS system at age 5 or greater may have been born in other states. Thus, it seems likely that
have moved out during this time pe-riod. As a result, the effect of migration would likely lead to an overestimate of the incidence of kernicterus. On the other hand, the only cases counted here are those receiving services from DDS. Thus some cases may have been missed; these are more likely to be mild cases with less need for services.
Because the data here are drawn from client evaluation forms and death cer-tificates, they are only as good as the accuracy of the forms. As noted, all CDER kernicterus diagnoses were made by consulting physicians. The profile of functional abilities in these children was consistent with the hall-marks of kernicterus discussed in case reports. In particular, when com-pared with typical cerebral palsy, there was a higher male predomi-nance (72% vs 58%), a higher propor-tion dyskinetic or mixed type motor dysfunction as compared with typical cerebral palsy (36% vs 17%), and much higher preponderance of hearing im-pairment (64% vs 18%).
Bias because of early mortality cannot be estimated from the data directly but is probably small. If the infant mortal-ity rate from kernicterus is in fact
⬃10%, as estimated by Ip et al24from a
literature-based case series, then the incidence estimates here should be in-creased by 11%; ie, from 0.44 cases per 100 000 California live births to 1.11⫻ 0.44 ⫽ 0.49 cases per 100 000 live births.
The relatively flat incidence obtained from the California data are comple-mented by similar findings from na-tional kernicterus mortality. These data indicate that mortality from ker-nicterus has also remained low in the United States for 28 years, at 0 to 3 deaths per year. There is no evidence that current kernicterus mortality is higher than in the 1970s and early FIGURE 3
1980s. After 7 years with 1 or 2 deaths (1979 – 85) there was a period of 6 years, 1986 to 1991, when there were no kernicterus deaths reported, fol-lowed by a return to the previous pat-tern of 1 or 2 per year in most years. Although this may be consistent with a small increase in kernicterus in the 1990s, we cannot explain why the risk was lower from 1986 to 1991 than from 1979 to 1985 because hospital stays were longer in 1979 to 1985 and rec-ommendations for treatment at least as aggressive.
If infant mortality from kernicterus were⬃10%, the deaths reported from the national infant mortality data would have been expected to have risen from 0.28 (deaths per million)⫻ 10 (incident cases/death)⫽0.28
inci-dent cases per 100 000 live births. This is somewhat lower than the 0.49 in 100 000 kernicterus incidence that we estimated from the California data. This most likely reflects some combi-nation of incomplete ascertainment of kernicterus deaths at the national level, potential overestimation of the California caseload because of migra-tion patterns, or a lower kernicterus case fatality rate than 10% in the first year after birth.
The primary strength of the present study, when compared with other re-ports on kernicterus incidence, is the consistent reporting of cases over the relevant 10-year period. In fact, incon-sistent reporting may underlie many of the claims of a “resurgence” of ker-nicterus in this period. For example,
the dramatic increase in the number of cases born after 1992 in the pilot USA Kernicterus Registry7 is most
readily explained by the fact that the registry project was started in that same year. Similarly, the Danish inci-dence figures from a year 2000 report were based on cases known to the au-thor a priori, rather than through on-going surveillance.5Although it is
pos-sible that our estimates could have been influenced by increasing aware-ness in the medical community or by changes in diagnostic criteria, there is no reason to believe that the accuracy of reporting methods used in DDS or on death certificates changed during the time course of this study. Thus we believe that the California disability data and the Centers for Disease Con-trol and Prevention mortality data are more reliable estimators of incidence trends than ad hoc reporting of cases or published case reports.
On the basis of the California data, we estimate the incidence of kernicterus leading to regional center services in California to have been 0.49 per 100 000 live births during the period 1988 to 1997. This estimate is consis-tent with estimates derived from na-tional neonatal surveillance data from both Germany, 2003 to 2005 (0.63 per 100 000),30and Denmark, 2002 to 2005
(0.4 per 100 000).31The latter figure is
markedly lower than the 1.9 per 100 000 reported in the same country by Ebbesen5during the period 1994 to
1998. Although this suggests a decline in Danish kernicterus incidence since 1994, there is no reliable evidence to ascertain trends during the 1990s, or whether there was a marked differ-ence in inciddiffer-ence before and after the publication of the 1994 AAP guideline, in that country. In the United Kingdom, Manning et al32identified 14 cases of
neonatal bilirubin encephalopathy via voluntary reporting from 2003 to 2005 for an incidence of 0.9 per 100 000. Of TABLE 3 US Kernicterus Infant Mortality (⬍1 Year Old), 1979 –2006
Year of Death Kernicterus Deaths Live Births Crude Death Rate per Million Live Births
(95% CI) Male Female Total
1979 1 1 2 3 494 398 0.57 (0.28–2.07)
1980 2 0 2 3 612 258 0.55 (0.27–2.00)
1981 1 0 1 3 629 238 0.28 (0.08–1.54)
1982 0 2 2 3 680 537 0.54 (0.26–1.96)
1983 1 0 1 3 638 933 0.27 (0.08–1.53)
1984 0 1 1 3 669 141 0.27 (0.08–1.52)
1985 1 0 1 3 760 561 0.27 (0.08–1.48)
1986 0 0 0 3 756 547 0.00 (0.00–0.98)
1987 0 0 0 3 809 394 0.00 (0.00–0.97)
1988 0 0 0 3 909 510 0.00 (0.00–0.94)
1989 0 0 0 4 040 958 0.00 (0.00–0.91)
1990 0 0 0 4 158 212 0.00 (0.00–0.89)
1991 0 0 0 4 110 907 0.00 (0.00–0.90)
1992 1 0 1 4 065 014 0.25 (0.07–1.37)
1993 2 0 2 4 000 240 0.50 (0.24–1.81)
1994 1 2 3 3 952 767 0.76 (0.44–2.22)
1995 0 0 0 3 899 589 0.00 (0.00–0.95)
1996 0 0 0 3 891 494 0.00 (0.00–0.95)
1997 1 0 1 3 880 894 0.26 (0.07–1.44)
1998 2 0 2 3 941 553 0.51 (0.24–1.83)
1999 2 0 2 3 795 762 0.53 (0.25–1.90)
2000 1 0 1 3 805 648 0.26 (0.08–1.46)
2001 2 0 2 4 033 748 0.50 (0.24–1.79)
2002 2 0 2 4 033 719 0.50 (0.24–1.79)
2003 2 0 2 4 003 606 0.50 (0.24–1.80)
2004 0 1 1 4 077 187 0.25 (0.07–1.37)
2005 2 0 2 4 106 627 0.49 (0.23–1.76)
2006 0 0 0 4 130 153 0.00 (0.00–0.89)
Totals 24 7 31 108 888 595 0.28 (0.25–0.40)
Overall male
death rate 0.43 (0.37–0.64)
Overall female
death rate 0.13 (0.10–0.27)
nicterus or died. If these 7 cases are taken as a numerator for a minimum estimate of incidence (0.45 per 100 000), the United Kingdom inci-dence figures seem consistent with our California-based estimates. All of these estimates are significantly lower than those published by the Canadian Pediatric Surveillance Program, which reported 22 confirmed cases for an in-cidence of 1 per 41 000 live births or 2.4 per 100 000 during years 2007 to 2009. Inclusion of the 5 pending cases would raise this to 1 in 33 000, or 3 in
the 22 confirmed cases exhibited abnormal neurologic findings on examination.
Like others,34we found an almost 3:1
preponderance of male children
among both our incident California cases and US kernicterus deaths. When stratified by gender, the Califor-nia data indicate incidence rates of 0.7
per 100 000 live births for boys and 0.3 per 100 000 for girls.
Although our data and those of Burke et al18suggest there was not a
“resur-peared, rather than because cases are not continuing to occur. Thus, efforts at preventing kernicterus are still indi-cated. Preliminary results indicate that screening newborns for hyper-bilirubinemia during their birth hos-pitalization can prevent the very high bilirubin levels at which kernicterus is known to occur.35–37 Continuing
population-based studies like we re-port here will be imre-portant to docu-ment whether this results in a pro-portionate decrease in cases of kernicterus.
REFERENCES
1. Bhutani VK, Johnson LH, Maisels MJ, et al. Kernicterus: epidemiological strategies for its prevention through systems-based ap-proaches.J Perinatol. 2004;24(10):650 – 662
2. Johnson L. System-based approach to man-agement of neonatal jaundice and preven-tion of kernicterus.J Pediatr. 2002;140(4): 396 – 403
3. Johnson L, Bhutani VK. Guidelines for man-agement of the jaundiced term and near-term infant.Clin Perinatol. 1998;25(3): 555–574, viii
4. Davidson L, Thilo EH. How to make ker-nicterus a “never event.”NeoReviews. 2003; 4(11):308 –314
5. Ebbesen F. Recurrence of kernicterus in term and near-term infants in Denmark. Acta Paediatr. 2000;89(10):1213–1217
6. Harris MC, Bernbaum JC, Polin JR, Zimmer-man R, Polin RA. Developmental follow-up of breast-fed term and near-term infants with marked hyperbilirubinemia. Pediatrics. 2001;107(5):1075–1080
7. Johnson L, Brown AK. A pilot registry for acute and chronic kernicterus in term and near-term infants.Pediatrics. 1999;104(3): 736 –737
8. MacDonald M. Hidden risks: early discharge and bilirubin toxicity due to glucose-6-phosphate dehydrogenase deficiency. Pedi-atrics. 1995;96(4 pt 1):734 –738
9. Maisels MJ, Newman TB. Kernicterus in oth-erwise healthy, breast-fed term newborns. Pediatrics. 1995;96(4 pt 1):730 –733
10. Centers for Disease Control and Prevention. Kernicterus in full-term infants—United States, 1994 –1998. MMWR. 2001;50(23): 491– 494
11. Penn AA, Enzmann DR, Hahn JS, Stevenson DK. Kernicterus in a full term infant. Pediat-rics. 1994;93(6 pt 1):1003–1006
12. Sheridan SE (September 11, 2000). Testi-mony atFirst National Summit on Medical Errors and Patient Safety Research, Wash-ington, DC. Available at: www.quic.gov/ summit/wsheridan.htm. Accessed May 1, 2010
13. Washington EC, Ector W, Abboud M. Hemo-lytic jaundice due to G6PD deficiency caus-ing kernicterus in a female newborn.South Med J. 1995;88(7):776 –779
14. Johnson L. Hyperbilirubinemia in the term infant: when to worry, when to treat.NY State J Med. 1991;91(11):483– 489
15. Brown AK, Johnson L.Loss of Concern About Jaundice and the Reemergence of
Ker-nicterus in Full-term Infants in the Era of Managed Care. Philadelphia, PA: Mosby Yearbook; 1996
16. American Academy of Pediatrics Subcom-mittee on Neonatal Hyperbilirubinemia. Neonatal jaundice and kernicterus. Pediat-rics. 2001;108(3):763–765
17. Newman TB, Xiong B, Gonzales VM, Escobar GJ. Prediction and prevention of extreme neonatal hyperbilirubinemia in a mature health maintenance organization.Arch Pe-diatr Adolesc Med. 2000;154(11):1140 –1147
18. Burke BL, Robbins JM, Bird TM, Hobbs CA, Nesmith C, Tilford JM. Trends in hospitaliza-tions for neonatal jaundice and kernicterus in the United States, 1988 –2005.Pediatrics. 2009;123(2):524 –532
19. Newman TB, Maisels JM. Kernicterus inci-dence estimates unreliable [eLetter]. Pedi-atrics. February 25, 2009. Available at:
http://pediatrics.aappublications.org/cgi/ eletters/123/2/524. Accessed May 1, 2010
20. California Department of Developmental Services. Client Development Evaluation Re-port. 1986. Available at: www.dds.ca.gov/ FactsStats/CDER.cfm. Accessed October 1, 2010
21. Citygate Associates, LLC.Independent Eval-uation of the Department of Developmental Services’ Community Placement Practices: Final Technical Report. Sacramento, CA: Citygate Associates LLC; 1998
22. State of California Department of Public Health, Birth Records. Number of live births by age of mother, California, 1960 –2005. Available at: www.cdph.ca.gov/data/ statistics/Documents/VSC-2005-0201.pdf. Accessed May 1, 2010
23. American Academy of Pediatrics, Provi-sional Committee for Quality Improvement and Subcommittee on Hyperbilirubinemia. Practice parameter: management of hyper-bilirubinemia in the healthy term newborn. Pediatrics. 1994;94(4 pt 1):558 –565
24. Ip S, Chung M, Kulig J, et al. An evidence-based review of important issues concern-ing neonatal hyperbilirubinemia. Pediat-rics. 2004;114(1). Available at: www. pediatrics.org/cgi/content/full/114/1/e130
25. Centers for Disease Control and Prevention. Compressed Mortality, 1979 –1998. WONDER database. Series 20, No. 2A, 2000 and CMF 1989 –1998, Series 20, No. 2E, 2003. National Center for Health Statistics. Available at: http://wonder.cdc.gov/cmf-icd9.html. Ac-cessed May 1, 2010
Center for Health Statistics. Available at: http://wonder.cdc.gov/cmf-icd10.html. Ac-cessed May 1, 2010
27. Seidman DS, Paz I, Armon Y, Ergaz Z, Ste-venson DK, Gale R. Effect of publication of the “Practice parameter for the manage-ment of hyperbilirubinemia” on treat-ment of neonatal jaundice.Acta Paediatr. 2001;90(3):292–295
28. State of California Department of Finance. Mi-gration between California and other states, 1985–1994: Sacramento, CA. June 2007. Avail-a b l e Avail-a t : w w w . d o f . c Avail-a . g o v / r e s e Avail-a r c h / d e m o g r a p h i c / r e p o r t s / i m m i g r a t i o n -migration/migration_1985-1994/documents/ DOMMIG.PDF. Accessed May 1, 2010
29. State of California Department of Finance. They moved and went where: California’s migration flow, 1995–2000: Sacramento, CA. June 2007. Available at: www.dof. ca.gov/HTML/DEMOGRAP/ReportsPapers/
documents/TheyMovedandWentWhere.pdf. Accessed May 1, 2010
30. Bartmann P, Schaaff F. Kernicterus in Ger-many, 2003–2005. E- PAS2007:7936.23. Avail-able at: www.abstracts2view.com/pasall/ view.php?nu⫽PAS07L1_1846. Accessed May 1, 2010
31. Bjerre JV, Petersen JR, Ebbessen F. Sur-veillance of extreme hyperbilirubinaemia in Denmark: a method to identify the new-born infants.Acta Paediatr. 2008;97(8): 1030 –1034
32. Manning D, Todd P, Maxwell M, Platt M. Pro-spective surveillance study of severe hyper-bilirubinaemia in the newborn in the UK and Ireland.Arch Dis Child Fetal Neonatal Ed. 2007;92(5):F342–F346
33. Sgro M. Kernicterus, January 2007 to De-cember 2009: final report. CPSP Canadian Paediatric Surveillance Program. Public Health Agency of Canada. 2009:30 –32
34. Johnson L, Bhutani VK, Karp K, Sivieri EM, Shapiro SM. Clinical report from the pilot USA Kernicterus Registry (1992 to 2004).J Perinatol. 2009;29(suppl 1):S25–S45
35. Eggert LD, Wiedmeier SE, Wilson J, Chris-tensen RD. The effect of instituting a prehospital-discharge newborn bilirubin screening program in an 18-hospital health system.Pediatrics. 2006;117(5). Available at: www.pediatrics.org/cgi/content/full/117/ 5/e855
36. Kuzniewicz MW, Escobar GJ, Newman TB. Im-pact of universal bilirubin screening on se-vere hyperbilirubinemia and phototherapy use.Pediatrics. 2009;124(4):1031–1039
37. Mah MP, Clark SL, Akhigbe E, et al. Reduc-tion of severe hyperbilirubinemia after in-s t i t u t i o n o f p r e d i in-s c h a r g e b i l i r u b i n screening.Pediatrics. 2010;125(5). Avail-able at: www.pediatrics.org/cgi/content/ full/125/5/e1143
AVOIDING RISK:When I am at a music concert with my wife and we are survey-ing the crowd, she will sometimes point out a woman and ask, “Do you think she is attractive?” As I have been married a long time, I know how to answer that question, but how do other men in the audience feel? According to an article in
The New York Times(February 21, 2011: Science), whether a man views a woman as attractive or not depends on several factors including not only her ovulatory cycle but whether he is in a current, romantic relationship. In the reported study, men were asked to rate the attractiveness of a woman who helped assemble Lego blocks. The woman wore the same jeans and T-shirt each day, wore no make-up, perfume, or jewelry, and did not flirt or make eye contact. As noted in several other studies, the majority of men rated the woman most attractive while she was ovulating. However, men who were in romantic rela-tionships reported she was least attractive while ovulating. Why the difference? One explanation might be the theory of relationship maintenance. While part of the evolutionary survival game is meeting a mate, another huge part is main-taining a relationship. Partners who stay together to raise offspring presum-ably have an evolutionary advantage. It is not clear if the men in the study who rated the ovulating woman as less attractive truly felt that way or simply rec-ognized that in her current condition she represented a threat to his relation-ship and convinced themselves that she was unattractive. Reporting the woman as unattractive might help ward off temptation. Clearly, men and women are driven by ovulatory status in women but we often don’t recognize it. As for me, when out with my wife I keep my eyes firmly fixed on hers. That seems to work.
Noted by WVR, MD
DOI: 10.1542/peds.2010-2476 originally published online March 28, 2011;
2011;127;672
Pediatrics
Thomas B. Newman
Services
Updated Information &
http://pediatrics.aappublications.org/content/127/4/672
including high resolution figures, can be found at:
References
http://pediatrics.aappublications.org/content/127/4/672#BIBL
This article cites 22 articles, 9 of which you can access for free at:
Subspecialty Collections
sub
http://www.aappublications.org/cgi/collection/fetus:newborn_infant_
Fetus/Newborn Infant following collection(s):
This article, along with others on similar topics, appears in the
Permissions & Licensing
http://www.aappublications.org/site/misc/Permissions.xhtml
in its entirety can be found online at:
Information about reproducing this article in parts (figures, tables) or
Reprints
http://www.aappublications.org/site/misc/reprints.xhtml
DOI: 10.1542/peds.2010-2476 originally published online March 28, 2011;
2011;127;672
Pediatrics
Thomas B. Newman
Jordan C. Brooks, Susan A. Fisher-Owens, Yvonne W. Wu, David J. Strauss and
Evidence Suggests There Was Not a ''Resurgence'' of Kernicterus in the 1990s
http://pediatrics.aappublications.org/content/127/4/672
located on the World Wide Web at:
The online version of this article, along with updated information and services, is
by the American Academy of Pediatrics. All rights reserved. Print ISSN: 1073-0397.