ARTICLE
Early Manifestation of Type 1 Diabetes in Children Is
a Risk Factor for Changed Bone Geometry: Data
Using Peripheral Quantitative
Computed Tomography
Susanne Bechtold, MD, Isa Dirlenbach, MD, Klemens Raile, MD, Vera Noelle, MD, Walter Bonfig, MD, Hans Peter Schwarz, MD, PhD
Division of Pediatric Endocrinology, University Children’s Hospital, Munich, Germany
The authors have indicated they have no financial relationships relevant to this article to disclose.
ABSTRACT
OBJECTIVE.Normal to severely decreased bone mineral density has been reported in children with type 1 diabetes. To detect possible abnormalities in bone mineral-ization, geometry, and muscle bone unit, we measured selective parameters in children with type 1 diabetes using peripheral quantitative computed tomography.
METHODS.Measurements of the radius by peripheral quantitative computed tomog-raphy were made to assess cortical and trabecular bone characteristics as well as muscle mass in 88 patients (42 girls, 46 boys) at a mean age of 11.7⫾3.0 years, a mean disease duration of 5.6⫾3.7 years, and a mean manifestation age of type 1 diabetes of 6.1⫾3.5 years. Height, weight, Tanner stage, insulin regimen, and glycosylated hemoglobin values were recorded. Bone metabolism was studied by measurement of bone formation and bone resorption parameters. Dynamic mus-cle force was measured using a grip strength device.
RESULTS.Overall, cortical, trabecular, and total bone mineral density were within the reference range. Total and cortical bone cross-sectional area and muscle mass were low in prepubertal patients, and total cross-sectional area was low in early puberty. Adolescent patients showed normal bone and muscle parameters. Grip strength and recreational physical activity were normal in all in relation to a healthy reference population. In a subgroup of 18 patients, early manifestation of type 1 diabetes was detected as a risk factor for altered bone development with signifi-cantly reduced cortical bone mineral density and total, cortical, and muscle cross-sectional area (⫺0.9⫾1.3 SD,⫺2.1⫾1.3 SD,⫺1.6⫾0.7 SD, and⫺1.0⫾0.7 SD, respectively). Bone characteristics were not influenced by metabolic control, dis-ease duration, or insulin regimen.
CONCLUSIONS.Manifestation of type 1 diabetes at an early age may impair bone development. Longitudinal data are needed to determine whether this impairment persists into adolescence and adulthood.
www.pediatrics.org/cgi/doi/10.1542/ peds.2005-2193
doi:10.1542/peds.2005-2193
Key Words
type 1 diabetes, osteopenia, bone mineral density, bone geometry, peripheral quantitative computed tomography
Abbreviations
BMD— bone mineral density pQCT—peripheral quantitative computed tomography
CSA— cross-sectional area HbA1c— hemoglobin A1c IGF-1—insulin-like growth factor-1 aP—alkaline phosphatase CICP—C-terminal propeptide of type I collagen
iPTH—intact parathyroid hormone DpD— deoxypyridinoline SDS—SD score
Accepted for publication Mar 20, 2006
Address correspondence to Susanne Bechtold, MD, University Children’s Hospital, Lindwurmstrasse 4, D-80337 Munich, Germany. E-mail: [email protected]
C
HILDREN AND ADOLESCENTS with type 1 diabetes seem to have an increased risk for decreased bone mass. Several studies have documented a lower bone mineral density (BMD) and postponed attainment of peak bone mass and an increased risk for osteoporosis and related complications later in life.1–6However, otherstudies found normal levels of bone mass and BMD.7–9
It still is a matter of debate whether a specific gener-alized diabetic bone disease, often called diabetic osteop-athy or diabetic osteopenia, actually exists and what the clinical relevance of this disorder would be. There is no general agreement on the relative importance of several diabetes-specific characteristics, such as age at onset, disease duration, and glycemic control or insulin regi-men, on bone health.9
The majority of studies have reported bone mass and BMD in children with type 1 diabetes using dual-energy x-ray absorptiometry. This method measures bone min-eral content and bone area to determine apparent BMD. Especially in pediatrics, this method has limitations be-cause of the 2-dimensional measurement and therefore height dependence. Furthermore, no information on bone geometry and the bone-muscle relation can be gained with this method.
The objectives of the present cross-sectional study were to evaluate BMD and bone and muscle geometry in patients with type 1 diabetes using peripheral quantita-tive computed tomography (pQCT). Interpretation of bone density measurements is incomplete without tak-ing into account the interrelationship with the muscle mass.10 Muscle cross-sectional area (CSA), bone mass,
BMD, and bone geometry can be assessed by a single measurement using pQCT.
Methods
The study population included 88 white children and adolescents (42 girls, 46 boys) with type 1 diabetes. Mean age was 11.7 ⫾3.0 years, and mean disease du-ration was 5.6⫾3.7 years. The mean age at manifesta-tion of type 1 diabetes was 6.1 ⫾ 3.5 years (range: 0.7–14.6 years). All participants of the study were ob-served regularly at the diabetes outpatient clinic of the University Children’s Hospital, Munich, and met the following criteria: (1) first diagnosis of type 1 diabetes made before 18 years of age; (2) no evidence of diabetic retinopathy, neuropathy, or nephropathy; (3) no intake of medications, hormones, vitamins, or calcium prepa-ration in the preceding 6 months aside from insulin and, if necessary, thyroid hormones; (4) no chronic disease apart from celiac disease or thyroiditis under control; (5) no hospitalization or ketoacidosis in the preceding 6 months; and (6) no restriction of physical activity. All patients were examined every 3 months. Some were treated with a conventional regimen of 2 injections (n⫽
5); most patients had multiple injections (3– 4 daily) of regular and neutral protamine hagedorn insulin (n ⫽
73) or an insulin pump therapy (n⫽10). Diabetic con-trol was monitored by measurements of hemoglobin A1c (HbA1c) levels at 3-months intervals. The HbA1c level was measured by DCA 2000 (Bayer AG, Leverkusen, Germany), based on specific inhibition of latex immu-noagglutination. Normal values of HbA1c as established in our laboratory ranged from 4.0% to 6.0%. Moreover, an average HbA1c was calculated for each patient, and the mean of 4 measurements during the previous 12 months was taken.
Anthropometric data were compared with the cross-sectional German growth data of Kromeyer et al.11The
pQCT results were compared with those in a German reference population using an identical method. The reference population consisted of participants in the Dortmund Nutritional and Anthropometric Longitudi-nally Designed study, an observational study that inves-tigated the interrelations of nutrition, growth, and me-tabolism in healthy children. The results in this reference population have been described before.12–14
Height was measured in a standing position to the next 1 mm using a digital telescopic wall-mounted sta-diometer (Ulmer Stasta-diometer; Prof E. Heinze, Ulm, Ger-many). Weight was determined to the nearest 0.1 kg using an electronic scale (Seca 753 E; Vogel and Hanke, Hamburg, Germany) with the children clothed in under-wear. The BMI was calculated (weight/height2) and
compared with the German normative data by Krom-eyer et al.11 Forearm length was measured at the
non-dominant forearm as the distance between the ulnar styloid process and the olecranon using a caliper. The stage of sexual development was determined in all study participants using the grading system by Tanner for breast development in girls and genital status in boys.15
Forty-four (50%) patients were prepubertal (Tanner stage 1), 17 (19%) were early pubertal (Tanner stages 2 and 3), and 27 (31%) were adolescent (Tanner stages 4 and 5). Patients were interviewed regarding their time spent for physical activity in comprehensive and recre-ational sports using a structured questionnaire as previ-ously described.16
Biochemical Parameters
enzyme-linked immunosorbent assay (Quidel Metra Biosystems, San Diego, CA). 25-OH-vitamin D was mea-sured using a radioimmunoassay (Nichols Institute Di-agnostics, Paris, France), and iPTH was measured using an electrochemiluminescence immunoassay (Roche Di-agnostics). The university’s ethics committee approved the study protocol, and informed consent was obtained from all patients and/or their parents.
pQCT
Two sites of the nondominant radius were analyzed by pQCT, the distal metaphysis (4% site) and the proximal diaphysis (65% site) as previously described.12–14,17 A
pQCT scanner (XCT 2000; Stratec Inc, Pforzheim, Ger-many) that was equipped with a low-energy (38 keV) radiograph tube was used. The effective radiation dose is
⬃0.1Sv from radiation source of 45 kV at 150A. For the measurement, the scanner was positioned on the distal forearm and a scout view was conducted to posi-tion the scanner at the site on the radius whose distance to the radial articular surface corresponded to 4% and 65% of forearm length. At both sites, a 2-mm-thick single tomographic slice was sampled at a voxel size of 0.4 mm. Image processing and calculation of numerical values were made using the manufacturer’s software package (version 5.40; Stratec Inc). At the distal radius (metaphyseal site), total and trabecular BMD were cal-culated, and at the proximal radius (diaphyseal site), total and cortical BMD, total CSA, cortical CSA, and muscle CSA were calculated by the manufacturer’s soft-ware.
Only measurements of good quality without move-ment artifacts were taken for analysis. To establish the variability of the measurements, we measured the fore-arm of 6 adult volunteers 3 times with repositioning of the forearm. Reproducibility was 1.08% for trabecular BMD and 1.42% for total BMD at the metaphysis and 1.30% for CSA, 1.36% for total BMD, and 1.11% for cortical BMD at the diaphysis. The accuracy of the pre-vious version (XCT-960) was determined using the Eu-ropean forearm phantom, and average accuracy values between 1.9% and 1.4% for CSA and BMD values were reported.18 Calibration of the machine was performed
with phantoms provided by the manufacturer every other day (single slice) or once a month (multiple slices), respectively.
Grip Force Analysis
Maximal isometric grip force of the nondominant hand was determined with a standard adjustable-handle Jamar Dynamometer (Preston, Jackson, MI) as described before.19 The dynamometer was held freely, without
support, with flexed elbow, which did not touch the trunk. The participants were told to exert maximal force on the dynamometer. The maximum value of 3 trials
was noted. The results in kilograms, as indicated by the scale of the dynamometer, were converted by the factor of 9.81 to calculate grip force unit in Newtons. Reference data were taken from the participants in the Dortmund Nutritional and Anthropometric Longitudinally De-signed study.19
Statistical Analysis
Results in patients with type 1 diabetes were converted into gender-, age-, and height-specific SD scores (SDSs) using the formula SDS ⫽ [(test result for a patient)⫺ (age- or height-specific mean in reference population)]/ (age- or height-specific SD in reference population). To evaluate whether a parameter was significantly different from the results of an age-matched healthy population, the difference of the mean SDS to 0 was assessed by Student’s 2-tailed t test for unpaired observations. A significant difference was assumed when the 95% con-fidence interval of the mean SDS did not include 0. Pearson’s product-moment correlation was used to de-terminervalues for possible influencing factors on BMD and geometry parameters. We used a general univariate linear regression analysis to evaluate the covariant ef-fects using significance levels of the 2-sidedP⬍.05. All statistical analyses were performed using the SPSS soft-ware package (version 12.0 for windows; SPSS Inc, Chi-cago, IL).
RESULTS
Auxologic and Clinical Data
The main clinical features of the cross-sectional study population are shown in Table 1. Patients with diabetes showed normal SDSs for height but significant higher SDSs for weight and therefore for BMI (P⬍.05). Four-teen (15.9%) of 88 patients had a BMI of ⬎90th per-centile; 3 of these had a BMI ⬎97th percentile. There was no significant difference between genders for BMI. Most patients were in moderate to acceptable metabolic control with a mean HbA1c of 7.6⫾1.3% (range: 5.5%– 11.8%) at time of radial pQCT and 7.6⫾1.1% (range: 5.8%–10.5%) on average during 12 months before the
TABLE 1 Characteristics of the Studied Patients With Type 1 Diabetes
Female (n⫽42), Mean⫾SD
Male (n⫽46), Mean⫾SD
Age, y 11.9⫾3.2 11.6⫾3.3
Disease duration, y 5.3⫾3.4 5.8⫾3.9 Age at manifestation, y 6.6⫾3.4 5.7⫾3.6
Height, SDS ⫺0.2⫾1.2 ⫺0.1⫾0.9
BMI, SDS 0.5⫾1.0a 0.3⫾0.8a
Insulin dose, IU/kg per d 0.8⫾0.3 0.8⫾0.2
HbA1c, present, % 7.7⫾1.0 7.5⫾1.4
HbA1c, average, % 7.5⫾1.0 7.6⫾1.2
evaluation. Eight and 3 patients had an average HbA1c of⬎9.0% and⬎10.0%, respectively. HbA1c values and daily insulin dose per body weight were similar in boys and girls. There was no significant influence of Tanner stage on SDSs for height, weight, and BMI; tendencies were seen: older patients had higher HbA1c levels, and higher recent and average HbA1c values were associated with higher insulin dose per kilogram body weight per day. Four patients had biopsy-proven celiac disease without detectable antibodies as a result of good dietary compliance, and 2 patients had euthyroid Hashimoto thyroiditis without hormone replacement. All were well within the range for height, weight, BMI, and HbA1c of all patients with type 1 diabetes.
Bone Densitometric Results
Radial Metaphysis (4% Site)
Total BMD was normal, whereas trabecular BMD was even higher in patients with type 1 diabetes than in healthy control subjects, irrespective of age, gender, and Tanner stage. A reevaluation of the scout view scan revealed that 6 patients had a 4% measurement too close to the growth plate and were excluded for the distal BMD analysis. Using the new logarithmic ap-proach of data analysis as suggested by Rauch et al,20
trabecular BMD was 0.45⫾1.0 in girls and 0.08⫾1.2 in boys (Fig 1). Only prepubertal and female patients still had significantly higher trabecular BMD values in rela-tion to the reference popularela-tion. BMI correlated
signif-icantly (P⬍.01) with metaphyseal total and trabecular BMD (r⫽0.31 and 0.3, respectively; Table 2).
Radial Diaphysis (65% Site)
Cortical BMD was normal in relation to the reference population, whereas total CSA, cortical CSA, and muscle CSA were significantly reduced. Especially the younger patients showed smaller CSA values (Figs 2 and 3). The dynamic function of the muscle measured by grip strength was significantly higher in relation to the healthy reference population.
Separating the genders, no significant difference in BMD and bone-geometry parameters was detectable. However, in staging the patients with type 1 diabetes according to Tanner, there were great differences. In prepubertal patients (Tanner stage 1; n⫽44), patients with type 1 diabetes had lower SD levels for total, cor-tical, and muscle CSA. In early puberty (Tanner stages 2 and 3;n⫽17), only a lower total CSA was detectable, and in adolescent patients (Tanner stages 4 and 5; n⫽
27), bone-geometry and muscle CSA were normal. There was no significant influence of insulin regimen on bone and muscle parameters. There was a positive cor-relation between total CSA and age and diabetes dura-tion (r⫽0.66 and 0.62;P⬍.01). Muscle CSA SD values correlated significantly (P ⬍ .01) with total CSA (r ⫽
0.61) and cortical CSA (r ⫽ 0.67). There was also a significant correlation (P ⬍.01) between grip strength and diaphyseal total CSA (r⫽0.81), cortical CSA (r ⫽ 0.90), and muscle CSA (r⫽0.92).
To look for potential confounders, we designed 4 different models of multiple linear regression using di-aphyseal total and cortical CSA as the dependent vari-ables and present HbA1c, average HbA1c, insulin dose, and type 1 diabetes duration as the independent vari-ables. Age, gender, and Tanner stage were used as co-variates. No significant influence of the independent variables on diaphyseal total and cortical CSA was de-tectable.
Subgroup Analysis
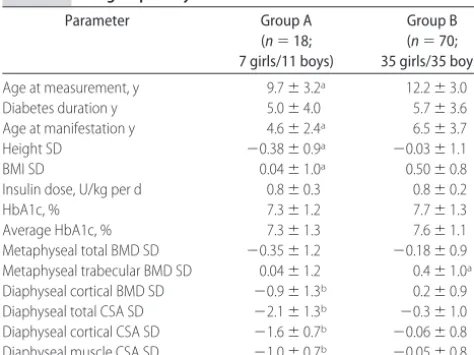
Participants with ⱖ2 BMD, bone-geometry, or muscle CSA parameters that were more than ⫺2 SD below reference (group A;n⫽18, 7 girls) were compared with the remaining patients with type 1 diabetes (group B;n
⫽ 70, 35 female). Those in group A were significantly younger at time of pQCT measurement and initial diag-nosis (P ⬍ .05). Height, weight, and BMI in group A were normal for age but significantly lower than those in group B. The duration of type 1 diabetes, daily insulin dose, and current and average HbA1c were not signifi-cantly different. Diaphyseal total CSA was signifisignifi-cantly reduced in both groups versus reference; however, only cortical BMD and cortical and muscle CSA were signifi-cantly reduced in group A (P⬍.01). Neither group was
FIGURE 1
large enough to examine the effects of pubertal matura-tion by Tanner stage (Table 3).
Sports
Mean time spent for recreational physical activity was reported as 6.7 hours per week, with girls spending 5.9 hours per week and boys spending 7.4 hours per week. Forty patients with type 1 diabetes (21 boys, 19 girls) took part regularly in competitive sports. Greater recre-ational activity correlated with age (P ⬍ .05) but not with HbA1c levels or insulin doses. These results are not different from data reported by Raile et al16for German
children and adolescents who were aged 6 to 18 years and had diabetes. Grip strength was significantly higher in our study population in relation to healthy control
patients (P⬍.01) and increased with age and hours of physical activity per week (P⬍.01).
Biochemical Results
Serum calcium, phosphorus, aP (328 ⫾ 120 U/L), and IGF-1 (189⫾79 ng/mL), CICP (298⫾148g/L) as well as 25-OH vitamin D (110⫾45 nmol/L) and iPTH (36⫾ 15 pg/mL) were within the reference range for age, gender, and season. Urinary excretion of DpD (13.9 ⫾ 6.1 nmol/mmol) was normal. There was no correlation of bone turnover parameters with BMD or bone-geom-etry parameters or with HbA1c values. IGF-1 correlated significantly with SD values of total, cortical, and muscle CSA (r⫽0.32, 0.28, and 0.26, respectively;P⬍.05).
FIGURE 2
Diaphyseal total bone CSA of patients with type 1 diabetes. Upper, female patients; lower, male patients.u, patients withⱖ2 pathologic parameters.
FIGURE 3
Diaphyseal cortical bone CSA of patients with type 1 diabetes. Upper, female patients; lower, male patients.u, patients withⱖ2 pathologic parameters.
TABLE 2 BMD and Bone-Geometry Parameters With Muscle Mass of the Studied Patients With Type 1 Diabetes Divided According to Gender and Tanner Stage Groups
Female (n⫽42)
Male (n⫽46)
Prepubertal (n⫽44)
Early Puberty (n⫽17)
Adolescent (n⫽27)
Metaphyseal
Total BMD SD ⫺0.02⫾1.0 ⫺0.22⫾1.0 ⫺0.25⫾1.0 ⫺0.16⫾1.0 ⫺0.17⫾1.0 Trabecular BMD-SD 0.47⫾1.0a 0.2⫾1.2 0.44⫾1.0a 0.41⫾1.1 0.1⫾1.2
Diaphyseal
Cortical BMD SD ⫺0.13⫾1.1 0.02⫾1.0 ⫺0.24⫾1.0 ⫺0.07⫾1.0 0.27⫾1.1 Total CSA SD ⫺0.84⫾1.5a ⫺0.6⫾1.1a ⫺1.03⫾1.5a ⫺0.71⫾0.9a ⫺0.18⫾1.0
Cortical CSA SD ⫺0.42⫾1.0a ⫺0.34⫾1.0a ⫺0.61⫾1.1a ⫺0.37⫾0.7 ⫺0.02⫾0.9
Muscle CSA SD ⫺0.26⫾0.9a ⫺0.23⫾0.8a ⫺0.43⫾0.8a ⫺0.39⫾0.8 0.15⫾0.7
Grip strength SD 0.85⫾1.3a 0.94⫾1.1a 1.06⫾1.4a 0.5⫾0.8a 0.89⫾1.0a
Data are SD values (mean⫾SD).
DISCUSSION
BMD and bone mineral content have been measured in children and adolescents with type 1 diabetes using dif-ferent methods. Studies that used dual-energy x-ray ab-sorptiometry of the spine found lower BMD values that suggested that type 1 diabetes in the young may com-promise peak bone mass and increase the risk for osteo-porosis in adult age.21–24 However, there is a great
vari-ability in number of patients investigated, auxologic data, and metabolic control of the patients with type 1 diabetes as well as normative data, possibly caused by different measurement techniques.2,9,25 In our study,
BMD values (total, trabecular, and cortical) were within the reference range. Bone-geometry parameters, specif-ically total and cortical CSA and muscle CSA, were low, although patients were not compromised in height for age and gender.
Looking for possible factors that influence the bone and muscle development, several important observa-tions were made. The BMI in our study population was significantly higher in relation to the reference popula-tion. The older the patients, the higher the BMI and the indices of bone geometry were more normalized. It could be speculated that BMI and/or pubertal develop-ment exerts a protective or normalizing effect on bone.26
In analogy to our results, the effect of metabolic con-trol on BMD and bone mass development has been excluded by several authors.9,27 However, we do not
exclude the possibility that children with poorly con-trolled diabetes over a prolonged period of time might have more significant bone deficits than our patients.28
Additional disease-specific parameters such as insulin dose, insulin treatment regimen, or duration of disease had no significant influence on BMD and bone-geome-try parameters.27Gunczler et al21described a decreased
BMD of the lumbar spine in children a few months after the onset of clinical type 1 diabetes. After a period of 3 to 5 years, a stabilization of BMD values was noted by McNair et al.29 They suggested a defect in bone mass
accretion early in the course of type 1 diabetes that then ameliorates with time. This observation is in accordance with our finding that total, cortical, and muscle CSA were reduced only in the youngest, prepubertal group. In the early pubertal group, only total CSA levels were reduced, and in the adolescent group, all parameters of bone-geometry and muscle CSA were within reference ranges. After clinical manifestation of type 1 diabetes, an initial derangement of bone development may take place, possibly followed by a catchup in bone develop-ment over a long period of time. However, patients with a very early manifestation of type 1 diabetes may fail to experience such a catchup in bone development. In a subanalysis, we compared patients who had ⱖ2 low values in one of the bone parameters or muscle CSA (group A) with the rest of the study population (group B). It is interesting to note that patients of group A were significantly younger at clinical manifestation of type 1 diabetes and still were younger at the time of pQCT measurement; they were also significantly shorter and weighed less. Cortical BMD and total, cortical, and mus-cle CSA were significantly lower in group A compared with both group B and the reference population. It could be speculated that an early age at onset of type 1 diabetes in a critical phase of growth and development could adversely influence bone development; this also was described by Lettgen et al.3
Physical exercise is encouraged and has favorable metabolic effects in patients with type 1 diabetes. The degree of physical fitness and engagement was normal in our patient population when compared with healthy children who were of similar age and gender and did not have diabetes.16Inadequate physical activity therefore is
an unlikely cause of low muscle CSA in our patients. Muscle CSA values were not influenced by parameters of metabolic control, insulin dose, or duration of type 1 diabetes. As expected, muscle CSA correlated signifi-cantly with total and cortical CSA levels, putting empha-sis on the importance of the muscle– bone unit.10 The
elevated grip strength in our study population probably was attributable to an intensive motivation of the pa-tients by the examiner. This short-time dynamic muscle force as measured by grip strength and our question-naire may not really reflect physical fitness. A more detailed evaluation of the type, duration, and intensity of physical activity would be necessary.
With regard to the pathogenesis of altered bone pa-rameters, it has been suggested that the absence of the anabolic action of insulin and IGF-1 on the skeleton might be the key, especially when metabolic control is unsatisfactory.30 Insulin deficiency may cause a
reduc-tion of osteoblast cell number.31 Animal and human TABLE 3 Subgroup Analysis
Parameter Group A
(n⫽18; 7 girls/11 boys)
Group B (n⫽70; 35 girls/35 boys)
Age at measurement, y 9.7⫾3.2a 12.2⫾3.0
Diabetes duration y 5.0⫾4.0 5.7⫾3.6 Age at manifestation y 4.6⫾2.4a 6.5⫾3.7
Height SD ⫺0.38⫾0.9a ⫺0.03⫾1.1
BMI SD 0.04⫾1.0a 0.50⫾0.8
Insulin dose, U/kg per d 0.8⫾0.3 0.8⫾0.2
HbA1c, % 7.3⫾1.2 7.7⫾1.3
Average HbA1c, % 7.3⫾1.3 7.6⫾1.1
Metaphyseal total BMD SD ⫺0.35⫾1.2 ⫺0.18⫾0.9 Metaphyseal trabecular BMD SD 0.04⫾1.2 0.4⫾1.0a
Diaphyseal cortical BMD SD ⫺0.9⫾1.3b 0.2⫾0.9
Diaphyseal total CSA SD ⫺2.1⫾1.3b ⫺0.3⫾1.0
Diaphyseal cortical CSA SD ⫺1.6⫾0.7b ⫺0.06⫾0.8
Diaphyseal muscle CSA SD ⫺1.0⫾0.7b ⫺0.05⫾0.8
Group A comprises patients withⱖ2 lower levels of bone or muscle parameters; group B comprises the rest of the patient population.
models of type 1 diabetes as well as histomorphic studies have demonstrated impaired bone turnover. The num-ber and the function of osteoblasts were decreased.31On
the contrary, in a study by De Leeuw et al,32 normal
trabecular bone volume and structure but reduced mag-nesium content of the trabecular bone was reported in iliac crest biopsies in adult patients with type 1 diabetes. The finding of normal parameters of bone formation and resorption in our study might be related to the relatively good metabolic control of the patients. We found a weak but significant correlation of IGF-1 levels with total, cortical, and muscle CSA. This may be attributable to advancing age, growth velocity, and puberty.
Limitations of our study were its cross-sectional char-acter and the problem of growth plate artifacts at the distal radius, which made a reevaluation of the scout view scan necessary. Exact positioning of the reference line is difficult but essential, especially in younger pa-tients.
CONCLUSIONS
Younger patients with type 1 diabetes seem to have altered bone geometry with reduced total and cortical CSA as well as lower muscle mass. However, this effect on bone and muscle seems to become normalized over time. Patients with early onset of type 1 diabetes may be more affected by metabolic derangement that is caused by the clinical manifestation that results especially in altered bone geometry than patients with an onset of type 1 diabetes later in life. Longitudinal data on bone development in patients with early and with late onset of type 1 diabetes will be needed to draw final conclu-sions about whether subnormal peak bone mass is asso-ciated with early manifestation of type 1 diabetes and accounts for the diabetic osteopenia in adult patients.
REFERENCES
1. Rosenbloom AL, Lezotte DC, Weber FT, et al. Diminution of bone mass in childhood diabetes.Diabetes.1977;26:1052–1055 2. Weber G, Beccaria L, de Angelis M, et al. Bone mass in young
patients with type 1 diabetes.Bone Miner.1990;8:23–30 3. Lettgen B, Hauffa B, Mo¨hlmann C, Jeken C, Reiners C. Bone
mineral density in children and adolescents with juvenile diabetes: selective measurement of bone mineral density of trabecular and cortical bone using peripheral quantitative com-puted tomography.Horm Res.1995;43:173–175
4. Gunczler P, Lanes R, Paz-Martinex V, et al. Decreased lumbar spine bone mass and low bone turnover in children and ado-lescents with insulin-dependent diabetes mellitus followed longitudinally.J Pediatr Endocrinol Metab.1998;11:413– 419 5. Heap J, Murray MA, Miller SC, Jalili T, Moyer-Mileur LJ.
Alterations in bone characteristics associated with glycemic control in type 1 diabetes mellitus adolescents.J Pediatr.2004; 144:56 – 62
6. Moyer-Mileur LJ, Dixon SB, Quick JL, Askew EW, Murray MA. Bone mineral acquisition in adolescents with type 1 dia-betes.J Pediatr.2004;145:662– 669
7. Roe TF, Mora S, Costin G, Kaufman F, Carlson ME, Gilsanz V.
Vertebral bone density in insulin-dependent diabetic children.
Metabolism.1991;40:967–971
8. Ponder SW, McCormik DP, Fawcett HD, et al. Bone mineral density of the lumbar vertebrae in children and adolescents with insulin-dependent diabetes mellitus.J Pediatr.1992;120: 541–545
9. De Schepper J, Smitz J, Rosseneu S, Bollen P, Louis O. Lumbar spine bone mineral density in diabetic children with recent onset.Horm Res.1998;50:193–196
10. Scho¨nau E. The development of the skeletal system in children and the influence of muscular strength. Horm Res.1998;49: 27–31
11. Kromeyer-Hauschild K, Wabitsch M, Kunze D, et al. Perzentile fu¨r den Body-mass-Index fu¨r das Kindes- und Jugendalter unter Heranziehung verschiedener deutscher Stichproben [Percentiles of body mass index in children and adolescents evaluated from different regional German studies].Monatsschr Kinderheilkd.2001;149:807– 818
12. Neu C, Manz F, Rauch F, Scho¨nau E. Bone density and bone size at the distal radius in healthy children and adolescents: a study using peripheral quantitative computed tomography.
Bone.2001;28:227–232
13. Neu C, Manz F, Rauch F, Scho¨nau E. Modeling of cross-sectional bone size and geometry at the proximal radius: a study of normal bone development using peripheral quantita-tive computed tomography.Osteoporosis Int.2001;12:538 –547 14. Bechtold S, Rauch F, Noelle V, et al. Musculoskeletal analyses
of the forearm in young women with Turner syndrome: a study using peripheral quantitative computed tomography.
J Clin Endocrinol Metab.2001;86:5819 –5823
15. Tanner JM. Growth at adolescence. In:The Development of the Reproductive System. 2nd ed. Oxford, United Kingdom: Blackwell; 1962;28 –39
16. Raile K, Kapellen T, Schweiger A, et al. Physical activity and competitive sports in children and adolescents with type 1 diabetes.Diabetes Care.1999;22:1904 –1905
17. Scho¨nau E, Neu CM, Rauch F, Manz F. The development of bone strength at the proximal radius during childhood and adolescence.J Clin Endocrinol Metab.2001;86:613– 618 18. Augat P, Gordon CL, Lang TF, Iida H, Genant HK. Accuracy of
cortical and trabecular bone measurements with peripheral computed tomography (pQCT). Phys Med Biol. 1998;43: 2873–2883
19. Rauch F, Neu CM, Wassmer G, et al. Muscle analysis by mea-surement of maximal isometric grip force: new reference data and clinical applications in pediatrics. Pediatr Res. 2002;51: 505–510
20. Rauch F, Scho¨nau E. Peripheral quantitative computed tomog-raphy of the distal radius in young subjects: new reference data and interpretation. J Muskuloskelet Neuronal Interact. 2005;5: 119 –126
21. Gunczler P, Lanes R, Paoli M, Martinez V, Villarel O, Weisinger JR. Decreased bone mineral density and bone formation mark-ers shortly after diagnosis of clinical type 1 diabetes mellitus.
J Pediatr Endocrinol Metab.2001;14:525–528
22. Ersoy B, Goksen D, Darcan S, Mavi E, Ozturk C. Evaluation of bone mineral density in children with diabetes mellitus.Indian J Pediatr.1999;66:375–379
23. Pascual J, Argent J, Lopez MG, et al. Bone mineral density in children and adolescents with diabetes mellitus type 1 of recent onset.Calcif Tiss Int.1998;62:31–35
24. Haffner SM, Bauer RL. The association of obesity and glucose and insulin concentrations with bone density in premeno-pausal and postmenopremeno-pausal women. Metabolism. 1993;42: 97–104
ab-sorptiometry in Spanish patients with insulin-dependent dia-betes mellitus.Calcif Tissue Int.1996;58:316 –319
26. Matthiassen B, Nielsen S, Ditzel J, Rodbro P. Long-term bone loss in insulin-dependent diabetes mellitus.J Intern Med.1990; 227:325–327
27. Hui SL, Epstein S, Johnston CC. A prospective study of bone mass in patients with type 1 diabetes.J Clin Endocrinol Metab.
1985;60:74 – 81
28. Valario G, del Puente A, Esposito-Puente A, Buono P, Mozzillo E, Franzese A. The lumbar bone mineral density is affected by long-term poor metabolic control in adolescents with type 1 diabetes mellitus.Horm Res.2002;58:266 –272
29. McNair P, Christiansen C, Christiansen MS, et al. Development of bone loss in insulin-treated diabetes: a 1 1/2 years follow-up study in sixty patients.Eur J Clin Invest.1981;11:55–59 30. Terada M, Inaba M, Yano Y. Growth-inhibitory effect of high
glucose concentration on osteoblast-like cells.Bone.1998;22: 17–23
31. Bouillon R, Bex M, Van Herck E, et al. Influence of age, sex and insulin on osteoblast function: osteoblast dysfunction in diabe-tes mellitus.J Clin Endocrinol.1995;80:1194 –1202
DOI: 10.1542/peds.2005-2193 originally published online August 14, 2006;
2006;118;e627
Pediatrics
Hans Peter Schwarz
Susanne Bechtold, Isa Dirlenbach, Klemens Raile, Vera Noelle, Walter Bonfig and
Bone Geometry: Data Using Peripheral Quantitative Computed Tomography
Early Manifestation of Type 1 Diabetes in Children Is a Risk Factor for Changed
Services
Updated Information &
http://pediatrics.aappublications.org/content/118/3/e627 including high resolution figures, can be found at:
References
http://pediatrics.aappublications.org/content/118/3/e627#BIBL This article cites 31 articles, 2 of which you can access for free at:
Subspecialty Collections
http://www.aappublications.org/cgi/collection/endocrinology_sub Endocrinology
following collection(s):
This article, along with others on similar topics, appears in the
Permissions & Licensing
http://www.aappublications.org/site/misc/Permissions.xhtml in its entirety can be found online at:
Information about reproducing this article in parts (figures, tables) or
Reprints
DOI: 10.1542/peds.2005-2193 originally published online August 14, 2006;
2006;118;e627
Pediatrics
Hans Peter Schwarz
Susanne Bechtold, Isa Dirlenbach, Klemens Raile, Vera Noelle, Walter Bonfig and
Bone Geometry: Data Using Peripheral Quantitative Computed Tomography
Early Manifestation of Type 1 Diabetes in Children Is a Risk Factor for Changed
http://pediatrics.aappublications.org/content/118/3/e627
located on the World Wide Web at:
The online version of this article, along with updated information and services, is
by the American Academy of Pediatrics. All rights reserved. Print ISSN: 1073-0397.