University of Pennsylvania
ScholarlyCommons
Publicly Accessible Penn Dissertations
1-1-2014
Essays in Health Economics and Public Finance
Boris Vabson
University of Pennsylvania, bvabson@wharton.upenn.edu
Follow this and additional works at:
http://repository.upenn.edu/edissertations
Part of the
Economics Commons
, and the
Health and Medical Administration Commons
This paper is posted at ScholarlyCommons.http://repository.upenn.edu/edissertations/2071
For more information, please contactlibraryrepository@pobox.upenn.edu.
Recommended Citation
Vabson, Boris, "Essays in Health Economics and Public Finance" (2014).Publicly Accessible Penn Dissertations. 2071.
Essays in Health Economics and Public Finance
Abstract
This dissertation focuses on topics in health economics and public finance. I deal with questions that have importance for health policy, and that are simultaneously of general economic interest; in particular, I consider the efficiency impact of privatization, the effects of competition in health care markets, and the effects of incomplete contracting and imperfect competition on rates of pass-through to consumers and governments.
In Chapter One, I examine the extent to which contracting out by governments yields efficiency
improvements, by looking to Medicaid contracting in New York State. To identify the efficiency impact of private, relative to public Medicaid, I exploit involuntary switching between the two; primarily, I leverage age-based rules forcing individuals to switch from private to public Medicaid at 65. I also leverage unique
administrative data, which longitudinally tracks individual utilization across the public and private Medicaid settings. I find evidence that private Medicaid yields efficiency improvements, but find no evidence that these improvements are passed on to either governments or patients. Instead, I find that pass-through is
substantially limited by incomplete contracting, with plans shifting costs to medical services that remain under government provision.
In Chapter Two, I examine the effects of cost-sharing among a previously understudied population-those dually enrolled in Medicaid and Medicare. I leverage an exogenous court ruling that resulted in loss of Medicaid coverage in Tennessee, among 25,000 individuals who had previously been dually-enrolled. This disenrollment resulted in an increase in average cost-sharing rates, from around 0% to around 20%. I find that this cost-sharing increase resulted in a utilization reduction of about 30%, implying an arc-elasticity in spending of about -.2.
In Chapter Three, with Mark Duggan and Amanda Starc, we examine how contracts are affected by their generosity, by looking to the Medicare Advantage program. In doing so, we exploit a substantial policy-induced increase in MA reimbursement in metropolitan areas with a population of 250,000 or more relative to MSAs below this threshold. Our findings also reveal that about one-eighth of the additional reimbursement is passed through to consumers in the form of better coverage.
Degree Type
Dissertation
Degree Name
Doctor of Philosophy (PhD)
Graduate Group
Applied Economics
First Advisor
Keywords
Cost-sharing, health care policy, Managed Care, Medicaid, Medicare, Privatization
Subject Categories
ESSAYS IN HEALTH ECONOMICS AND PUBLIC FINANCE
Boris V. Vabson
A DISSERTATION in
Applied Economics
For the Graduate Group in Managerial Science and Applied Economics
Presented to the Faculties of the University of Pennsylvania
ln
Partial Fulfillment of the Requirements for the
Degree of Doctor of Philosophy
201s
Supervisor of Disseriation
Mark G. Duggan, Wayne and Jodi Cooperman Professor of Economics, Stanford University
Graduate Group Chairperson
Signature
Eric Bradlow, K.P. Chao Professor; Professor of Marketing, Statistics, and Education, Wharton School, University of Pennsylvania
Dissertation Committee
Mark G. Duggan, Wayne and Jodi Cooperman Professor of Economics, Stanford Jonathan H. Gruber, Ford Professor of Economics, MIT
ESSAYS IN HEALTH ECONOMICS AND PUBLIC FINANCE
COPYRIGHT
2015
Dedication
Acknowledgements
This dissertation could not have been possible, …rst and foremost, without the many e¤orts of my parents. They grew up in a totalitarian Soviet society that was bleak for everyone, but especially bleak for Jewish families like ours. But rather than extinguish their love of life and knowledge, that darkness made it all the brighter and illuminates my life still. When I was …ve, they left the Soviet Union and brought me to America, in search of a better life. My parents began their American journey with nothing, and yet were ultimately able to give me everything. Thanks to them, over a twenty-…ve year timespan, I could go from being a Medicaid recipient to a Medicaid scholar. It is thanks to them that I also had a great amount of fun along the way, growing up in a beautiful Maine town, with all the amusements that this entailed: …shing in the summer, skiing in the winter, and lots more in between. While their expectations for me were perenially high, my parents simultaneously allowed me to succeed on my own terms, and to de…ne success for myself.
I must thank the many others who helped me on the way.
My undergraduate advisors from Dartmouth (Doug Staiger, Eric Zitzewitz, Chris Snyder, and Jon Zinman) …rst sparked my interest in economic research, and helped me develop economic intuition and data skills that will long serve me well. Doug Staiger and Jon Skinner also continued to be of immense help long after Dartmouth, providing me with data access and research support through the Dartmouth Institute; such support has been critical to the completion of this dissertation.
Thanks must also go to the members of my dissertation committee, particularly Mark Duggan and Jon Gruber. Mark and Jon have taught me a substantial amount about the conceptual as well as methodological aspects of research, through our shared co-authored work as well as through their oversight on my sole-authored papers. They have been a joy to work with, personally as well as professionally. Mike Sinkinson, Amanda Starc, and Bob Town also have provided fantastic research support. In addition, I would like to thank Jon Kolstad, who has been a great research mentor and also a great friend (and who would have been on my committee, absent his move to Berkeley!)
I would like to thank my fellow pre-docs at NBER, particularly Adam Sacarny and Mark Shepard, for all that they taught me and for their many insights and feedback. But of all of my fellow graduate students, I would most like to thank Jacob Wallace, who has taught me a great amount about Medicaid and whose research has done much to enhance my own; most importantly, he has been an incredible friend.
I would like to thank Colleen Fiato at New York State’s Department of Health for her help with obtaining SPARCS discharge data. I would also like to thank Jean Roth for her help with data applications and data processing.
ABSTRACT
ESSAYS IN HEALTH ECONOMICS AND PUBLIC FINANCE
Boris V. Vabson
Mark G. Duggan
This dissertation focuses on topics in health economics and public …nance. I deal with questions that have importance for health policy, and that are simultaneously of general economic interest; in particular, I consider the e¢ ciency impact of privatiza-tion, the e¤ects of competition in health care markets, and the e¤ects of incomplete contracting and imperfect competition on rates of pass-through to consumers and governments.
In Chapter One, I examine the extent to which contracting out by governments yields e¢ ciency improvements, by looking to Medicaid contracting in New York State. To identify the e¢ ciency impact of private, relative to public Medicaid, I exploit involuntary switching between the two; primarily, I leverage age-based rules forcing individuals to switch from private to public Medicaid at 65. I also leverage unique ad-ministrative data, which longitudinally tracks individual utilization across the public and private Medicaid settings. I …nd evidence that private Medicaid yields e¢ ciency improvements, but …nd no evidence that these improvements are passed on to either governments or patients. Instead, I …nd that pass-through is substantially limited by incomplete contracting, with plans shifting costs to medical services that remain under government provision.
In Chapter Two, I examine the e¤ects of cost-sharing among a previously un-derstudied population-those dually enrolled in Medicaid and Medicare. I leverage an exogenous court ruling that resulted in loss of Medicaid coverage in Tennessee, among 25,000 individuals who had previously been dually-enrolled. This disenrollment re-sulted in an increase in average cost-sharing rates, from around 0% to around 20%. I …nd that this cost-sharing increase resulted in a utilization reduction of about 30%, implying an arc-elasticity in spending of about -.2.
Table of Contents
ACKNOWLEDGEMENT...iv
ABSTRACT...v
CHAPTER 1...1
CHAPTER 2...71
CHAPTER 1: The Magnitude and Incidence of
E¢ ciency Gains Under Contracting: Evidence
from Medicaid
1
Introduction
Governments contract a vast array of services to private …rms, rather than
admin-istering these services directly; in the United States alone, contracting accounts for
almost 10% of GDP.
Governments contract with the expectation that private …rms produce services
more e¢ ciently, and that e¢ ciency gains from contracting could be passed through
to either governments (via cost-savings) or program recipients (via quality
improve-ments) (Savas 1977, Savas 1987). Unfortunately, there has been limited examination
of contracting’s e¢ ciency impact, along with the magnitude of pass-through to various
parties.
To examine these questions, I focus on contracting in the public health insurance
setting, speci…cally within Medicaid. While this setting should be generalizable to
other forms of contracting, Medicaid also has substantial policy importance, in its
own right. Medicaid expenditures for 2013 stood at $449 billion, or 2.5% of GDP,
and Medicaid currently covers more individuals (55 million) than any other insurance
program in America, including Medicare (CMS, 2013). In addition, contracting has
been pervasive in this setting, with private plans covering 60% of all Medicaid enrollees
(KFF, 2011) and taking in $130 billion annually (DHHS, 2013); by comparison, typical
annual spending on unemployment insurance is $30-40 billion (Whittaker et al, 2014).
This paper has additional policy relevance, given that it focuses on Medicaid
contracting among a speci…c group-the disabled. This group accounts for a
dispro-portionate 40% of Medicaid spending (while making up only 15% of enrollees), yet
has been understudied relative to lower cost groups. Moreover, government
expendi-tures on disabled programs are substantial, with health care accounting for the largest
As is the case elsewhere, contracting within Medicaid involves the outsourcing of
provision to third parties (outside insurers); simultaneously, it involves a change in
the nature of that provision, with a shift from a fee-for-service to a capitated managed
care set-up.
To start, I examine the extent to which private Medicaid, through this combination
of managed care and capitation-yields e¢ ciency improvements, and the mechanisms
through which it does so. Here, I de…ne e¢ ciency improvements as reductions to care
that patients wouldn’t want (such as unnecessary or preventable visits), as opposed to
care that patients would want (such as elective surgeries, which could improve patient
welfare). In doing so, I contribute to an existing literature (Cutler and Sheiner 1998,
Cutler et al 2000, Landon 2012, Pinkovskiy 2013), while overcoming two issues that
have hindered past research.
One issue is an identi…cation problem (enrollment composition di¤erences between
managed & non-managed care), which I overcome through a novel approach. I
lever-age a New York rule barring most Medicaid recipients over 65 from private Medicaid;
this rule results in substantial involuntary switching from private to public Medicaid
at the age of 65. For my secondary identi…cation strategy, I focus on cases of
invol-untary switching in the reverse direction-from public to private Medicaid.1 Finally,
where possible, I combine these two strategies as a robustness check, by instrumenting
for pre-65 private Medicaid status.
Another issue is data-related (limited information on activity within managed
care plans), which I overcome by linking together several unique administrative data
sets from New York State. In doing so, I construct an individual-level panel on
hospital and prescription drug utilization, across the private and public Medicaid
1This was driven by Medicaid managed care enrollment mandates, which have been featured in
settings. Critically, inclusion in this panel is not conditional on utilization. Detailed
information in the data allows me to precisely construct treatment & control groups,
and to implement a rich set of controls.
I also examine the incidence of e¢ ciency gains under Medicaid contracting, while
measuring pass-through in a broader and more precise fashion than the existing
lit-erature (Duggan 2004, Aizer et al 2007, Duggan et al 2013). Further, I consider how
factors such as incomplete contracting limit the pass-through of e¢ ciency gains.2 In
this paper, I focus on a particular form of incomplete contracting (of limited scope),
and identify the bene…t from broadening an existing contract along that dimension.
Finally, I consider whether the for-pro…t status of a contracted insurer a¤ects the
size of e¢ ciency gains, contributing to an existing literature on for-pro…t status across
insurance and other …rm types (Dafny et al 2013, Duggan 2000).
In examining these questions, I look to disabled Medicaid recipients in New York
during the period between 1999 and 2010. I focus on the disabled population, given
that e¢ ciency improvements may be easier to detect (and also bring about) among
a high-cost group, and also given that Medicaid policies pertaining to them remain
unsettled. I also focus on this population for empirical reasons; the disabled are
the primary group enrolled in Medicaid immediately pre-65 (the age discontinuity on
which I focus), and also experience less churn into and out of Medicaid than other
populations. Finally, I focus on New York, on account of unique administrative data
covering that state.
I …rst consider private Medicaid’s e¤ect on inpatient and ER care, since this would
be a likely setting for e¢ ciency improvement. I …nd that private Medicaid results in
2In the literature, incomplete contracting is de…ned as possible limitations in contractual
a highly signi…cant, 15% reduction in overall inpatient utilization. Four-…fths of this
decrease can be attributed to a reduction in prevention sensitive visits, including
a 30% reduction in hospital readmissions, while non-preventable visits see a more
modest reduction. This utilization reduction does not appear to come from shifts to
more e¢ cient hospitals, but may instead arise from changes to outpatient care, or
from within-hospital changes to treatment. Given that these utilization reductions
do not appear to adversely a¤ect patient welfare, I conclude that they are e¢ ciency
improving.
In addition, I examine the incidence of e¢ ciency gains under contracting,
…nd-ing no evidence of pass-through to governments via cost sav…nd-ings. Altogether, I can
rule out a reduction in government spending in excess of 6%, with 95% con…dence.
Further, I examine how incomplete contracting reduces pass-through, by identifying
counterfactual cost levels under a more complete contract. To do so, I look to
med-ical services, particularly prescription drugs, that were not …nancially integrated into
private Medicaid contracts, and that remained covered by New York State. I …nd
evi-dence that private plans cost-shifted to these services, as their use increased by about
15% following involuntary switching into private plans. In addition, eventual …nancial
integration of these services into existing private contracts resulted in a comparable
15% drop in drug utilization (through the implementation of a formulary), and in a
4% decline in overall contracting costs (that is, in overall government spending).
Finally, I …nd suggestive evidence that for-pro…t contractors (relative to
not-for-pro…ts) are more e¢ cient, as they achieve lower inpatient utilization, and do so
pri-marily through reductions to prevention-sensitive visits.
Altogether, my …ndings have substantial implications for Medicaid policy, given
the prevalence of Medicaid contracting and given proposals to further expand it. I
I also identify the policy design that could maximize pass-through of these gains.
In Section 2, I review the basic characteristics of public and private Medicaid
systems, and go over relevant institutional features of New York Medicaid. In Section
3, I review the administrative data from New York State underlying my analyses. In
Section 4, I go over my empirical design and implementation. In Section 5 and 6, I
discuss my empirical …ndings and concurrently test their robustness. In Section 7, I
conclude.
2
Contracting out of Medicaid Services
When Medicaid was initially introduced in 1965, only the ’public’ version of
it was o¤ered, which was administered directly by states, through a fee-for-service
framework. In the 1980’s, however, governments increasingly began to contract out
Medicaid (along with other government services) to third parties, given theoretical
bene…ts that could result from capitation and from competition (Hansmann 1980,
Donahue 1989). However, as governments contracted out Medicaid coverage, they not
only changed the source of that provision, but also the very nature of it; while
pub-lic Medicaid was based on a fee-for-service framework, private Medicaid was largely
based on capitated managed care. As such, the impact of contracting out Medicaid
services is not only dependent on the economics of contracting, but also dependent
on the economics of capitation & managed care. Below, I go over the basic
char-acteristics of managed care and fee-for-service delivery frameworks. I also go over
institutional aspects of the New York Medicaid program that are relevant to my
2.1
Background on Managed Care
Capitated managed care plans, which …rst appeared in the 1980’s, are characterized
by an active involvement in patient care, and by the variety of strategies they adopt
for improving e¢ ciency. Managed care plans are also characterized by the sharp
incentives they face, through capitation; under capitation, plans receive …xed
pay-ments for each enrollee, irrespective of the amount of health care the enrollee uses. In
these respects, managed care di¤ers substantially from fee-for-service (FFS) delivery
systems, in which an insurer acts as little more than an intermediary, and does not
proactively shape enrollees’care.
Managed care plans could achieve e¢ ciency improvement, …rst, through e¤orts at
care coordination; plans usually designate a primary care provider to oversee patient
care, especially for those with chronic conditions. Such coordination could
miti-gate acute health episodes, and thereby reduce preventable utilization. In addition,
managed care could achieve e¢ ciency improvement by requiring special approval for
certain visits and procedures; this occurs through a process called ’utilization review’.
Finally, managed care plans could improve e¢ ciency by featuring more e¢ cient
providers in their networks. Given that enrollees would have to either pay higher cost
sharing for out-of-network utilization (or in some cases, be prohibited from it entirely),
this could directly translate into more e¢ cient care. More generally, provider network
formation could also reduce provider prices, through negotiation (Zwanziger et al
2000); however, within Medicaid, provider pricing is actually around 15% higher
under the private option, given administrative rate setting under the public option.
While previous literature has found evidence of lower provider prices under
man-aged care (Cutler et al 2000), evidence on its quantity impact is more mixed. The
most accepted …ndings may come from the RAND Health Insurance Experiment,
(Man-ning et al 1987). However, the RAND experiment …ndings are dated and could also
have limited external validity.
Previous studies have been constrained by enrollment di¤erences between
man-aged and non-manman-aged care; these enrollment di¤erences, along with advantageous
se-lection into managed care, have been extensively documented (Morrissey 2012, Brown
et al 2014). Further, there is limited individual-level data available on treatment
within managed care plans, particularly in Medicaid and Medicare. Private managed
care plans participating in these programs are typically not required to turn over
claims data, and the limited data that are turned over appear to be of questionable
quality (Lewin Group 2012).
2.2
Private Medicaid Nationwide
Governments began contracting out Medicaid provision in the early 1980’s, with
an aim towards quality improvements and cost savings. However, previous studies
have o¤ered no evidence of cost savings to governments, and in fact some evidence
of cost increases, as a result of Medicaid contracting (Duggan 2004, Song et al 2012,
Duggan et al 2013).
Medicaid currently serves over 65% of enrollees through some form of managed
care, although managed care’s share is highest among lower-cost groups such as
chil-dren (at around 80%) and lowest among the disabled (at around 25%) (KFF 2012).
Given the limited number of high-cost Medicaid enrollees enrolled in managed care,
payments to these plans account for only about 20% of Medicaid expenditures.
How-ever, a number of states have or are in the process of shifting high-cost Medicaid
enrollees (including the disabled), into managed care plans.3
3Besides New York, these include California, Florida, Illinois, Louisiana, Ohio, and Texas (Sparer
Incidentally, Medicare contracting also began during this period, with private
Medicare currently covering about 30% of Medicare recipients (McGuire et al 2011).
There is signi…cant heterogeneity across states in terms of the design of their
privatized Medicaid systems. For example, there is signi…cant variation in the types
of insurers that states contract with, such as for-pro…ts, and heterogeneity in ease of
market entry. Moreover, there is heterogeneity in the scope of services that managed
care plans are allowed to cover. To this end, some states do not permit private
plans to cover long-term care or prescription drug care, or mental health care, and
instead administer these service on behalf of all Medicare recipients (including those
in the private option). Further, there is cross-state variation in whether enrollment
in private Medicaid is required, optional, or even available for a given group (Duggan
et al 2013).
2.3
Private Medicaid in New York State
New York State began contracting out Medicaid coverage in the 1990’s, but
re-tained a public version of Medicaid alongside the private option. Initially, all Medicaid
recipients eligible for the private option could remain under the public system.
Fur-thermore, certain types of Medicaid recipients were ineligible for the private option;
these included long-term nursing home residents & dual-eligibles (those Medicaid
re-cipients who were simultaneously in Medicare). Consequently, most of those who
were enrolled in private Medicaid plans would get disenrolled at the age of 65, given
the typical onset of dual-Medicare/Medicaid enrollment at that age (Sparer 2008).
To increase the share of Medicaid recipients in private plans, New York started
making enrollment in these plans mandatory-rather than optional-beginning with
non-disabled Medicaid recipients. These requirements, referred to as ’enrollment
enrollment mandates initially applied only to children and TANF adults in New York
Medicaid. Disabled Medicaid recipients were not subject to these mandates until
2005, when they were introduced speci…cally for this group (Sparer 2008). Just as
with the previous non-disabled ’mandates’, these were rolled out on a pre-planned
timetable, and on a county by county basis (Sparer 2008). Concurrent with these
mandates, enrollment in private Medicaid plans increased from 600,000 in the mid
1990’s to 2.5 million in 2009 (New York Medicaid & Medicaid Managed Care
Enroll-ment Data).
In terms of scope of coverage, New York’s private Medicaid plans initially covered
inpatient, outpatient, and certain long-term care services; however, by law, these
plans could not cover particular medical services, such as prescription drugs and
mental health. These ’carved-out’services continued to be directly administered and
paid for by the state. Starting in October 2011, however, New York State integrated
prescription drug services into all existing private Medicaid contracts.
In terms of market access, insurers generally enjoyed free entry into the
market-place, so long as they provided basic proof of competence and quali…cation. Insurers
could enter the market at the county-level, and thereby be active in some counties
and not in others. While entry was open to all forms of insurers, including for-pro…t
and not-for-pro…t, the preponderance of active insurers were not-for-pro…t.
Payment levels to each insurer were determined through negotiation between that
insurer and the state government. Prior to 2008, New York state did not explicitly
risk-adjust payments, to account for the health status of each Medicaid recipient
3
Data
In this paper, I use several administrative datasets from CMS and New York State,
containing information on overall Medicaid & on private Medicaid enrollment status,
along with inpatient, ER, and drug utilization. Uniquely, this utilization data is
structured as an individual-level panel, tracking those in private Medicaid, public
Medicaid, as well as those who switch between the public & private options. Another
unique feature of the data is that sample selection is not conditional on utilization;
even those with zero inpatient/ER activity remain included.
The structure of this data allows me to overcome issues hampering previous
re-search. First, the data source typically used in Medicaid research, stand-alone
dis-charge data, su¤ers from a sample selection issue; inclusion in it is conditional on
hospitalization (on a related point, stand-alone discharge data has a cross-sectional,
rather than panel structure). Further, the alternative-private Medicaid utilization
data-has been di¢ cult to obtain and has been of questionable quality even when
available (Lewin Group, 2012).
Using information contained in the administrative data, I can precisely construct
cohorts that are relevant to my analyses. First, I restrict to New York State
Medic-aid recipients, who quali…ed for the program as a result of disability (formally, this
group is referred to as non-elderly SSI recipients), and who were enrolled during that
particular month & year.
For my analyses of utilization e¤ects, I focus on those Medicaid recipients who
were not simultaneously-enrolled in Medicare, pre-65. I further restrict to individuals
who were in the original sample just before they reached the age of 65, while focusing
on the age range immediately around 65.
limit to individuals who were already enrolled in Medicaid (either public or private)
at the start of 2004. This restriction is meant to guard against sample
composi-tion changes, given that the implementacomposi-tion of mandates could result in changing
entry/exit into Medicaid (Currie and Fahr 2005).
3.1
Individual Characteristics and Enrollment Information
I use administrative data from CMS (Centers for Medicare & Medicaid Services),
which covers New York State for the 1999-2010 period. The data contains
person-month level demographic and Medicaid/Medicare enrollment information; it speci…es
private Medicaid status, the general reason for Medicaid eligibility, and concurrent
Medicare enrollment status. Using this information, I can restrict to those who are
in Medicaid by virtue of disability. In addition, I can track whether individuals were
simultaneously eligible for Medicare. Finally, I can control for certain demographic
characteristics such as county of residence, age, and date of birth.
For those in private Medicaid, the CMS data also tracks the speci…c plan that
someone’s enrolled in, at a person-month level, based on a ’Plan ID’. Using
sup-plemental data obtained from New York State, I identify which of these plans are
for-pro…t and which are not-for-pro…t.
3.2
Inpatient and ER Utilization Metrics
I track inpatient and emergency room usage for everyone in Medicaid, including
those enrolled in the private option. I do so by linking together Medicaid enrollment
data (obtained from CMS) and visit-level hospital/ER data (obtained from New York
in both data, which was obtained through special administrative permissions.4 The data contains every single inpatient visit made by New York Medicaid recipients,
throughout the 1999-2010 period; the data on ER and ambulatory care visits,
mean-while, covers the 2005-2010 period.
Unfortunately, I do not have visit-level information on outpatient activities, which
account for 65% of health care spending for this population. This said, the inpatient
and ER settings could be likely sites for e¢ ciency improvements, as these represent
particularly expensive forms of treatment. As such, even if reductions in inpatient
uti-lization are o¤set by increases in outpatient utiuti-lization (o¤sets which-unfortunately-I
can’t explicitly measure), such reductions should still be worthwhile. Further,
vari-ous information in the inpatient data can proxy for outpatient utilization, as I will
describe.
This data provides information on the timing of each hospital visit, at a
month-year level. The data also provides visit-level information on treatment intensity and
composition, including the length of hospital stay, types and number of procedures
performed, and total (pre-discounted) hospital charges. I also identify surgical and
non-surgical visits, using a DRG cross-walk obtained from the Dartmouth Institute
for Health Policy and Clinical Practice. In addition, this data provides information on
the source of care, such as whether a hospital admission originated from ER. Finally,
the data speci…es the name and location of the hospital visited, allowing me to compile
additional hospital characteristics measures, and also measure each patient’s travel
time to the hospital (in miles and minutes).
4Linking was conducted using a combination of the last four digits of individuals’ SSN, dates
& years of birth, gender, and county of residence; in combination, these variables uniquely identify Medicaid recipients over 99.9% of the time. The Medicaid recipients that were not uniquely identi…ed were excluded from the sample.
For most of my analyses, I aggregate this data to a person-month level, and
include those without any utilization as part of the sample (as such, sample selection
is not conditional on having a hospital/ER visit). Information on each individual’s
Medicaid status (as well as private Medicaid status) is taken from the original CMS
…les, rather than from the discharge data; in doing so, I bypass possible issues of
payer mischaracterization/miscoding in the discharge data.
In Table 1, I present average, annualized utilization measures for my main analytic
sample (those between 63 and 67, who were Medicaid-only enrolled at 63). I break
these measures out for two separate groups-those initially in private Medicaid and
those in the public option-who correspond to our treatment and control groups. I
…nd that those initially in private Medicaid have substantially lower utilization (by
20-30%) than those in the public option, although the extent to which this is driven
by enrollment composition rather than treatment di¤erences is not readily apparent.
3.3
Inpatient Quality of Care Metrics
To measure quality of care, I rely on outside measures of hospital quality. and also
construct metrics using existing algorithms.
To gauge inpatient care quality, I look to CMS quality measures. These measures
consist of risk-adjusted mortality and readmission rates for each hospital, for heart
attacks, heart failure, and pneumonia. As an additional metric of quality, I use the
60-day hospital readmission rate, which can proxy for the quality of inpatient as well
as outpatient care.
Given that I do not have outpatient claims data, I cannot directly identify the
quality of outpatient care. Instead, to gauge this, I combine my discharge and ER
data with existing algorithms. First, I use an algorithm developed by AHRQ, which
treatment. In addition, I identify ER visits that were non-emergency or preventable,
using an algorithm developed by the NYU Center for Health and Public Service
Research.
In Table 1, I present average, annualized quality of care measures for my treatment
& control groups. These measures indicate that those in public Medicaid have higher
rates of readmissions and preventable ER visits, although this could partly be a
function of their higher overall levels of utilization.
3.4
Government Expenditures Metrics
I construct individual-level measures of government Medicaid expenditures, using
…elds from the CMS administrative data. I track Medicaid spending at a
person-month level, including the overall level and spending on various subcategories of care
(such as long-term care, inpatient care, and pharmaceuticals). Separately, I track
government payments to private Medicaid plans, at a person-month level, for each
private Medicaid enrollee
3.5
Pharmaceutical Data
I track prescription drug utilization, using claims-level data obtained from CMS. This
data covers all Medicaid recipients in New York (including those in private Medicaid
plans), for the 1999-2011 period. Prior to October 2011, prescription drug utilization
was tracked directly by the state, for all Medicaid recipients (including private ones).
For the period subsequent to October 2011, the data also covers public and private
enrollees, but it comes from two di¤erent sources-New York state and private plans.5
5At that point, private plans started covering drug services directly, and also became responsible
This data includes information on the types of drugs bought, including individual
drug-identi…ers (NDC codes), as well as generic vs. non generic status. In addition,
the data speci…es the quantity of each drug included in a prescription, the overall
cost of that drug, the …ll date associated with each claim, along with the ID of the
prescribing physician. Finally, the data includes bene…ciary-level identi…ers, which
facilitate linking to other administrative Medicaid data.
3.6
Additional Data
I obtain county-level data, from the New York State Department of Health, on
the timetable of New York’s private Medicaid Enrollment Mandates. These mandates
were implemented in a staggered fashion, across counties and across years. New York
State implemented two di¤erent types of enrollment mandates-one speci…c to children
& non-disabled adults (non-SSI) and the other speci…c to disabled & other populations
(SSI). For the timetable of disabled (SSI) mandates, see Appendix Table 11. Note
that the mandates were fully implemented about one year subsequent to the listed
’o¢ cial’dates.
4
Identi…cation and Empirical Strategy
Public and private Medicaid not only di¤er in the treatment they provide patients,
but also in their enrollment composition; in fact, when the choice between public and
private Medicaid is voluntary, private Medicaid typically attracts a healthier set of
enrollees (Glied 2000, Morrissey 2012, Brown et al 2014). As such, any naive
compari-son between public and private Medicaid may capture patient composition di¤erences
between the two, rather than possible treatment di¤erences. To decompose the e¤ects
individ-uals involuntarily switch between the public and private options; in such situations,
only private Medicaid enrollment status will change, while patient composition will
remain …xed
For my primary identi…cation strategy, I implement a di¤erences-in-discontinuities
strategy. This strategy leverages involuntary switching from private to public
Med-icaid at the age of 65, among those initially in the private option. This involuntary
switching is driven by a New York State rule prohibiting private Medicaid enrollment
among those simultaneously in Medicare; Medicare eligibility, meanwhile, typically
arises at 65. Given that my identi…cation strategy relies, at least indirectly, on the
the age 65 Medicare eligibility rule, it relates to the approach taken by Card, Dobkin,
and Maestas (2008) in their study on Medicare. Altogether, those initially in the
private option, pre-65, will make-up the treatment group, while those initially in the
public option will form the control group. Both the treatment and control groups will
be restricted to those who were only in Medicaid (and not simultaneously enrolled in
Medicare), pre-65.
Not everyone in the treatment group will be subject to the actual treatment (a
small fraction will remain in private Medicaid, post-65, as some are ineligible for
Medicare post-65 6); as such, the results would capture an intent-to-treat e¤ect, and
would need scaling to re‡ect the e¤ect of the actual treatment.
At 65, those switching from private to public Medicaid will concurrently gain
Medicare coverage, requiring that I separate out the e¤ect of Medicare. My research
design facilitates this, given that the control group gains Medicare coverage, but has
unchanging Medicaid status. As such, the di¤erential between the treatment and
control group e¤ects would re‡ect the impact of private Medicaid disenrollment.
6To be eligible for Medicare at 65, an individual must be a U.S. citizen or permanent resident,
The primary identifying assumption is that Medicare’s e¤ect is identical across
the privately and publicly Medicaid enrolled. This identifying assumption could be
threatened if Medicare’s e¤ect is heterogeneous across sickness levels. To address
this concern, I re-run all of these analyses using an instrumented measure of private
(as opposed to public) Medicaid status, immediately pre-65; this instrument can be
constructed using my secondary identi…cation strategy, which I review below. With
this instrument, I can set private Medicaid status to be independent of health and
other characteristics, and thereby satisfy the identifying assumption.
Another identifying assumption is that no di¤erential pre-trends exist between the
treatment and control groups. As part of this, the assumption is that individuals are
not strategically delaying or hastening care, in anticipation of coverage changes at
65. To con…rm the validity of this assumption, I check for visual as well as statistical
evidence of di¤erential pre-trends.
A …nal identifying assumption here is that no concurrent changes are taking place
at 65 (apart from those mentioned above), which would di¤erentially impact the
treatment group. One potential concern, that individuals’employment status often
changes at that age, should not be applicable to the sample here; the treatment as
well as control groups are made up entirely of SSI disability recipients, who have
limited labor market activity. No other relevant changes appear to take place then,
such as to medical coverage, disability status, or employment.
Altogether, the estimating equation for the primary analysis takes the following
form, for individual i, at time t.
yit= + 0 InitiallyP vti+ 1 P ost65it+ 2InitiallyP vti P ost65it+Xit +"it
(Equation #1)
control for age. For this baseline speci…cation, the sample is restricted to disabled
Medicaid enrollees in New York in 1999-2010.
Since the estimated value of 2 will re‡ect the intent-to-treat impact, it needs
to be scaled to re‡ect the actual e¤ect of treatment, based on the fraction of those
initially in private Medicaid actually switching to the public option, at 65.
As part of my secondary identi…cation strategy, I focus on involuntary switching
from public to private Medicaid plans; this takes place under newly introduced
enroll-ment requireenroll-ments-or ’mandates’-that required certain groups of Medicaid recipients
to enroll in the private option. As previously discussed, I also combine this secondary
strategy with my primary strategy, as a robustness test of the results from the
pri-mary strategy alone. My identifying variation is based o¤ county-time heterogeneity
in the implementation of these enrollment requirements. For disabled Medicaid
recip-ients, the introduction of these enrollment requirements began in 2005 and continued
through the end of my study period.7
Even among this treatment group, of Medicaid-only enrollees, some individuals
may be exempt from mandated private Medicaid enrollment. Unfortunately, the
nature of these exemptions makes it di¢ cult to identify who is and who isn’t exempt;
moreover, since exemption status may be endogenous to health status, individuals
with exemptions remain as part of the sample.8
Altogether, the key instrument here is based on whether an enrollment mandate
was ALREADY in e¤ect in an individual’s county of residence. Below, I present the
…rst stage regression for this, estimating the e¤ect of mandates on private Medicaid
7By the end of the study period, about 80% of disabled New York Medicaid recipients lived
in a county with an ’enrollment’ mandate in e¤ect. Note that before the implementation of these mandates, Medicaid recipients had the option to voluntarily enroll in private Medicaid, and about 35% of them did so.
8Exemptions were made for those qualifying as dual-eligibles, mental health patients, long-term
enrollment status, for individual i, in county c, at time t. I also include ‡exible controls for age, along with a county speci…c time trend, as well as county, gender
and quarter-year …xed e¤ects.
P vtM edicaidStatusict= + 0 P ostM andatect+Xict +"ict
(Equation #2)
In the second stage regression, shown below, I estimate the e¤ect of private
Med-icaid on outcome variable y, for individual i, in county c, at time t. I include a
linear control for age, along with gender, year, and county …xed e¤ects. I also include
controls for county and group-speci…c linear trends, across the treatment and control
groups.
The coe¢ cient, 0, captures the causal e¤ect of private Medicaid enrollment on
various outcome variables of interest.
yict= + 0P vtM edicaidStatus\ ct+Xict +"ict
(Equation #3)
For this identi…cation strategy to be valid, on its own, mandate counties must be
on parallel trends to non-mandate counties, or the non-parallel trends should be fully
captured by my linear and trend controls. However, when this strategy is combined
with my primary one, these identi…cation assumptions can be substantially relaxed.
5
Results
5.1
The Impact of Age 65 & of Enrollment Mandates on
Managed Care Enrollment Status
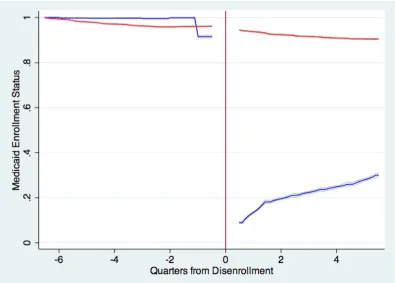
In Figure 1, I graphically document a sharp drop in private Medicaid enrollment
rates-at age 65-among those initially in private Medicaid (as of age 63). This decline at
65 is much sharper than the prevailing pre-65 downward trend in Medicaid enrollment
rates. Further, no corresponding change is observed at 65, among the group initially
in public Medicaid.
Next, I statistically document this relationship, and …nd that about two-thirds of
those initially in private Medicaid switch to the public option, at age 65 (the relevant
point estimate is found in Table 2, column one, under the Post65*InitiallyPrivate
term). For these analyses, I use the baseline speci…cation (Equation 1), where the
outcome of interest is at a person-month level, and the sample is restricted to those
who were in Medicaid-only (by virtue of disability) at age 63, and to the 63 to 67 age
range.
The measured e¤ect is two-thirds, rather than complete (that is, not all of those
initially in private Medicaid involuntarily switch to the public option, at 65). This can
be partly attributed to ongoing switching from private to public Medicaid over the
pre-period, among 20% of the original cohort (as implied by the point estimate on the
Initially Private term, in column one). Further, many of those in private Medicaid will
not be forced to switch to the public option at 65, as not all will be Medicare-eligible
at that age (which is the underlying driver of private Medicaid disenrollment).9 Given
that private Medicaid disenrollment only a¤ects part of my ’treatment’group, at 65,
my main estimates will re‡ect an ’intent-to-treat’ e¤ect rather than the impact on
those ’actually treated.’ As such, to get at the actual treatment e¤ect, my results
will need to be scaled by 1.5.
I perform an additional robustness check, examining whether the treatment and
9To be eligible for Medicare at 65, an individual must be a U.S. citizen or permanent resident,
control groups gain supplemental Medicare coverage at the same rate, at 65. I …nd
no statistically signi…cant di¤erence in the rates at which these groups obtain such
coverage at 65 (around 80% gain coverage, as reported in column 2).
The Impact of Enrollment Mandates
I also explore the impact of enrollment mandates on switching from public to
private Medicaid. Altogether, I …nd that the imposition of mandates was associated
with a 20-30% increase in the corresponding share of Medicaid recipients in the
pri-vate option. The results are presented in Appendix Table 1, based on the baseline
speci…cation (from Equation 2). These estimates are robust to the inclusion of
addi-tional controls and sample restrictions, including the use of dual-enrollees in Medicaid
and Medicare as a control group (since these individuals are exempt from mandates).
The e¤ect of mandates on private Medicaid status is somewhat limited, since
certain Medicaid recipients (such as long-time nursing home residents) are not subject
to them. Unfortunately, there is no way to precisely identify individuals who are
exempt, based on the information contained in the administrative data, resulting in
some exempt individuals being assigned to my treatment group.
5.2
The Impact of Private Medicaid on Overall Inpatient
Utilization
Using my primary instrument for private/public Medicaid status, I consider
its e¤ect on overall inpatient hospital use, as well as inpatient use on the extensive
margin. While hospital care accounts for over one-third of health care spending,
the e¤ects observed in this setting might not carry over to other settings; rather,
hospital care reductions may be o¤set by outpatient care increases. However, previous
osensible e¢ ciency improvements in this setting might not be an artifact of e¢ ciency
deteriorations elsewhere.
Further, the hospital setting may be a sensible setting for detecting e¢ ciency
improvement, given that hospital care is expensive relative to other medical services.
As a corollary, the magnitude of e¢ ciency improvement in the inpatient setting-from
managed care-might not be representative of the impact on other care settings.
In my main results, my instrument for private (as opposed to public) Medicaid
en-rollment status is based on whether someone initially in private Medicaid has reached
65. My sample restrictions remain unchanged from before, with the
observation-level being at a person-month observation-level and sample selection not being conditional on
utilization. I present a companion set of results, based o¤ my secondary instrument
(enrollment mandates), in the Appendix.
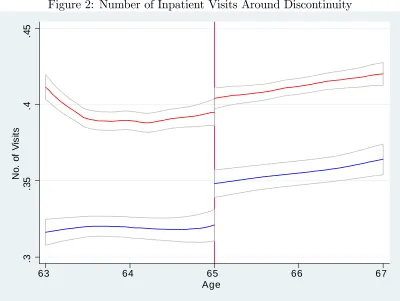
In Figures 1 and 2, I document a sharp jump in annual inpatient days and total
hospital visits, at 65, among those initially in private Medicaid. Further, I show
that this discontinuity is absent among those initially in public Medicaid. Finally,
I document an absence of di¤erential pre-trends and …nd no evidence of di¤erential
post-trends (suggesting that my results are not driven by pent-up demand). Since
the colored bands in this graph re‡ect 95% con…dence intervals, these e¤ects appear
to be statistically signi…cant.
I proceed to statistically examine the e¤ect of age 65 on various annualized
mea-sures of inpatient utilization, such as the number of visits and the inpatient days
stayed. My estimates, which are presented in Table 3, imply that switching from
private to public Medicaid results in an approximately 20% increase in individual
inpatient utilization. The e¤ects on number of hospital visits and other utilization
metrics (such as annualized days in hospital) appear comparable, suggesting that
decompos-ing the extensive (vs intensive) margin e¤ects could be challengdecompos-ing, given possible
extensive margin changes to visit composition. As shown in the bottom two panels,
my estimates are also robust to using a narrower age window (64 to 66), and also
to instrumenting for initial private status using my secondary strategy. The latter
strategy is meant to con…rm that the main e¤ect is not driven by di¤erential impact
of supplementary Medicare coverage, particularly across health levels.
In Table 3, the key point estimates are found under the Initially Private*Post 65
term, and need to be scaled by 1.5 to get at the actual e¤ect of switching from private
to public Medicaid (given that 65% of those initially in private Medicaid switched
to public Medicaid, at 65). For example, for total days stayed (under column 1),
the point estimate of .335 in the top panel implies that switching from private to
public Medicaid results in .50 (or 18%) more annual days in the hospital. Given the
corresponding standard error, I can rule out an increase under 9%, or above 27%, with
95% con…dence. In addition, I …nd that the point estimate on the Post 65 term is a
relatively modest -.064, and is not highly signi…cant; this suggests that the additional
onset of Medicare eligibility, at 65, does not have a meaningful e¤ect on utilization
among the control group. This limited impact should ease concerns about possible
threats to identi…cation, from onset of supplemental Medicare eligibility. Finally,
I …nd that the point estimate on the Initially Private Medicaid term is a highly
signi…cant -1.201; this estimate re‡ects the magnitude of advantageous selection into
private Medicaid.
In Appendix Table 3, I present results for these same outcome variables, using
an alternate identi…cation strategy (enrollment mandates). While the main point
estimates for these results are not signi…cant, this could be largely a function of larger
standard errors. In fact, the 95% con…dence intervals from this approach contain the
5.3
The E¤ect of Private Medicaid on E¢ ciency of Inpatient
Care
I then examine whether lower hospital utilization under private Medicaid comes from
e¢ ciency improvements, or instead comes from reduced patient welfare. To do so,
I divide hospital visits into prevention-sensitive and non-prevention sensitive
cate-gories. Prevention sensitive visits, such as readmissions or ER visits, could be
re-duced through improved inpatient & outpatient care, and without adverse impact
to patients. Meanwhile, a reduction in non-prevention sensitive visits, such as joint
surgeries, may not re‡ect increased e¢ ciency and would be more likely to adversely
impact patients. The sample selection and empirical approach here is consistent with
the previous section’s.
In Figure 3, I document a sharp jump in readmissions among the treatment group,
at 65, without any corresponding change among the control group. In addition, the
…gure provides no evidence of di¤erential pre-trends across the treatment and control
groups, and no evidence of attenuation of the e¤ect over the post-period.
In statistical analyses, I …nd that switching from private to public Medicaid is
accompanied by a substantial increase in prevention-sensitive visits, which include
readmissions, admissions from the ER, and ’avoidable’admissions (per AHRQ’s
clas-si…cation). Simultaneously, I …nd a much less pronounced increase in non-prevention
sensitive care, such as general surgeries and joint/hip replacements. These results are
presented Table 4, with the estimates being consistent across the three panels. For
example, I …nd that switching from private to public Medicaid is accompanied by
an increase in person-year readmissions of .027 (or 25%), given the point estimate of
.018 on the Initially Private*Post 65 term in the top panel (which needs to be scaled
result from improved inpatient as well as outpatient care. Meanwhile, I …nd that
under switching, non ER and non-readmission visits, per person-year, increase only
by about .010 (or 7%), which represents a much more modest increase.
I also statistically examine the e¤ect of switching from private to public Medicaid
on additional measures of patient welfare, such as distance traveled to hospital and
the quality of hospitals visited. Given that these measures are conditional on
hos-pitalization, I structure the analytic data to be at a hospitalization (rather than at
a person-month) level. I also include DRG (diagnosis group) …xed e¤ects as part of
these analyses, so that my estimates are robust to potential compositional changes to
hospitalizations. In the results, which are shown in Table 5, I …nd that such switching
has no signi…cant impact on patients’ travel times to hospitals, and can rule out a
change of greater than 2%, with 95% con…dence. More generally, in results not shown
here, I …nd no e¤ect from private Medicaid on hospital network breadth, as private
plans’networks appear comparable in completeness to the FFS network. I also …nd
no evidence of a meaningful e¤ect on the quality or type of hospital visited, based on
hospital-level measures such as risk-adjusted mortality and readmissions rates. For
these measures, I …nd the estimated e¤ects to be insigni…cant, and can generally rule
out e¤ects of greater than 1% of the baseline, with 95% con…dence.
Altogether, these results suggest that reduced inpatient utilization under private
Medicaid may re‡ect e¢ ciency improvement, rather than reduced patient welfare.
In Appendix Table 3, I focus on these same outcome variables, while using an
alternate instrument for private Medicaid enrollment status (enrollment mandates).
There, I …nd no signi…cant e¤ect of private Medicaid enrollment on these measures;
however, the standard errors are again quite large, with the 95% con…dence intervals
5.4
Private Medicaid’s Impact on Quantity and E¢ ciency of
Outpatient Hospital Care
I also examine the causal e¤ect of private vs. public Medicaid enrollment on
outpa-tient hospital utilization; given that some outpaoutpa-tient hospital care is relatively
ex-pensive and also potentially preventable, a reduction in such visits could also re‡ect
e¢ ciency improvements. As previously, my measures re‡ect annualized utilization at
a person-month level; I also implement the baseline controls and sample restrictions
from before.
I statistically examine the e¤ect of switching from private to public Medicaid on
prevention sensitive types of outpatient visits (such as ER ones), along with visits that
are less sensitive to prevention (such as outpatient surgeries). I …nd a substantial and
highly signi…cant e¤ect on overall ER Visits (including those that do not result in
inpatient admissions), along with an e¤ect on a subclass of ER visits that is designated
as particularly preventable. Meanwhile, I …nd no signi…cant e¤ect on outpatient
surgeries. Altogether, this suggests that private Medicaid a¤ects outpatient hospital
utilization primarily through reductions to prevention-sensitive visits. The results are
reported in Table 6.
For general ER visits, the point estimate of .055 on the key term of interest, Init
Private*Post 65, and when properly scaled implies that there about .082 (or about
11%) more ER visits per year under public than under private Medicaid. In addition,
for outpatient hospital surgeries, the key point estimate is insigni…cant, and suggests
5.5
Mechanisms Behind Private Medicaid’s E¢ ciency
Im-pact
In the previous tables, I provided some evidence that private Medicaid enhances
ef-…ciency. I proceed by focusing on a speci…c type of prevention sensitive visit-inpatient
readmissions.
First, I show that most of the reduction in these readmissions-under private
Medicaid-cannot be explained by compositional changes to initial visits. Rather,
the e¤ect on readmissions remains even when holding the composition of initial
ad-missions …xed; this suggests that reduced readmission rates could re‡ect improved
e¢ ciency, rather than something unrelated. In addition, I show that the reduction in
readmissions cannot be explained by shifts to more e¢ cient hospitals.
In these analyses, I structure my data to be at an individual hospitalization level
and restrict the data to initial admissions. Otherwise, I incorporate the baseline
sample restrictions and controls from before. The outcome variable of interest denotes
the likelihood of readmission within 60-days of the initial admission, and as such is
binary. I present estimates for various analyses in Table 7, for the key variable,
Initially Private*Post 65; these need to be further scaled by 1.5 to re‡ect the actual
e¤ect of switching from private to public Medicaid.
When not conditioning on either the site of the initial hospitalization, nor on
the type of initial hospitalization, the point estimate (in column one) implies that
the conditional probability of a readmission is 3.6% higher under public than under
private Medicaid (the baseline likelihood is 16%). I …nd that this e¤ect is attenuated
by eighth when including diagnostic class (DRG) …xed e¤ects, and that about
one-third of the e¤ect disappears when including more granular diagnosis (ICD-9) …xed
hospital …xed e¤ects (corresponding to the site of initial hospitalization). Since the
aforementioned mechanisms may explain only about a third of private Medicaid’s
e¤ect, the mechanisms for the remaining two-thirds of the e¤ect remain unaccounted
for. Based on conversations with various stakeholders, these mechanisms may include
supply shifts, in terms of changing within-hospital behavior. These mechanisms could
also include changes to outpatient care, such as increased home care immediately
following a hospitalization.
I perform additional statistical analyses on whether this readmissions e¤ect could
be explained by shifts to more e¢ cient hospitals. As part of my implementation, I
…rst construct a hospital-level measure of readmissions rates. This measure is derived
by looking to the public Medicaid population, regressing on likelihood of readmission
(conditional on initial admission), and subsequently backing out hospital-level …xed
e¤ects. In identifying these hospital-level …xed e¤ects, I also control for individual
level demographics (age and race) and for the nature of the initial hospitalization
(using ICD-9 …xed e¤ects). The results, which are presented in Table 8, suggest that
only 5% of the estimated e¤ect on readmissions (or .001 readmissions out of .024, per
person-year), are attributable to shifts to other hospitals.
Unfortunately, I am unable to further delve into these mechanisms, given my
current data.
5.6
Pass-Through to Governments
In the previous section, I provided evidence of e¢ ciency gains, under Medicaid
pri-vatization, and also showed that there’s no evidence of pass-through to patients. I
proceed to further explore the incidence of e¢ ciency gains under Medicaid
privatiza-tion, by examining possible pass-through to governments, in the form of cost savings.
pri-mary identi…cation strategy, as I am unable to track spending among those
concur-rently in Medicare (hence, I am largely unable to track spending in the post-period).
Instead, I instrument for private Medicaid status using my secondary strategy, of
enrollment mandates. In constructing a measure of total government spending, at a
person-quarter level, I include government spending on all those in public Medicaid
(in the form of fee-for-service payments) and those in private Medicaid (in the form
of premium payments to insurers). I also include government spending on medical
services that remain directly administered and paid for by the government, even for
those in private Medicaid plans (such services are referred to as ’carve-outs’). Given
that managed care implementation may alter the overall composition of enrollees in
Medicaid (Currie and Fahr 2005), I restrict my sample to those in Medicaid in the
year preceding the mandates (2004). The results of these analyses are presented in
Table 9.
First, I …nd no evidence of a reduction in overall government spending, under
privatization. Rather, given the point estimate and standard error shown in column
1, I can rule out a spending reduction from privatization in excess of 5%, with 95%
con…dence. This result is robust to di¤erent time trends.
In addition, I examine the e¤ect of Medicaid privatization on government
spend-ing on ’carved-in’ services; such services are …nancially and logistically covered by
private plans (for anyone enrolled in them). By focusing on these services, I am able
to get at privatization’s …scal impact, independent of certain manifestations of
in-complete contracting (such as cost-shifting to services that are universally covered by
the government, even for those in private Medicaid). I …nd that when looking to such
’carved-in’spending, the point estimate on my instrument is not statistically
signi…-cant, even though it is negative. Part of the limited cost-savings observed here-even
reim-bursement levels, which are about 15% higher under private than public Medicaid.
As such, limited pass-through to governments could partly be explained by provider
capture of some portion of e¢ ciency gains.
I also …nd evidence that pass-through could be further limited by incomplete
contracting. To this end, under privatization, I identify a 15% increase in expenditures
on ’carved-out’ services, or services that were covered by the government (even for
those in private Medicaid). This increase could be an attempt by plans to cost-shift
towards services for which they don’t bear costs, while substituting away from those
services for which they are …nancially responsible. In the following section, I further
explore this phenomenon, and examine whether it is a causal result of incomplete
contracting, or an artifact of something unrelated.
5.7
Identifying the Extent to Which Incomplete Contracting
Reduces Pass-Through
While spending on carved-out services, such as prescription drugs, is higher under
private than under public Medicaid, this isn’t necessarily indicative of cost shifting
by plans. For instance, such carved-out services may coincide with relatively e¢ cient
forms of care; as such, private Medicaid plans (or managed care plans generally)
may use more of these services, even if incurring the complete cost. To decompose
the e¤ects of incomplete contracting from those of private/managed care, I focus on
prescription drug services, which accounted for the plurality of all carved-out
ser-vices spending. I …rst examine the e¤ect of private Medicaid (relative to public) on
the use of these services, while these were excluded from private Medicaid contracts;
the result of this analysis captures the combined e¤ects of managed care and
October 2011, when they were bundled into existing contracts (and plans were made
…nancially responsible for them); here, only the e¤ect of incomplete contracting would
be captured, separate from that of managed care.
E¤ ect of Incomplete Contracting: Under Switch Between Public &
Pri-vate Medicaid
When examining the impact of private Medicaid enrollment on prescription drug
utilization, I instrument for private Medicaid status using enrollment mandates (my
secondary identi…cation strategy, involving involuntary shifts from public to private
Medicaid). The results, which can be found in the top panel of Table 10, indicate that
individual-level switching from public to private Medicaid is associated with a highly
signi…cant 15-20% increase in prescription drug spending (by the government). This
increase is not accompanied by a corresponding change in the number of prescriptions,
and I can rule out an increase in excess of 9%, with 95% con…dence. As such, increases
in drug spending could instead come through changing prescription composition, such
as the use of more branded or of fewer generic drugs. These more expensive drugs
could more e¤ectively substitute for other types of care, such as hospital or outpatient
services; as such, plans would have every incentive to use these expensive drugs (given
they don’t bear their cost), since these could substitute for services that plans would
otherwise have to pay for.
I also instrument for private Medicaid status using my primary strategy, involving
age 65. However, the results from this strategy might not re‡ect the true magnitude
of cost changes; individuals here would be switching from private to public Medicaid,
and inertia could bias against downgrading to less expensive drugs, but might not
bias against upgrading to more expensive ones. This said, while the estimates here
are more modest, they still imply 10% higher drug expenditures under public than
to ensure consistency with the top panel, I invert the coe¢ cient of interest to be
Initially Private*Pre 65 (rather than Initially Private*Post 65). While the top panel
focuses on the mandate period of 2004-2010, the bottom panel extends from 1999
to 2005. The bottom panel excludes the subsequent period, given the 2006 shift in
drug coverage from Medicaid to Medicare (from the intro of Part D), for those with
supplementary Medicare coverage.
E¤ ect of Incomplete Contracting: Under Bundling of Prev. Excluded
Services
I proceed to examine the e¤ect of bundling prescription drug services into existing
private Medicaid contracts, which was implemented in October 2011. I try to capture
the di¤erence between an incomplete contract and a (more) complete counterfactual
(at least with respect to prescription drug services), while holding other factors
con-stant. For example, the set of active contracts does not change throughout the period
on which I focus (three months pre and post), making my results robust to
compo-sitional changes in contracts. Further, I hold …xed the set of enrollees, focusing on
disabled individuals who were enrolled in private Medicaid three months prior to the
carve-in (July 2011), and still enrolled as of December 2011 (note that this amounts
to about 95% of the original July cohort). Unfortunately, since my data only extends
through December 2011, I will mostly be capturing the short-run and not the long-run
e¤ect.
Altogether, I …nd that bundling reduces prescription drug expenditures, and that
this reduction is driven primarily by shifts to less expensive drugs (rather than by
a decrease in the overall number of prescriptions). I also demonstrate that these
results are not driven by pre-trends. This said, I do …nd evidence of a post-trend,
which suggests the e¤ect of bundling isn’t instantaneous. The estimates using this