DEVELOPMENT AND VALIDATION OF ANALYTICAL METHOD FOR FLUCONAZOLE AND IVERMECTIN IN TABLET FORMULATION BY USING RP-HPLC
5
0
0
Full text
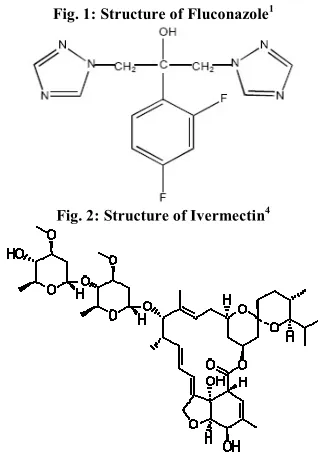
(2) Harod S. Sanjay et al. IRJP 2012, 3 (8) Accuracy To a pre-analyzed sample solution (100µg/ml for FLUC and 104 µg/ml for IVR), a definite concentration of mixed standard drugs were added. Spiking of concentration of the pre-analyzed sample was done by 80 µg/ml, 100 µg/ml and 120 µg/ml for FLUC and for IVR was done by 83 µg/ml, 104 µg/ml and 124 µg/ml. Triplicate injections for each spiked concentration were injected.9-10 Precision The repeatability study of the drug was performed for three times in the concentration range of 50-150 µg/ml for FLUC and 52-156 µg/ml for IVR. The intermediate precision was performed by doing day to day variation and analyst to analyst variation. Intermediate precision study of the drug was performed for three times in the concentration range of 50-150 µg/ml for FLUC and 52-156 µg/ml for IVR. As per ICH norms, %RSD for area should be Not More Than 2%.9-10 Robustness As per ICH norms, small but deliberate variations by altering the operating conditions such as flow rate and/or ratio of the mobile phase were made to check the method’s capacity to remain unaffected. Three injections of 100 µg/ml for FLUC and 104 µg/ml for IVR were injected and flow rate was varied by ±0.2 ml/min. Change in the ratio of mobile phase was done by varying the concentration in range of ±5%. Triplicate injections of formulation were injected and results were analyzed. As per ICH norms, %RSD for area should be Not More Than 2%.9-10 RESULT AND DISCUSSION The goal of this study was to develop a rapid HPLC method for analysis of Fluconazole and Ivrmectin in its bulk and Tablet formulation using a commonly used reverse phase C18 column. To develop an effective method for the analysis of drug, preliminary tests were performed in order to select adequate and optimum condition parameter such as detection wavelength, ideal mobile phase and its combination. Separation of drugs was achieved by using HPLC system with UV absorbance detector set at 254 nm. Mobile phase used for separation was Acetonitrile:Methanol:Water (75:15:10 v/v/v). Inertsil C18 column (250 mm x 4.6mm, 5 µ) was used a stationary phase containing silica gel. Linearity was observed over a concentration range of 50-150 µg/ml for. Fluconazole and 52-156 µg/ml for Ivermectin. Correlation coefficient was observed 0.999 for both the drugs. In order to validate the accuracy of method, recovery studies were performed. 99.830% and 100.814% amount were recovered for Fluconazole and Ivermectin respectively. The %RSD for area was less than 2, which indicate the accuracy of the method. Precision studies were carried out by studying repeatability studies and intraday precision. %RSD values for areas were observed to be less than 2% and hence it indicates that method is precise. Small and deliberate variations were applied to method parameters in order to assess robustness of the method. %RSD values for area was observed to be less than 2%. This value indicates that method is robust. CONCLUSION The following research was done in order to develop a simple, precise and accurate method for analysis of Fluconazole and Ivermectin in bulk and tablet formulation using RP-HPLC. The validation parameters for the analytical method suggest that method is economical and simple and can be used for routine analysis of the drugs. Fig. 1: Structure of Fluconazole1. Fig. 2: Structure of Ivermectin4. Fig.3: Chromatogram of Fluconazole and Ivermectin. Page 258.
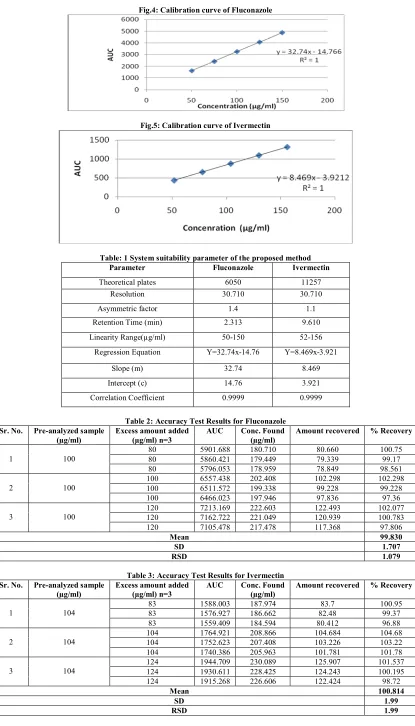
(3) Harod S. Sanjay et al. IRJP 2012, 3 (8) Fig.4: Calibration curve of Fluconazole. Fig.5: Calibration curve of Ivermectin. Table: 1 System suitability parameter of the proposed method Parameter Fluconazole Ivermectin Theoretical plates Resolution. 6050 30.710. 11257 30.710. Asymmetric factor. 1.4. 1.1. Retention Time (min). 2.313. 9.610. Linearity Range(µg/ml). 50-150. 52-156. Regression Equation. Y=32.74x-14.76. Y=8.469x-3.921. Slope (m). 32.74. 8.469. Intercept (c). 14.76. 3.921. Correlation Coefficient. 0.9999. 0.9999. Sr. No.. Pre-analyzed sample (µg/ml). 1. 100. 2. 100. 3. 100. Sr. No.. Pre-analyzed sample (µg/ml). 1. 104. 2. 104. 3. 104. Table 2: Accuracy Test Results for Fluconazole Conc. Found Excess amount added AUC (µg/ml) n=3 (µg/ml) 80 5901.688 180.710 5860.421 179.449 80 80 5796.053 178.959 100 6557.438 202.408 100 6511.572 199.338 100 6466.023 197.946 120 7213.169 222.603 120 7162.722 221.049 120 7105.478 217.478 Mean SD RSD Table 3: Accuracy Test Results for Ivermectin Excess amount added AUC Conc. Found (µg/ml) n=3 (µg/ml) 83 1588.003 187.974 83 1576.927 186.662 83 1559.409 184.594 1764.921 208.866 104 104 1752.623 207.408 104 1740.386 205.963 124 1944.709 230.089 124 1930.611 228.425 1915.268 226.606 124 Mean SD RSD. Amount recovered. % Recovery. 80.660 79.339 78.849 102.298 99.228 97.836 122.493 120.939 117.368. 100.75 99.17 98.561 102.298 99.228 97.36 102.077 100.783 97.806 99.830 1.707 1.079. Amount recovered. % Recovery. 83.7 82.48 80.412 104.684 103.226 101.781 125.907 124.243 122.424. 100.95 99.37 96.88 104.68 103.22 101.78 101.537 100.195 98.72 100.814 1.99 1.99. Page 259.
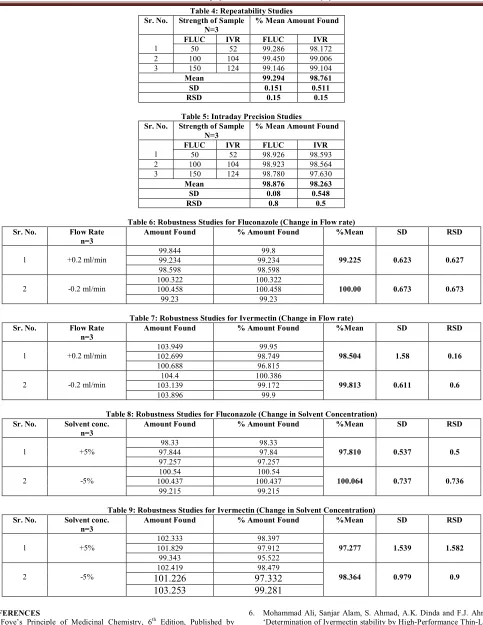
(4) Harod S. Sanjay et al. IRJP 2012, 3 (8) Sr. No. 1 2 3. Sr. No. 1 2 3. Sr. No.. Flow Rate n=3. 1. +0.2 ml/min. 2. -0.2 ml/min. Sr. No.. Flow Rate n=3. 1. +0.2 ml/min. 2. -0.2 ml/min. Sr. No. 1. 2. Sr. No. 1. 2. Table 4: Repeatability Studies Strength of Sample % Mean Amount Found N=3 FLUC IVR FLUC IVR 50 52 99.286 98.172 100 104 99.450 99.006 150 124 99.146 99.104 Mean 99.294 98.761 SD 0.151 0.511 RSD 0.15 0.15 Table 5: Intraday Precision Studies Strength of Sample % Mean Amount Found N=3 FLUC IVR FLUC IVR 50 52 98.926 98.593 100 104 98.923 98.564 150 124 98.780 97.630 Mean 98.876 98.263 SD 0.08 0.548 RSD 0.8 0.5. Table 6: Robustness Studies for Fluconazole (Change in Flow rate) % Amount Found %Mean Amount Found 99.844 99.234 98.598 100.322 100.458 99.23. 99.8 99.234 98.598 100.322 100.458 99.23. SD. RSD. 99.225. 0.623. 0.627. 100.00. 0.673. 0.673. SD. RSD. 98.504. 1.58. 0.16. 99.813. 0.611. 0.6. SD. RSD. 0.537. 0.5. 0.737. 0.736. SD. RSD. 1.539. 1.582. 0.979. 0.9. Table 7: Robustness Studies for Ivermectin (Change in Flow rate) % Amount Found %Mean Amount Found 103.949 102.699 100.688 104.4 103.139 103.896. 99.95 98.749 96.815 100.386 99.172 99.9. Table 8: Robustness Studies for Fluconazole (Change in Solvent Concentration) Solvent conc. % Amount Found %Mean Amount Found n=3 98.33 98.33 +5% 97.810 97.844 97.84 97.257 97.257 100.54 100.54 -5% 100.064 100.437 100.437 99.215 99.215 Table 9: Robustness Studies for Ivermectin (Change in Solvent Concentration) Solvent conc. Amount Found % Amount Found %Mean n=3 102.333 98.397 +5% 97.277 101.829 97.912 99.343 95.522 102.419 98.479 -5% 98.364 101.226 97.332. 103.253 REFERENCES 1. Foye’s Principle of Medicinal Chemistry, 6th Edition, Published by Volters Klaver (India) Pvt. Ltd. New Delhi. Page No. 1116-1120. 2008. 2. Martindale “The Extra Pharmacopeia”, ed. Reynolds, J.E.F. 31st Edition, Royal Pharmaceutical Soc, London. Page No. 404-406. 1996. 3. Wallace, J.E., Harris, S.C. Gallegos, Jarrett, Foulds, G. Chen, T.J.H., Rinaldi, M.G., Antimicrobial agents and Chemotherapy, 1992, 36(3), 603-606. 4. Omura, S.; Shiomi, K. (2007). "Discovery, Chemistry, and Chemical Biology of Microbial Products". Pure and Applied Chemistry 79 (4): 581–591. 5. Elena Gabriela Oltean ‘Development and Validation of a RP-HPLC Method for the quantitation studies of Ivermectin in solutions dosage forms’. Veterinary Pharmacon, Volume 5, Page 68-70, December 2011.. 99.281 6.. 7.. 8.. Mohammad Ali, Sanjar Alam, S. Ahmad, A.K. Dinda and F.J. Ahmad, ‘Determination of Ivermectin stability by High-Performance Thin-Layer Chromatography’. International Journal of Drug Development and Research, Volume 3, Page 240-247, April-June 2011. Nalini Shastri, Pothana Sadasivudu, M. Sadanandam, ‘Development and Validation of RP-HPLC and UV methods of analysis for Fluconazole in Pharmaceutical Solid Dosage Forms’. International Journal of ChemTech Research, Volume 1st, Page No. 1131-1136, OctoberDecember 2009. Al-Rimawi F. ‘Development and Validation of Analytical Method for Fluconazole and Fluconazole Related Compounds (A, B, and C) in Capsule Formulations by HPLC with UV Detection’. Jordan Journal of Chemistry, Volume 4, Page No. 357-365, 2009.. Page 260.
(5) Harod S. Sanjay et al. IRJP 2012, 3 (8) 9.. International Conference on Harmonization (ICH), Q2A: Text on Validation of Analytical Procedures: Definitions and Terminology, Vol. 60, US FDA Federal Register, 1995.. 10. International Conference on Harmonization (ICH), Q2B: Validation of Analytical Martinda, The Complete Drug Reference; Pharmaceutical Press: London 2002, 33rd edition, 321-323.. Source of support: Nil, Conflict of interest: None Declared. IRJP is an official publication of Moksha Publishing House. Website: www.mokshaph.com. All rights reserved.. Page 261.
(6)
Figure
Related documents
As the region of high speed wind is limited and also the area required for installation of conventional windmill is high, bladeless windmill based on vortex induced
ACS: abdominal compartment syndrome; AKI: acute kidney injury; CO: cardiac output; CPP: cerebral perfusion pressure; CVP: central venous pressure; DAMPs: damage-associated
Para lo cual se cumplirán los siguientes objetivos específicos: Determinar la composición corporal (masa visceral, masa ósea, % grasa, % agua corporal total) mediante
For instance, by virtue of being close to the source of research data, academic librarians or other local data curators could work directly with researchers to process and
Two of the four recognised species of the genus are infectious hae- matopoietic necrosis virus (IHNV), the aetiological agent of infectious haematopoietic necrosis (IHN), and
At a time when research is promoted as a core activity within national health care systems, it is ironic that the bureaucratic complexity of research governance in the United
We used a thematic analysis [50] to summarize respondents ’ major thoughts and concerns about post-mortem needle biop- sies, including acceptable motivations for conducting
• The cattle that showed clinical signs before day 16 (early cases) stayed for a long time in the herd, and were culled only after a few days, while cattle that became sick later
