Available online at www.ijpsdr.com
International Journal of Pharmaceutical Sciences and Drug Research 2013; 5(3): 113-119
113
Research Article
ISSN 0975-248X
Standardization Study of Poly Herbal Formulation - Caspa Drops
J Sojitra
1, P Dave
1, K Pandya
2*, V Parikh
2, P Patel
2, G Patel
21K. S. K. V Kachchh University, Mundra Road, Bhuj-370 001, Gujarat, India
2Vasu Research Centre (A Division of Vasu Healthcare Pvt Ltd.), 896/A, GIDC, Makarpura,
Vadodara-390 010, Gujarat, India
ABSTRACT
Standardization of Ayurvedic formulations is an important step for the establishment of a consistent biological activity, chemical profile, or simply a quality assurance program for production and manufacturing of herbal drugs. WHO specifies guidelines for the assessment of the safety, efficacy and quality of herbal medicines as a prerequisite for global harmonization. Hence it is very essential to ensure that each packet sold in the market is standardized. In this research work, a polyherbal formulation (PHF), Caspa Drops has been taken to establish its standardization level using various physico-chemical parameters. For raw material various parameters such as pH, Moisture content, ash values, HPTLC fingerprinting, assays of marker compounds etc. were carried out to confirm their quality and potency. The presence of the raw materials in the finished product was carried out with the aid of sophisticated instruments. Study results revealed that product was well standardized at selected analytical parameters. All the tests were carried out in triplicates after which their SD was calculated. All the raw materials as well as finished product were found free from heavy metal and microbial contaminants.
Keywords:Standardization, HPTLC, Caspa Drops, Polyherbal Syrup formulation.
INTRODUCTION
Plants contain several hundred constituents and some of them are present at very low concentrations. In spite of the modern chemical, analytical procedures available, rarely any phyto-chemical investigations succeed in isolating and characterizing all secondary metabolites present in the plant extract. Apart from this, plant constituents vary considerably depending on several factors that impair the quality control of phytotherapeutic agents. [1] Quality control and standardization of herbal medicines involve several steps. However, the source and quality of raw materials play a pivotal role in guaranteeing the quality and stability of herbal preparations. Thus, in the present study, Polyherbal Syrup formulation (Caspa Drops) has been selected to establish its standardization status. The key ingredients used in the formulation are Extract of Anethum sowa (Soa) Fruit2,
Acorus calamus (Vacha) Rhizome [2], Plumbago zeylanica
(Chitrak) Root [2], Apium graveolens (Ajmoda) Fruit [2],
Mentha sylvestris (Pudina) Leaves [2], Aconitum
heterophyllum (Ativisha) Root Tuber [2], Caesalpinia crista (Latakaranj) Seed[2], Embelia ribes(Vidang) Fruit[2],
*Corresponding author: Ms. Kruti Pandya,
Vasu Research Centre (A Division of Vasu Healthcare Pvt Ltd.), 896/A, GIDC, Makarpura, Vadodara-390 010, Gujarat, India; Tel.:+91-265-2657701 / 02, +91-9227788565; Fax:
+91- 265-2647331; E-mail: [email protected], [email protected]
Elettaria cardamomum (Elaichi) Fruit [2], Hedychium
spicatum (Shati) Rhizome [2], Holarrhena antidysenterica (Indrayav) Seed[2]and Powder of Kala namak (Black salt)[2], Saindhav (Rock salt)[2], Ferula foetida(Hingu)[2]and Citrus
acidaFruit Juice (Nimbuk). [2]
MATERIAL AND METHODS
Organoleptic parameters: Organoleptic parameter like appearance, colour and odour were used to confirm uniformity in visual identity of raw materials and finished product. The results are as tabulated in Table 1.
Physicochemical parameters for extracts: The physico-chemical parameters includes tests like Moisture content / Loss on drying [3], pH [3], Alcohol soluble extractive [3], Water soluble extractive [3], Determination of ash [3], Acid insoluble ash[3], and Water soluble ash[3]of the relevant raw materials. The results are as tabulated in Table 2 & 3.
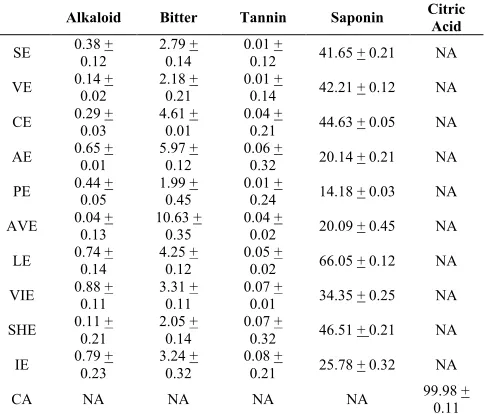
Estimation of Actives:Assay analysis includes estimation of Alkaloid[4], Bitter[4], Tannin[4], Saponin[4]and Citric Acid[5] in respective extracts. The results are as tabulated in Table 4.
Evaluation of Standardization Parameters selected for Finished Product:The finished product was analyzed for its physical appearance, pH, Specific gravity [3], Viscocity. [3] The results are as tabulated in Table 5.
Microbial Analysis [6]: Bio-burden analysis consists of parameters like Total Bacterial Count, Total Fungal Count and Presence of pathogens such as Escherichia coli,
Table 1: Organoleptic parameters and ingredient’s part used
Ingredient Parts used Colour Organoleptic charactersOdour Taste
SE Fruit Brown coloured fine powder Aromatic Acrid pungent VE Rhizome Dark Brown coloured fine powder Characteristic Characteristic CE Root Brown coloured fine powder Characteristic Acrid Bitter AE Fruit Brown coloured fine powder Strong aromatic Acrid pungent PE Leaves Translucent crystals Strong mentholated Acrid pungent AVE Root Tuber Dark Brown coloured fine powder Characteristic Bitter
LE Seed Light Brown coloured fine powder Characteristic Bitter VIE Fruit Dark Brown coloured fine powder Characteristic Astringent
EE Fruit Dark brown coloured viscous liquid Pleasant Aromatic Bitter SHE Rhizome Dark Brown coloured fine powder Characteristic Characteristic
IE Seed Dark Brown coloured fine powder Characteristic Bitter KN Salt Light Pink coloured fine powder Characteristic sulphorus Salty SD Salt White Crystalline Powder Characteristic Salty HI Exudates Creamish coloured fine powder Strong aromatic Acrid CA Fruit Juice Hazy white liquid Characteristic Characteristic
SE: Soa Extract, VE: Vacha Extract, CE: Chitrak Extract, AE: Ajmoda Extract, PE: Pudina Extract, AVE: Ativish Extract, LE: Latakaranj Extract, VIE: Vidang Extract, EE: Elaichi Extract, SHE: Shati Extract, IE: Indrayav Extract, KN: Kala namak, SD: Saindhav HI: Hingu Powder and CA: Citrus acida Fruit Juice; NA: Not Applicable
Table 2: Physicochemical parameters
Ingredients pH M/S (by LOD) %
SE 5.03 + 0.02 2.27 + 0.06 VE 3.80 + 0.12 2.21 + 0.14 CE 4.44 + 0.25 2.89 + 0.03 AE 4.52 + 0.15 3.82 + 0.02 PE 4.99 + 0.12 7.06 + 0.25 AVE 3.73 + 0.23 3.05 + 0.52 LE 5.04 + 0.35 3.19 + 0.12 VIE 5.58 + 0.12 4.27 + 0.32 EE 4.04 + 0.03 4.50 + 0.35 SHE 4.56 + 0.01 5.07 + 0.35 IE 4.02 + 0.05 2.07 + 0.02
CA NA 0.29 + 0.01
SE: Soa Extract, VE: Vacha Extract, CE: Chitrak Extract, AE: Ajmoda Extract, PE: Pudina Extract, AVE: Ativish Extract, LE: Latakaranj Extract,
VIE: Vidang Extract, EE: Elaichi Extract, SHE: Shati Extract, IE: Indrayav Extract; CA: Citrus acida Fruit Juice; LOD: Loss on Drying; NA: Not Applicable
Table 3: Extractive values and Ash Value of Ingredients of Caspa Drops Ingredients WSE (%) ASE (%) TA (%) AIA
SE 88.08 + 0.02 96.06 + 0.01 7.66 + 0.12 1.90 + 0.12 VE 90.65 + 0.01 90.27 + 0.01 9.87 + 0.11 31.23+ 0.21 CE 94.32 + 0.05 98.30 + 0.12 4.59 + 0.02 4.87 + 0.15 AE 87.04 + 0.04 86.83 + 0.23 7.95 + 0.12 7.94 + 0.15 PE 76.69 + 0.12 83.35 + 0.24 9.57 + 0.12 5.30 + 0.13 AVE 96.48 + 0.12 86.92 + 0.21 7.85 + 0.22 1.74 + 0.18 LE 85.04 + 0.05 84.49 + 0.22 7.92 + 0.05 2.04 + 0.14 VIE 95.28 + 0.02 91.77 + 0.32 9.30 + 0.04 2.99 + 0.48
EE 93.12 + 0.05 NA NA NA SHE 96.00 + 0.21 76.74 + 0.15 5.03 + 0.05 7.74 + 0.16
IE 88.24 + 0.13 76.48 + 0.65 3.39 + 0.13 9.56 + 0.14 HI 9.12 + 0.11 8.08 + 0.01 0.65 + 0.10 0.31 + 0.12
SE: Soa Extract, VE: Vacha Extract, CE: Chitrak Extract, AE: Ajmoda Extract, PE: Pudina Extract, AVE: Ativish Extract, LE: Latakaranj Extract,
VIE: Vidang Extract, EE: Elaichi Extract, SHE: Shati Extract, IE: Indrayav Extract, HI: Hingu Powder; WSE: Water Soluble Extractive; ASE: Alcohol Soluble Extractive; TA: Total Ash; AIA: Acid Insoluble Ash; NA: Not Applicable
Salmonella enterica ser. Abony spp. The results are furnished in Table 6.
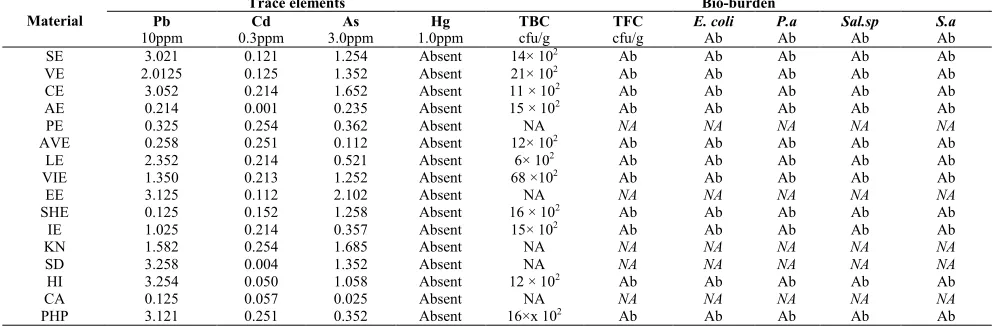
Heavy Metal Analysis [7]: Sample preparation for heavy metal analysis was done by MARS Express microwave digestive system. The standard solutions for detection of Lead (Pb), Cadmium (Cd), Arsenic (As) and Mercury (Hg) were prepared. Samples were then analyzed using Atomic Absorbance Spectrophotometer AA 6300, SHIMADZU and HVG-1 by preparing a calibration curve of standard. The results are as given in Table 6.
HPTLC Fingerprinting of Raw Materials and Finished Product: HPTLC is one of the most advanced separation
technique available today which gives better precision and accuracy with extreme flexibility for various steps (stationary phase, mobile phase, development technique and detection). HPTLC analysis was carried out using a Hemilton 100μl
HPTLC syringe, Camag Linomat V automatic spotting device, Camag twin trough chamber, Camag TLC Scanner-4, WINCAT integration software, aluminium sheet precoated with Silica Gel 0F254 (Merck) 0.2mm thickness.
Table 4: Analysis of the Active Compounds
Alkaloid Bitter Tannin Saponin Citric Acid
SE 0.38 +0.12 2.79 +0.14 0.01 +0.12 41.65 + 0.21 NA
VE 0.14 +0.02 2.18 +0.21 0.01 +0.14 42.21 + 0.12 NA
CE 0.29 +0.03 4.61 +0.01 0.04 + 0.21 44.63 + 0.05 NA
AE 0.65 +0.01 5.97 +0.12 0.06 +0.32 20.14 + 0.21 NA
PE 0.44 +0.05 1.99 +0.45 0.01 +0.24 14.18 + 0.03 NA
AVE 0.04 +0.13 10.63 +0.35 0.04 +0.02 20.09 + 0.45 NA
LE 0.74 +0.14 4.25 +0.12 0.05 +0.02 66.05 + 0.12 NA
VIE 0.88 +0.11 3.31 +0.11 0.07 +0.01 34.35 + 0.25 NA
SHE 0.11 + 0.21 2.05 +0.14 0.07 + 0.32 46.51 + 0.21 NA
IE 0.79 +0.23 3.24 +0.32 0.08 +0.21 25.78 + 0.32 NA
CA NA NA NA NA 99.98 +0.11
SE: Soa Extract, VE: Vacha Extract, CE: Chitrak Extract, AE: Ajmoda Extract, PE: Pudina Extract, AVE: Ativish Extract, LE: Latakaranj Extract,
VIE: Vidang Extract, SHE: Shati Extract, IE: Indrayav Extract, CA: Citrus acida Fruit Juice; NA: Not Applicable
Chromatographic Conditions:
Application Mode CAMAG Linomat 5 – Applicator Filtering System Whatman filter paper No.41 Stationary Phase MERCK - TLC / HPTLC Silica gel 60 F
254on Aluminum sheets Application (Y axis)
Start Position 10mm
Development (Y axis)
End Position 90mm from plate base
Band length 8 mm
Chamber Saturation
Time 30 minutes
Visualization
@254nm, @366nm, @ Visible (after spray of Anisaldehyde
Sulphuric acid reagent) Derivatization mode CAMAG – Dip tank for about 1 minute Drying Mode, Temp.
& time TLC Plate Heater Preheated at 100 ± 5°C for 3 minutes
Steps involved in HPTLC analysis
Selection of plate and adsorbent: Precoated aluminum plates with Silica Gel F254 of 20 × 20 cm and 0.2 mm thickness, was used for the detection. The plates were pre washed by methanol and activated at 60°C for 5 min prior to chromatography.
Sample solution
Extract: Extract 1.0g of the sample Extract (Reference Standard / Test Drug / with 10mL of Methanol with constant shaking for 05 minutes. Heat on water bath at 90-100°C for 5 minutes, Filter it through Whatman filter paper No.41. Use the filtrate for HPTLC Profiling.
Preparation of Spray reagent (Anisaldehyde sulphuric acid reagent): 0.5mL of Anisaldehyde EP is mixed with 10mL of Glacial acetic acid AR, followed by 85mL Methanol AR and 5mL Sulphuric acid 98% GR.
Track 1: 8µl/mL methanol extract of the reference standard of the Extract
Track 2: 8µl/mL methanol extract of test drug under observation
Track 3: 8µl/mL methanol extract of Poly Herbal formulation.
Table 5: Analysis of the Finished Product (Caspa Drops) Parameter Results
Batch 1 Batch 2 Batch 3
Description Dark Green coloured syrup with characteristic odour & characteristic sweet taste Dark Green coloured syrup with characteristic odour & characteristic sweet taste Dark Green coloured syrup with characteristic odour & characteristic sweet taste
pH 5.46 5.48 5.78
Specific
gravity 1.220 g/mL 1.152 g/mL 1.256 g/mL Viscosity 19.72 Centipoise 21.00 Centipoise 21.42 Centipoise
RESULTS HPTLC
In HPTLC analysis, the sample shows comparison of individual extract & Powder with finished product. The visualization of TLC plates was carried out in all 3 different wavelengths i.e, 254nm, 366nm and 540 nm. From this only the best visualization result was selected and included in our study along with its 3D image. The Rf value thus found during this study indicates the prominent presences of raw material in the finished product which is used to establish its quantitative presence.
Table 6: Results of Heavy metal content and Bio-burden in raw material of Caspa Drops
Material
Trace elements Bio-burden
Pb
10ppm 0.3ppmCd 3.0ppmAs 1.0ppmHg TBCcfu/g TFCcfu/g E. coliAb P.aAb Sal.spAb S.aAb SE 3.021 0.121 1.254 Absent 14× 102 Ab Ab Ab Ab Ab
VE 2.0125 0.125 1.352 Absent 21× 102 Ab Ab Ab Ab Ab
CE 3.052 0.214 1.652 Absent 11 × 102 Ab Ab Ab Ab Ab
AE 0.214 0.001 0.235 Absent 15 × 102 Ab Ab Ab Ab Ab
PE 0.325 0.254 0.362 Absent NA NA NA NA NA NA
AVE 0.258 0.251 0.112 Absent 12× 102 Ab Ab Ab Ab Ab
LE 2.352 0.214 0.521 Absent 6× 10² Ab Ab Ab Ab Ab
VIE 1.350 0.213 1.252 Absent 68 ×102 Ab Ab Ab Ab Ab
EE 3.125 0.112 2.102 Absent NA NA NA NA NA NA
SHE 0.125 0.152 1.258 Absent 16 × 102 Ab Ab Ab Ab Ab
IE 1.025 0.214 0.357 Absent 15× 102 Ab Ab Ab Ab Ab
KN 1.582 0.254 1.685 Absent NA NA NA NA NA NA
SD 3.258 0.004 1.352 Absent NA NA NA NA NA NA
HI 3.254 0.050 1.058 Absent 12 × 102 Ab Ab Ab Ab Ab
CA 0.125 0.057 0.025 Absent NA NA NA NA NA NA
PHP 3.121 0.251 0.352 Absent 16×x 102 Ab Ab Ab Ab Ab
SE: Soa Extract, VE: Vacha Extract, CE: Chitrak Extract, AE: Ajmoda Extract, PE: Pudina Extract, AVE: Ativish Extract, LE: Latakaranj Extract, VIE: Vidang Extract, EE: Elaichi Extract, SHE: Shati Extract, IE: Indrayav Extract, KN: Kala namak, SD: Saindhav HI: Hingu Powder and CA: Citrus acida Powder; ppm: Parts per million, cfu/mL- colony forming unit per mL, Pb: Lead, Cd: Cadmium, As: Arsenic, Hg: Mercury, TBC: Total bacterial count, TFC: Total fungal count, E. coil: Escherichia coli, P.a.: Pseudomonas aeruginosa, Sal.sp: Salmonella spp., S.a: Staphylococcus aureus, Ab: Absent; PHP: Poly Herbal Formulation;NA: Not Applicable
DISCUSSION
Standardization of bio-active is the process of delivering a product with a specified level of one or more phyto-constituents where we can make sure about related product quality and efficacy; broadly it covers the qualitative and quantitative part of analysis. Qualitative analysis mainly covers the identification of the constituent(s) present in a particular product, whereas the quantitative analysis is accomplished by measuring the level of a chemical in a crude herbal extract which are, present in that particular product and establishing a standard amount of that chemical for future production. The concept of standardized extracts
definitely provides a solid platform for scientific validation of herbals.
The testing of a finished product in compliance with predetermined standard prior to release of the product for packaging and subsequent distribution is a critical factor for quality assurance.
Anethum sowa(Soa) Fruit Extract (SE)
Fig. 1: It shows the HPTLC Chromatogram of SE. A: HPTLC Plate of SE at 366nm under UV. B: 2D Chromatogram of methanol extract of SE at 366nm; C: 2D Chromatogram of methanol extract of finish product at 366nm; D: 3D image of the Fingerprinting of SE and finished product (366nm). The results indicate that HPTLC Chromatogram of SE and finished product has shown the similar Rf value of 0.22 at 366nm
Acorus calamus(Vacha) Rhizome Extract (VE)
Fig. 2: It shows the HPTLC Chromatogram of VE. A: HPTLC Plate of VE at 366nm under UV. B: 2D Chromatogram of methanol extract of VE at 366nm; C: 2D Chromatogram of methanol extract of finish product at 366nm; D: 3D image of the Fingerprinting of VE and finished product (366nm). The results indicate that HPTLC Chromatogram of VE and finished product has shown the similar Rf value of 0.08, 0.41at 366nm
Plumbago zeylanica(Chitrak) Root Extract (CE)
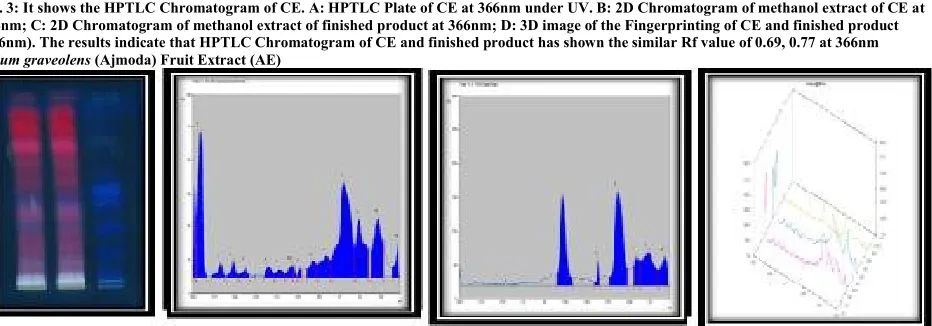
Fig. 3: It shows the HPTLC Chromatogram of CE. A: HPTLC Plate of CE at 366nm under UV. B: 2D Chromatogram of methanol extract of CE at 366nm; C: 2D Chromatogram of methanol extract of finished product at 366nm; D: 3D image of the Fingerprinting of CE and finished product (366nm). The results indicate that HPTLC Chromatogram of CE and finished product has shown the similar Rf value of 0.69, 0.77 at 366nm
Apium graveolens(Ajmoda) Fruit Extract (AE)
Mentha sylvestris(Pudina) Leaves (PE)
Fig. 5: It shows the HPTLC Chromatogram of PE. A: HPTLC Plate of PE at 366nm under UV. B: 2D Chromatogram of methanol extract of PE at 366nm; C: 2D Chromatogram of methanol extract of finished product at 366nm; D: 3D image of the Fingerprinting of PE and finished product (366nm). The results indicate that HPTLC Chromatogram of PE and finished product has shown the similar Rf value of 0.21, 030 at 366nm
Aconitum heterophyllum(Ativisha) Root Tuber Extract (AVE)
Fig. 6: It shows the HPTLC Chromatogram of AVE. A: HPTLC Plate of AVE at 254nm under UV. B: 2D Chromatogram of methanol extract of AVE at 254nm; C: 2D Chromatogram of methanol extract of finished product at 254nm; D: 3D image of the Fingerprinting of AVE and finished product (254nm). The results indicate that HPTLC Chromatogram of AVE and finished product has shown the similar Rf value of 0.57 at 254nm
Caesalpinia crista(Latakaranj) Seed Extract (LE)
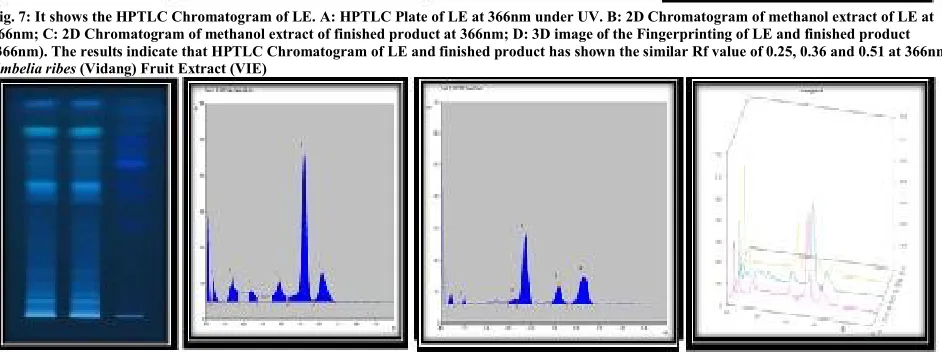
Fig. 7: It shows the HPTLC Chromatogram of LE. A: HPTLC Plate of LE at 366nm under UV. B: 2D Chromatogram of methanol extract of LE at 366nm; C: 2D Chromatogram of methanol extract of finished product at 366nm; D: 3D image of the Fingerprinting of LE and finished product (366nm). The results indicate that HPTLC Chromatogram of LE and finished product has shown the similar Rf value of 0.25, 0.36 and 0.51 at 366nm
Embelia ribes(Vidang) Fruit Extract (VIE)
Elettaria cardamomum(Elaichi) Fruit Extract (EE)
Fig. 9: It shows the HPTLC Chromatogram of EE. A: HPTLC Plate of EE at 366nm under UV. B: 2D Chromatogram of methanol extract of EE at 366nm; C: 2D Chromatogram of methanol extract of finished product at 366nm; D: 3D image of the Fingerprinting of EE and finished product (366nm). The results indicate that HPTLC Chromatogram of EE and finished product has shown the similar Rf value of 0.21, 0.38 at 366nm
Hedychium spicatum(Shati) Rhizome Extract (SHE)
Fig. 10: It shows the HPTLC Chromatogram of SHE. A: HPTLC Plate of SHE at 366nm under UV. B: 2D Chromatogram of methanol extract of SHE at 366nm; C: 2D Chromatogram of methanol extract of finished product at 366nm; D: 3D image of the Fingerprinting of SHE and finished product (366nm). The results indicate that HPTLC Chromatogram of SHE and finished product has shown the similar Rf value of 0.39, 0.65 at 366nm
Holarrhena antidysenterica(Indrayav) Seed Extract (IE)
Fig. 11: It shows the HPTLC Chromatogram of IE. A: HPTLC Plate of IE at 366nm under UV. B: 2D Chromatogram of methanol extract of IE at 366nm; C: 2D Chromatogram of methanol extract of finished product at 366nm; D: 3D image of the Fingerprinting of IE and finished product (366nm). The results indicate that HPTLC Chromatogram of IE and finished product has shown the similar Rf value of 0.57, 0.73 at 366nm
Ferula foetida(Hingu) Powder (HI)
The testing method for each parameter has been standardized and validated. The protocols for the same have been adopted from standard reference books.
Sensory characters like physical appearance, colour odour and taste of the raw materials and Finish product were first evaluated for identification and purity before any further tests are undertaken.
pH and moisture content were found in the stipulated limit as they play important role in reflecting quality of product. Variation in them can encourage microbial growth and can cause deterioration followed by hydrolysis.
Extractive Value determines the amount of active constituents in a given amount of medicinal plant material when extracted with a solvent media such as Water and Alcohol. These values provide an indication of the extent of polar, medium polar and non-polar compounds present in the plant material. Thus from the above study we can conclude that all our extracts have good solubility in water which is a polar solvent.
The total ash usually consists of carbonates, phosphates silicates and silica that include the physiological ash which is derived from the plant tissue itself and non physiological ash which is the residue of the adhering material to the plant material e.g. sand and soil. Total ash was performed to measure the total amount of material remaining after ignition. This test is important to control adulteration. Acid insoluble ash is the residue obtained after boiling the total ash with dilute hydrochloric acid, and igniting the washed insoluble matter.
Thus our results show that the ash values were much within the prescribed limits.
WHO has specified the limits for the presence of contaminants like four pathogenic micro-organisms viz E. coli, Staphylococcus aureus, P. aeruginosa & Salmonella enterica ser. Abony spp along with yeast-moulds and four heavy metals viz; Lead, Cadmium, Arsenic & Mercury as the
consumption of which can lead to complications in one’s routine life. Caspa Drops was found in full compliance of the permissible microbial and heavy metal limits.
HPTLC study confirmed the qualitative as well as quantitative presence of the raw material in the finished product.
Present standardization study reveals compliance with all the above discussed parameters and hence it can be concluded that Caspa Drops is a well standardized product at essential physico-chemical parameters.
ACKNOWLEDGEMENT
The authors would like to express their gratitude to Vasu Research Centre, A Division of Vasu Healthcare Pvt. Ltd, Vadodara, India, for providing state of the art testing facility and financial support to carry out this research work and also KSKV Kachchh University for the support extended during the research work.
REFERENCES
1. Jablonski D. Extinction: past and present. Nature 2004; 427: 589. 2. Late Ayurved Shastri Shankar Daji pade, Aryabhishak, , Sastu
sahitya vardhak karyalay, 2006.
3. The Ayurvedic Pharmacopoeia of India, Govt. of India, Ministry of Health and Family Welfare, Department of Indian Systems of Medicine and Homeopathy, New Delhi, Published by The Controller of Publications, Civil Lines, Delhi, 1989, 1(1), pp. 143,156.
4. Rajpal V. Standardization of botanicals, testing extraction methods of medicinal herbs. Vol. 2 Eastern Publishers, 2005.
5. Method as adopted from book Indian Pharmacopoeia 2007 Vol II, Indian Pharmacopeia Commission, Ghaziabad; India, pp. 942. 6. Method as adopted from book; Indian Pharmacopoeia 2010; Vol I,
Indian Pharmacopeia Commission, Ghaziabad; India, 2010, pp. 37-48.