Abstract:- The research concentrates on a computer based push-over analysis technique for performance-based design of steel building frame works subjected to earthquake loading. Through the use of a plasticity-factor that measures the degree of plasticisation, the standard elastic and geometric stiffness matrices for frame elements (beams, columns, etc.) are progressively modified to account for nonlinear elastic–plastic behaviour under constant gravity loads and incrementally increasing lateral loads. The analysis is performed for two steel frameworks of solid and hollow members. This investigation aims to analyse the difference in structural behaviour between hollow and solid frames. The technique adopted in this research is based on the conventional displacement method of elastic analysis.
Keywords:- Seismic Performance, Pushover, Non-linear, performance levels, Steel frame, Capacity Curves.
I.
INTRODUCTION
Pushover analysis is a static, nonlinear procedure in which the magnitude of the structural loading is incrementally increased in accordance with a certain predefined pattern. With the increase in the magnitude of the loading, weak links and failure modes of the structure are found. The loading is monotonic with the effects of the cyclic behaviour and load reversals being estimated by using a modified monotonic force-deformation criteria and with damping approximations. Static pushover analysis is an attempt by the structural engineering profession to evaluate the real strength of the structure and it promises to be a useful and effective tool for performance based design.
II.
PUSHOVER ANALYSIS
Pushover analysis is a performance based analysis. According to ATC 40, there are two key elements of a performance-based design procedure - demand and capacity. Demand is the representation of earthquake ground motion or shaking that the building is subjected to. In nonlinear static analysis procedures, demand is represented by an estimation of the displacements or deformations that the structure is expected to undergo. Capacity is a representation of the structure’s ability to resist the seismic demand. The performanceis dependent on the manner that the capacity is able to handle the demand. In other words, the structure must have the capacity to resist demands of the earthquake such that the performance of the structure is compatible with the objectives of the design.
Pushover analysis is an approximate analysis method in which the structure is subjected to monotonically increasing lateral forces with an invariant height-wise distribution until a target displacement is reached. Pushover analysis consists of a series of sequential elastic analysis, superimposed to approximate a force-displacement curve of the overall structure.
Figure: 1. Design capacity curve
Objectives of this study:
1. To study the structural performance of solid and hollow steel frames when subjected to seismic loads.
Scope of the study:
1. Determination of performance level of solid and hollow frames
2. To predict peak response of building and components for a given seismic loads. Modelling:
The STAAD Pro V8i software is utilized to create 2D model and carry out the Pushover analysis. The buildings are modelled as a series of stories from 5 to 40 with same bay width and storey height. The study is performed for applied lateral load to find base shear and the displacement. The buildings adopted consist of reinforced concrete. The frames are assumed to be firmly fixed at the bottom and the soil–structure interaction is neglected.
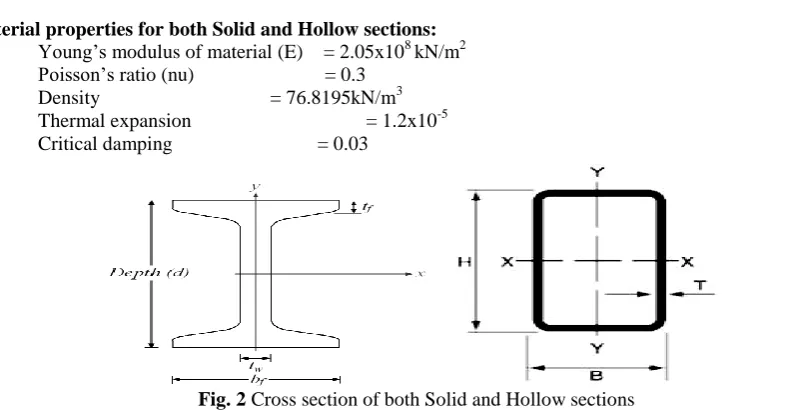
Inputs: Model Geometry for both Solid and Hollow sections:
Table 1: Input parameters
Number of stories Type of frame Bay width Height of each storey
5 2D-Frame 6m 3m
10 2D-Frame 6m 3m
15 2D-Frame 6m 3m
20 2D-Frame 6m 3m
25 2D-Frame 6m 3m
30 2D-Frame 6m 3m
35 2D-Frame 6m 3m
40 2D-Frame 6m 3m
Material properties for both Solid and Hollow sections: Young’s modulus of material (E) = 2.05x10⁸ kN/m2 Poisson’s ratio (nu) = 0.3
Density = 76.8195kN/m3 Thermal expansion = 1.2x10⁻⁵ Critical damping = 0.03
Figure 3: Pushover analysis methodology
III.
RESULTS AND DISCUSSION
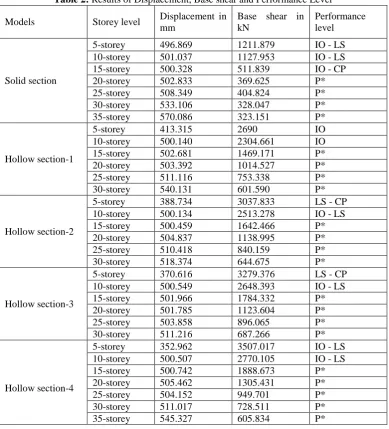
Level : <=IO , Colour : Green Level : <=IO-LS , Colour : Blue Level : <=LS-CP , Colour : Magenta Level : <=CP , Colour : Red.
Table 2: Results of Displacement, Base shear and Performance Level
Models Storey level Displacement in mm
Base shear in kN
Performance level
Solid section
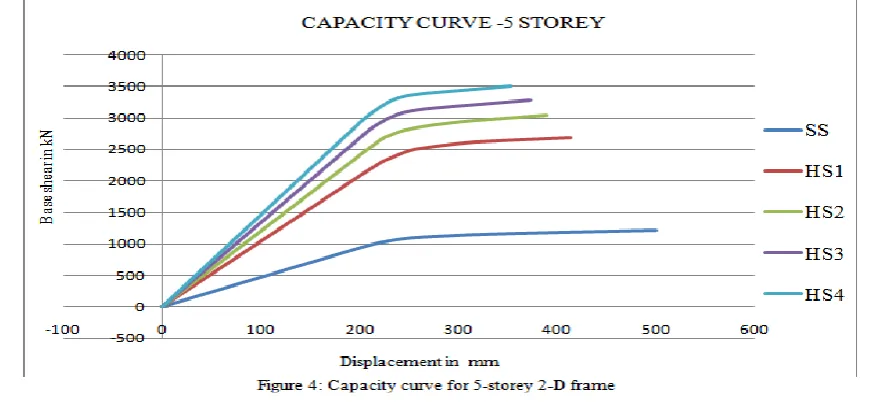
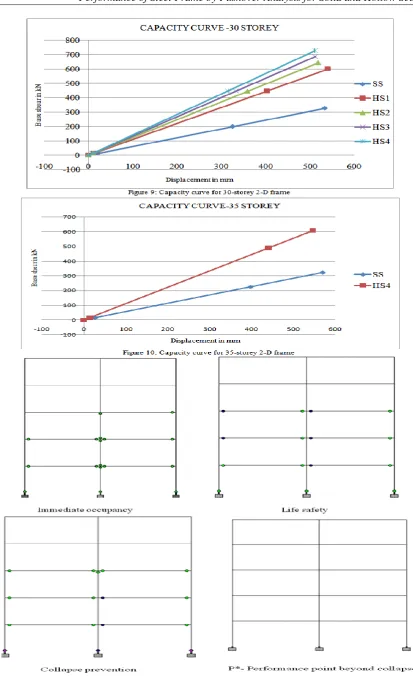
5-storey 496.869 1211.879 IO - LS 10-storey 501.037 1127.953 IO - LS 15-storey 500.328 511.839 IO - CP 20-storey 502.833 369.625 P* 25-storey 508.349 404.824 P* 30-storey 533.106 328.047 P* 35-storey 570.086 323.151 P*
Hollow section-1
5-storey 413.315 2690 IO 10-storey 500.140 2304.661 IO 15-storey 502.681 1469.171 P* 20-storey 503.392 1014.527 P* 25-storey 511.116 753.338 P* 30-storey 540.131 601.590 P*
Hollow section-2
5-storey 388.734 3037.833 LS - CP 10-storey 500.134 2513.278 IO - LS 15-storey 500.459 1642.466 P* 20-storey 504.837 1138.995 P* 25-storey 510.418 840.159 P* 30-storey 518.374 644.675 P*
Hollow section-3
5-storey 370.616 3279.376 LS - CP 10-storey 500.549 2648.393 IO - LS 15-storey 501.966 1784.332 P* 20-storey 501.785 1123.604 P* 25-storey 503.858 896.065 P* 30-storey 511.216 687.266 P*
Hollow section-4
5-storey 352.962 3507.017 IO - LS 10-storey 500.507 2770.105 IO - LS 15-storey 500.742 1888.673 P* 20-storey 505.462 1305.431 P* 25-storey 504.152 949.701 P* 30-storey 511.017 728.511 P* 35-storey 545.327 605.834 P*
Note: Performance levels are as follows, IO-Immediate Occupancy,
LS- Life Safety,
CP- Collapse Prevention, C-Collapse,
IV.
CONCLUSIONS
In this study, 2-D frames are modelled for both solid and hollow sections for various stories with constant bay width and storey height which was analysed by pushover analysis using STAAD.Pro.
From this study, when the number of storey decrease corresponding base shear increases and also number of storeys increases corresponding displacement increases.
It is found that the drift to height ratio is limited to 35 stories despite of increased base width.
The performances of all the solid and hollow section 2-D models are lies in between life safety and collapse prevention. Formations of plastic hinges were maximum when the storey levels are minimum.
Comparing the results of solid and hollow sections base shear vs. displacement curve indicates that the hollow section is far better than solid sections.
Effect of lateral displacement for 5-storey 2-D frame with hollow section provides 16.73% reduction when compared with the solid sections.
Base shear values for 5-storey 2-D frame with hollow section when compared with solid section which is increased up to 54 %.
When storey level get increased pushover load steps get decreased, so the capacity curve become linear for some models corresponding to its storey level.
Self weight of both solid and hollow section clearly reveals that the hollow section is having maximum dead weight than solid sections. Comparatively 60% of self weight values get increased in hollow section than the solid section.
The seismic performance evaluation of a steel building frame is carried out by using pushover analysis accounted for user defined inelastic material behaviour and assigning inelastic effects to plastic hinges at member ends.
Symbols
E = Young’s modulus of materials α = Co-efficient of thermal expansion µ = Poisson’s ratio
λ = Mode shape
u = Displacements
I = Moment of inertia of section kN = Kilo Newton
mm = Millimetres V = Base shear A = Area of building
SRSS = Square roots of sum of squares CSM = Capacity spectrum method
PO = Pushover
FEMA = Federal emergency and management agency C = Critical damping
T = Time period SS = Short period B = Base dimensions SS = Solid Section HS1 = Hollow Section-1 HS2 = Hollow Section-2 HS3 = Hollow Section-3 HS4 = Hollow Section-4
REFERENCES
[1]. R. Hasan, L. Xu, D.E. Grierson, (July 2002) “Push-over analysis for performance-based seismic design” Computers and Structures 80, P. 2483–2493.
[2]. D.K. Baros , S.A. Anagnostopoulos, (Oct 2008) “An overview of pushover procedure for the analysis of building susceptible to torsional behaviour”. The 14thWorld Conference on Earthquake Engineering October 12-17, Beijing, China.
[3]. Cinitha A, Umesha P.K, Nagesh R . Iyer “Evaluation of seismic performance of an existing steel building- pushover analysis approach”
[4]. T. Hasegawa ,and H. Kamura, (Oct 2008) “Seismic response prediction of steel frames utilizingplastic strain energy obtained from pushover analysis”. The 14th World Conference on Earthquake Engineering October 12-17, Beijing, China
[5]. Anil K. Chopra, and Rakesh K. Goel,(2004) “A modal pushover analysis procedure to estimate seismic demands for unsymmetric-plan buildings” Earthquake engineering and structural dynamics, Vol 33, pp. 903–927
[6]. Bülent AKBAŞ, Jay SHEN, F. İlknur KARA, Ülgen Mert Tuğsal,(may 2003) “Seismic behavior and pushover analyses in steel frames çelik çerçevelerin deprem performanslari ve öteleme analizleri” Fifth National Conference on Earthquake Engineering, 26-30 May 2003, Istanbul, Turkey Paper No: AT-053
[7]. Helmut krawinkler, and G.D.P.K.Seneviratna,(1988) “Pros and cons of a pushover analysis of seismic performance evaluation”Engineering Structures, Vol. 20, pp. 452-464