A Decision Chart for Applying Integrated
Technologies Throughout Urban Design Projects
Stages
Sherif M. El-Wageeh
Department of Architectural Engineering, College of Architectural Engineering and Design, the Kingdom University, Bahrain
Abstract - Recent years have witnessed a rapid development in the technologies that are related to digital visualization and simulation together with the technologies that try to link between digital and physical modelling. Many engineering and design practitioners have begun to apply selective technologies in their practices. The research attempts to classify the possible technologies that can be used throughout stages of urban design projects according to their purpose. An overview of different applications of such technologies in urban design is conducted. A decision-making chart for engaging technology in different stages of urban design projects is developed.
Index Term-- Collaborative work, Data Acquisition, Simulation,
Urban Design
I. INTRODUCTION
A. Context and Background
Recent years have witnessed a rapid development in the technologies that are related to digital visualization and simulation together with the technologies that try to link between digital and physical modelling.
A large number of companies compete in developing visualization and simulation software as well as CAD software. Other companies develop advanced hardware with a wide range of functions such as: 3D Scanning, 3D Printing, Immersive Visualization and Tangible Interaction.
In fact, such technologies are interrelated and connected to each other. An output of a certain technology can be used as an input in another technology.
Many engineering and design practitioners have begun to apply selective technologies in their practices. However, such technologies are still not widely recognized and applied as supportive teaching tools in education.
This paper tries to propose a theoretical framework for engaging integrated technologies in urban design field.
B. Motivation and Importance
The idea of this research is stimulated from a previous research by the author about the future of teaching architectural design through the use of Tangible Interaction Technology (A technology that link between capabilities of physical and digital modelling). The practical and collaborative nature of urban design field is another stimulus.
The importance of this research comes from the approach used to investigate the different possible technologies that can be applied in each stage of urban design process.
The research aims at:
Classifying the technologies used in the urban design field according to different stages of urban design projects.
Designing a decision chart for using such technologies and their applications in urban design projects.
D. Research Structure
The research is structured on six sections. The first section covers the context, background, importance and objectives of the research. The second section sheds the light on the nature of urban design and stages of urban design projects. The third section of the study tries to categorize technologies that can potentially be used in each stage of urban design projects. The fourth section of the research discusses the various applications of each technology. In the fifth section, a decision chart for engaging technological applications in different stages and urban design projects is developed. The sixth section discusses the findings and limitations of the research and suggests recommendation for further research.
II. URBAN DESIGN (NATURE-OUTPUT)
There are a wide range of definitions for urban design from many points of views. Urban design is a field that is connected to urban development which is one of the physical outputs of comprehensive development in any country.
Urban Design is an intermediate discipline between architecture and urban planning; it can be defined as the trial of generating urban environments that best fits community culture and features. Urban Design is also defined as: The art of contextual design [9].
Finally, a detailed and more technical definition of Urban Design is: The design of the spatial structure of t he city and its urban tissue that connects buildings and functions in a way reflecting its cultural identity and response to the environment [18].
The previous fact of scale and multiple dimensions of urban design lead to the necessity of collaborative work in urban design projects. Urban design team consists of architects, civil engineers, landscape designers, economists ... etc.
Any urban design project should pass through the following rational stages [18]:
1. Problem Definition: Preliminary Definition of the main problems existing in the study area. Problems may be related to physical environment or natural environment or socio-cultural characteristics of users.
2. Objectives Formulation: According to the defined problems, a set of objectives for the project is agreed on. 3. Urban Survey/Documentation: A series of site visits
should be arranged in order to document the current status of the area. Documentation includes physical structure of the built environment (buildings and spaces), natural component of the site (green areas and water areas) and demographic survey (various characteristics of users). 4. Urban Analysis: All gathered information are then
analyzed in order to know the constraints and possibilities of the study area together with its points of Strength, Weakness, Opportunities and Threats (SWOT analysis). Other techniques of urban analysis (such as Trend analysis) may be used to predict future possibilities of the site based on previous measures [18].
5. Urban Design Alternatives Generation: After analysing the study area information, the project team tries to sit together and generate logical design alternatives for the study area. These alternatives should solve the problems and challenges found in the area. They should also reinforce strength points, solve weakness points, make good use/advantage of opportunities and eliminate threat points. The level of details of such alternatives is limited to the conceptual level.
6. Alternatives Evaluation: To evaluate the design alternatives, a group of evaluation indicators is agreed on. Then, the design alternatives are marked according to those indicators. The output of this stage is choosing the optimum design alternative.
7. Optimum Urban Design Alternative: The optimum design alternative is detailed in order to be ready for implementation. A set of 2D plans, elevations, sections and details drawings is prepared together with 3D models. 8. Implementation and Monitoring: The project is
implemented according to a scheduled time frame and within an allocated budget. Monitoring implementation is a very important task that assists in making sure that the achievements match the plan.
III. TECHNOLOGY AND URBAN DESIGN
This section of the study tries to categorize different technologies that can be used in the previously mentioned urban design stages according to the required tasks in each stage. Examples of each technology are shown in order to design an approach for engaging integrated technology in urban design projects.
In the (Problem Definition) stage, the technology contribution is limited to Database and Information Systems. This can't be a substitute of visiting the site for grasping initial observations (site reconnaissance). The (Objectives Formulation) stage depend more on collaborative thinking according to the previous stage. In the third stage (Urban Documentation/Survey), a wide range of Data Acquisition technologies can be used to grasp/acquire the maximum amount of objective and subjective information from the site. The technology applications in the (urban Analysis) stage are limited to Logical Analysis technology. In the (Urban Design Alternatives Generation) stage, the technology applications can be divided into two groups: The first group is the technology that can help in Generating/Modelling the alternatives whereas the second group is the technology that can help in Visual Representation of such alternatives. Advanced Physical Modelling, 3D Visualization and Simulation Technology can form a powerful supportive tool in the (Alternatives Evaluation) stage through applying some tests and evaluations on models that simulate different alternatives.
All the technologies used in the previous two stages (5th and 6th) can be applied in the (Optimum Urban Design Alternative) stage. Finally, the technology applied in the (Implementation and Monitoring) stage will be based on Construction and Laboratory based testing technology.
To summarize, it is clear that technology applications in urban design include: Database and Information technology, Data Acquisition Technology, Logical Analysis technology, Modelling and Visual Representation technology, Simulation technology, Construction technology and Laboratory based testing technology.
IV. OVERVIEW OF POTENTIAL TECHNOLOGIES This section of the study goes through an in-depth overview of the technologies that was deduced in the previous section. The technologies related to the last stage (Implementation and Monitoring) will be excluded as the main concern of the research is the technology that can be used in pre-implementing stages of urban design projects.
1. Database and Information Technology:
Geographic Information Systems (GIS) can be a powerful source of information that supports decision making in urban planning and design such as: land use, building condition, building height, infrastructure network ...etc. Reference [17] stresses that earth observation and geo-information help professionals and specialists in the process of decision-making. The development of Remote Sensing and Geo-information shifts the maps from their traditional 2D static form to a source of spatial information.
2. Data Acquisition Technology:
urban spaces and patterns of users' activities, to aerial photography, 3D scanning and point cloud technology through which a laser based photography of buildings is transferred directly to a digital 3D model. Point cloud technology accelerates the 3D digital modelling of buildings' current status. This by its turn can accelerate the preceding design stages.
Aerial photographs are advanced examples of the applications of photographing in urban design (see fig. 1). Vertical aerial photo is taken with the camera axis vertically downward from the aircraft or with a deviance of no more than 5 degrees from the vertical line. If the deviance is more than 5 degrees, the picture will be an oblique aerial photograph [16].
Fig. 1. Aerial Photography
Source: http://highvizphotography.co.uk/termsandconditions.html
According to reference [16], Aerial photos have many valuable advantages:
The aerial photo contains a large amount of information that is uniform for all areas where identical technical efforts have been made.
The information in the pictures can be used in degrees as needed, and supplements can be made afterward from the pictures.
For areas that have not been photographed, the information is easily obtainable, although at considerably increased expense.
Aerial photos are easy to handle and file.
Laser scan is another technology that transform physical model that architects understand to digital models that computer software understand. The "City Scanner" is an example of advanced systems in the field of laser scanning; it provides an efficient tool for acquisition of terrestrial source data for urban modelling, for the post-analysis of the recordings and for the creation, management, manipulation and visualization of urban models with a large coverage area [5]. (See fig. 2)
The “City Scanner” is a measuring vehicle for wide area coverage, complete and fast data acquisition of the urban space. Due to its largely automated operation, the fully calibrated multi-sensors and automated image post-processing,
the efforts for data acquisition and generation of a reality-conforming digital urban model are minimized. The “City Scanner” allows wide area coverage, geometrical and pictorial documentation of entire cities [5].
3. Logical Analysis Technology:
This technology comes in a form of statistical analysis software such as: Microsoft Excel™ and Statistical Package for Social Studies (SPSS™). Some advanced Logical analysis software can be used in Trend Analysis studies [18]. Predicting the birth or death rates or the cars ownership after 20 years in the study area is an example of Trend Analysis studies. The idea of such type of analysis is to use curve fitting and interpolation as a tool to construct a relationship or an equation between time and any variable. The equation can be used to predict future values of such variable.
Fig. 2. 3D Laser Scanning Technology
Source:www.halcrow.com/Areas-of-expertise/Geospatial-solutions/Intelligent-building-models/
4. Modelling and Visual Representation Technology:
Originally the word ''Modelling'' is widely used in arts field as it means the process of constructing a 3D representation of an object. Clay modelling is an obvious example. In this case, the word ''physical'' can be added to represent this type of modelling (Physical Modelling); However in the current research field, our main concern is for (Digital Modelling). According to reference [7], Digital Modelling is the ''mathematical construction and computer implementation of an object, by defining points in a 3 dimensional array''. Famous Computer Aided Drafting software such as: Auto CAD™, 3D Max™, Revit™ and Archi CAD™ are examples of modelling software. As mentioned before, Point Cloud technology is an example of Data Acquisition technologies. However, it can be classified under the Modelling technology category as it produces a structural 3D array of points [7].
newer designers are accustomed to working with on-screen digital representations, they may be losing valuable physical form manipulation skills”. Over the past decade, researchers in areas such as Tangible and Ubiquitous Computing have begun to develop interaction techniques that can bridge the gap between physical and digital worlds [15].
In the process of developing a product, relying on physical models has many disadvantages [13]. These disadvantages are:
the difficulty of changing intrinsic properties (shape, color, state),
the high manufacturing and changing costs, the high cost of embedding dynamic mechanisms, the costs rise with the size of the object,
the limited lifetime of the model, and
the high storage, transportation and maintenance costs. Digital models on the other hand overcome the previous disadvantages. CAD model is required for photo-realistic rendering to test real material appearance. It also has the advantage of backup. Physical models do not support the undo process [20]. Rapid transfer of the initial physical models to digital CAD models (through laser scanning technology) can help benefiting from the advantages of both through accelerating the design development process.
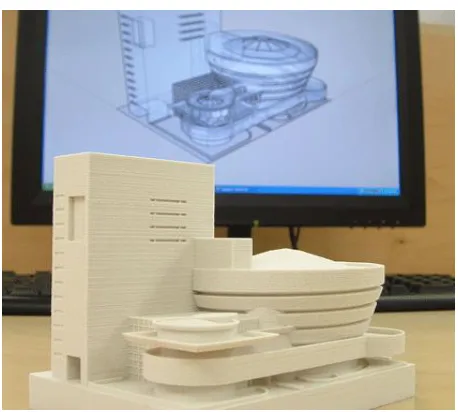
Digital models can be transformed to tangible physical models through the 3D Printing technology. According to reference [8], ''3D printers build objects layer by layer using polymers and other materials. The process can take minutes or hours, depending on the complexity of the item. Designers and manufacturers are already turning to these devices to produce rapid prototypes, models, and specialty items''. (See fig. 3).
Fig. 3. A Physical Model of Guggenheim Museum Created by 3D printing Technology
Source: www.cadspan.com
Tangible Interaction Technology can be used as an interesting tool to bridge the gap between physical and digital
modelling. Such technology combines the advantages of both types of modelling. Another term is Tangible Manipulation, which is the “bodily interaction with physical objects” that “are coupled with computational resources to control computation” [11].
Reference [11] distinguishes between three views of Tangible Interaction. The first is the Data-centered view which is based on physical manipulation of digital data. The second is the Expressive-Movement centered view which is based on designing the interaction with physical objects. Finally, the third is the Space-centered view which is used in interactive art and architecture.
Reference [6] classifies the medium used for Tangible Interaction with digital or physical models into two categories: planar (i.e. based on touching digital models in highly sensitive surfaces), or spatial (i.e. based on tracking movements and gestures that may be used to manipulate and deform 3D digital objects in the space). Multi-Touch Tables, Projected Tables, and Smart Boards are examples of planar-based Tangible Interaction Technology [14] (See fig. 4) whereas Sensable™ [21] and SandScape™
[12]
devices are examples of spatial-based Tangible Interaction Technology. (See fig. 5)Fig. 4. Multi-Touch Tables
Source: www.vikora.de/loesungen/articles/multitouch-table/
5. Simulation Technology:
Reference [22] defines Simulation as ''the process of designing a model of a real or imagined system and conducting experiments with that model. The purpose of simulation experiments is to understand the behaviour of the system or evaluate strategies for the operation of the system''. Simulation Technology is applied widely in urban design fields. Environmental Simulation is an example in which physical or digital models of built environment are subjected to Tests that simulate environmental or climatic phenomenon such as: Wind Tunnel test and Earthquake Simulation test (See fig. 6).
Predicting what will happen if the study area is hit by 6.9 Richter earthquake is an example of Simulation Technology which is known as Scenario Design Simulation. Computer Aided Design software is used in digital Simulation to represent the effect of various phenomenon on the design both mathematically and visually.
Agent-Based Modelling Technology (ABM) is another advanced Simulation Technology (Multi-Agent Simulation is another synonym) in which a system is modelled as a collection of autonomous decision-making entities called agents. Each agent individually assesses its situation and makes decisions on the basis of a set of rules. Agents may execute various behaviours appropriate for the system they represent [3]. Evacuation and traffic flow are famous applications of such technology.
Fig. 6. Wind Tunnel Used for Testing Urban Models Source: www.ur-net.go.jp/rd/english/english.html
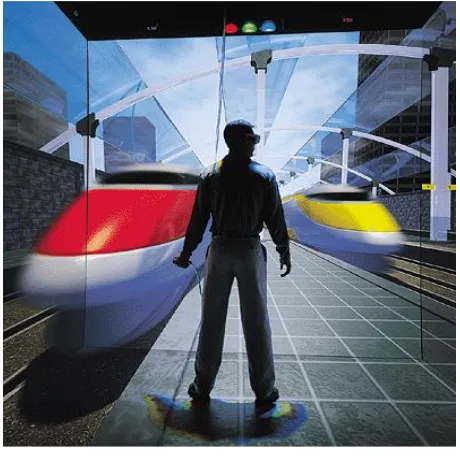
Virtual Reality Technology (VR) is another example of Simulation Technology. VR is used to build interactive 3D models called Virtual Environments (VEs). The main purpose of VR is to simulate walking through design projects. VEs are interactive 3D models based on real time technology. They differ from animated 3D models which rely on a sequence of pre-selected and pre-rendered images to create the illusion of movement through a pre-determined path. Input devices (such as the mouse and the keyboard) are used in VEsto control the direction and speed of movement together with the visual field
according to the navigator’s choice. For reference [23], VR systems are comprised of four elements. These elements are the computer hardware and software, the input and output devices, the data as well as the users. Virtual Worlds can be viewed using simple software as freeware or shareware or by using certain Internet browsers’ plug-ins. There is a wide range of software available through the Internet such as Cortona™ player and Cosmo™ player. The advanced tool to display immersive systems is CAVE which is a rectangular room. The walls, floor and ceiling of this room are subjected to synchronized projection system [10] (See fig. 7).
Previous research has pointed out an important potentiality in VEs which discriminates it from conventional 3D representations. This potentiality is the interaction between users and the VR model [1], [2].
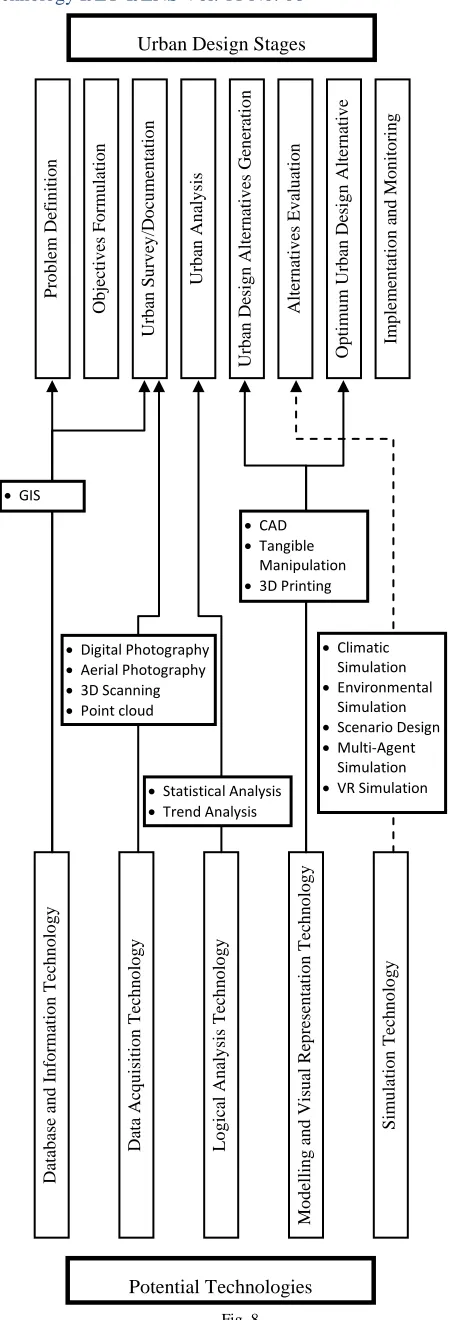
V. DECISION CHART FOR APPLYING TECHNOLOGY IN URBAN DESIGN
After pointing out the various examples of technologies that can be used in urban design projects, it is important to design a decision chart for urban designers and institutions working in urban design field. This decision chart can help them in choosing the right technology that is appropriate to their projects stages. The decision chart can be in a simple form of table or in a form of matrix or diagrammatic flowchart that contains: urban design projects stages, linked technologies and applications of such technologies. Figure 8 illustrates a diagrammatic representation of the suggested decision chart.
Fig. 7. Virtual Reality CAVE
Source: http://www.zdnet.com/topics/virtual+reality
VI. DISCUSSION AND CONCLUSION
available such as statistical analysis software while others are very complicated and expensive such as laser scanning. Using such technologies can help supporting decision making throughout the stages of urban design projects. It can also help accelerating the pre-implementing stages. It is obvious that applying such technologies in urban design education will dramatically affect the settings of urban design studios in academic institutions. The cost of equipping such studios with these technologies will be high, but it will have an outstanding long term benefit in the learning process.
A. Research Limitations
Although the research attempts to cover all possible technologies that can be used in urban design field, the applications of each technology are not fully covered. The research doesn't focus on the technical and ''know how'' issues related to technology applications. As mentioned before in the study, the research doesn't cover technology applications in the implementing and monitoring stage of urban design projects.
B. Directions for Further Research
Because of the research limitations, it is recommended to conduct further research that goes for longitudinal study in each technology and its applications. Studies on the potential relationship between inputs and outputs of technological applications in all stages of urban design can be conducted. The feasibility and cost-benefit analysis of applying such technologies in urban design education can be discussed.
Fig. 8.
Decision Chart for Applying Technology in Urban Design Potential Technologies Da tab ase a n d In fo rm ati o n Tec h n o lo g y Da ta Ac q u isit io n Tec h n o lo g y Lo g ica l An al y sis Tec h n o lo g y M o d ell in g a n d Visu al Re p re se n ta ti o n Tec h n o lo g y S imu latio n Tec h n o lo g y
Urban Design Stages
P ro b lem De fin iti o n Ob jec ti v es F o rm u latio n Urb an S u rv ey /D o cu m en tati o n Urb an An al y sis Urb an De sig n Altern ati v es Ge n er ati o n Altern ati v es E v al u ati o n Op ti m u m Urb an De sig n Alter n ati v e Im p lem en tatio n a n d M o n it o rin g GIS
Digital Photography
Aerial Photography
3D Scanning
Point cloud
Statistical Analysis
Trend Analysis
CAD
Tangible
Manipulation
3D Printing
Climatic
Simulation
Environmental
Simulation
Scenario Design
Multi-Agent
Simulation
REFERENCES
[1]. Bates-Brkljac, N., and Counsell, J. (2007), "Issues in the Use of Computer Visualisation of Large-Scale Urban Developments as Planning Support Tools". In M. Schrenk, V. V. Popovich, and J. Benedikt (Eds.), Proceedings of Real Corp 2007 Conference (May 20-23, 2007), pp. 59-67. Vienna.
[2]. Batty, M. and Smith, A. (2005), "Imagining the Recursive City: Explorations in Urban Simulacra", U.K.: Center for Advanced Spatial Analysis, University College London.
[3]. Bonabeau, E. (2002), " Agent-based modeling: Methods and techniques for simulating human systems", Retrieved October 20, 2011, from http://www.pnas.org/content/99/suppl.3/7280.full
[4]. Broadbent, G. (1990), “Emerging concepts in urban space design”, Van Nostrand Reinhold, New York
[5]. “City scanner”, Geo data, www.geodata.com
[6]. Elwageeh, S. M. (2009), “Teaching Architectural Design through Tangible Interaction Devices – Features and space planning of the 21st century design studio”, Proceedings of the 5th International
Conference, Architectural Engineering Dept., Faculty of Engineering, Cairo University, December, 2009Egypt
[7]. Fabio, R. (2003), "From Point Cloud to Surface: The Modeling and Visualization Problem", International Workshop of Visualization and Animation of Reality-Based 3D Models, 2003, Tarasp-Vulpera, Switzerland
[8]. Greengard, S. (2011), "3D Printing takes shape", Retrieved November 5, 2011 from, http://www.baselinemag.com/c/a/Innovation/3D-Printing-Takes-Shape-636713/
[9]. Gosling, D. (1984), “Definitions of Urban Design”, AD publications Ltd, Great Britain
[10]. Hanzl, M. (n.d.), "Potential of the Information Technology for the Public Participation in the Urban Planning", Retrieved September 25, 2011, from http://ptip.org.pl//download/files/ITforPP.pdf
[11]. Hornecker, E. (2006), "An encompassing view on tangible interaction: A framework", Proceedings of Computer-Human Interface (CHI) 2006 Conference, April 22-27, Montreal, Canada.
[12]. Ishii, H. (n.d.),"Tangible user interface and its evolution". Retrieved May 20, 2009, from <http://www.organicui.org/?page_id=38 > [13]. Israel, J. H. (2006), "Tangible interfaces for virtual reality based
product development", Proceedings of workshop #1, Second International Conference on Design Computing and Cognition, July 8, Eindhoven, The Netherlands.
[14]. Johanson, B., Fox, A. and Winogradd, T. (2004), "The Stanford Interactive Workspaces Project", Stanford University, Stanford, Ca. [15]. Mazalek, A. (2006), Tangible Toolkits, Proceedings of workshop #1,
Second International Conference on Design Computing and Cognition, July 8, Eindhoven, The Netherlands.
[16]. Michelson, W. (1975), “Behavioral research methods in environmental design”, Dowden, Hutchinson & Ross, Inc., Pennsylvania, U.S.A. [17]. Molenaar, M. (n.d.), "Good Governance Requires Good
Geoinformation, Geo-Information and Earth Observation in a Globalizing World", Retrieved July 27, 2009, from http://www.ife.uni-hannover.de/aktuell/125_jahre/molenaar.pdf
[18]. Moughtin, C. (1999), "Urban design – Methods and Techniques", Butterworth – Heinemann Ltd., Britain
[19]. Paterson, G. and Garner, S. (2006), "Form generation: the value of physical objects in digital design", Proceedings of workshop #1, Second International Conference on Design Computing and Cognition, July 8, Eindhoven, The Netherlands.
[20]. Qin, S. and Wright, D. (2006), "Integration of tangible interaction and rapid CAD modeling in 3D form design", Proceedings of workshop #1, Second International Conference on Design Computing and Cognition, July 8, Eindhoven, The Netherlands.
[21]. Sener, B., Wormald, P. and Campbell, I. (2002). Evaluating a haptic modeling system with industrial designers. Proceedings of the EuroHaptics-2002 International Conference, pp. 165-169, 8-10 July, Edinburgh, Scotland.
[22]. Smith, R. D. (1998), "Simulation", Retrieved November 2, 2011, from www.modelbenders.com/encyclopedia/encyclopedia.html
[23]. Whyte, J. (2002), "Virtual Reality and the Built Environment", U.K.: Architectural Press.