Abstract— In this study several methods of feature selection and classification for thyroid disease diagnosis, which is one of the most important classification problems, are proposed. Two common diseases of the thyroid gland, which releases thyroid hormones for regulating the rate of body’s metabolism, are hyperthyroidism and hypothyroidism. Classification of these thyroid diseases is a considerable task. An important problem of pattern recognition is to extract or select feature set, which is included in the pre-processing stage. As a case study, Sequential forward selection and sequential backward selection, which are two well-known heuristic schemes, are employed for feature selection. Another feature selection method considered is genetic algorithm, the popular method for nonlinear optimization problems. Support vector machine is used as classifier to separate the thyroid diseases. This study is based on two thyroid disease datasets. The first dataset is taken from UCI machine learning repository and the second one is the real data which has been gathered by the Intelligent System Laboratory of K.N.Toosi University of Technology from Imam Khomeini hospital.
Index Terms— Thyroid diseases diagnosis; Feature selection; Genetic algorithm; Support vector machine.
I. INTRODUCTION
hyroid hormones produced by the thyroid gland helps control the body’s metabolism. The thyroid gland produces two active thyroid hormones, levothyroxine (abbreviated T4) and triiodothyronine (abbreviated T3).
Manuscript received January 10, 2012.
This work was supported in part by the Iran, Electrical and Biomedical Engineering Department of Islamic Azad University Qazvin Branch.
M. R. Nazari Kousarrizi is with the Department of Electrical and Biomedical Engineering, Qazvin Branch, Islamic Azad University, Qazvin, Iran (e-email:[email protected]).
F. Seiti is with the Biomedical Engineering Group, Electrical Engineering Department K. N. Toosi University of Technology, Tehran, Iran (e-email: [email protected]).
M. Teshnehlab is with the Control Group, Electrical Engineering Department K. N. Toosi University of Technology, Tehran, Iran (e-email: [email protected]).
These hormones are important in the manufacture of proteins, in the regulation of body temperature, and in overall energy production and regulation [1,2].
The thyroid gland is prone to several very distinct problems, some of which are extremely common. Production of too little thyroid hormone causes hypothyroidism or production of too
much thyroid hormone causes hyperthyroidism.
Hypothyroidism, or an under active thyroid, has many causes. Some of the causes are prior thyroid surgery, exposure to ionizing radiation, chronic inflammation of the thyroid (autoimmune thyroiditis), iodine deficiency, lack of enzymes to make thyroid hormone, and various kinds of medication [3]. Hyperthyroidism, or an overactive thyroid, may also be caused by inflammation of the thyroid, various kinds of medications, and lack of control of thyroid hormone production. The seriousness of thyroid disorders should not be underestimated as thyroid storm (an episode of severe hyperthyroidism) and myxedema coma (the end stage of untreated hypothyroidism) may lead to death in a significant number of cases [1, 3]. Thyroid function diagnosis is an important classification issue. Proper interpretation of the thyroid data, besides clinical examination and complementary investigation, is an important problem in the diagnosis of thyroid disease[1, 2, 4] Various new methods, such as pattern recognition techniques, fuzzy classifiers, artificial immune recognition system, neural networks, etc., have been used to fit patients into a well defined status [1,2,4,5].
The proposed method has two stages. In the first stage, feature selection are utilized as a pre-processing step. The main purpose of feature selection is to reduce the number of features used in classification while maintaining acceptable classification accuracy [6]. In this study sequential forward selection (SFS), sequential backward selection (SBS) and Genetic Algorithm are used as feature selection methods. In the second stage, SVM is used to classify thyroid data.
We apply our proposed method on two thyroid datasets. The special characteristic of this study is to use the real dataset gathered from Imam Khomeini hospital in 2010. We argue that the selected features obtained from the proposed method are the same as clinical experiments used by specialists to diagnose the thyroid diseases.
The paper is organized as follows: In section II, two thyroid disease datasets are introduced. In section III, three methods of feature selection, SFS, SBS and GA, are presented
An Experimental Comparative Study on
Thyroid Disease Diagnosis Based on
Feature Subset Selection and classification
M. R. Nazari Kousarrizi
, F.Seiti, and
M. Teshnehlabrespectively. Section IV presents a review on SVM. The obtained experimental results in application are given in section V. Discussions and comparisons with previous work can be found in section VI. Finally, Section VII presents the conclusions.
II. THYROID DATASETS
In order to perform the research reported in this manuscript, two thyroid disease datasets are used. The first thyroid dataset is taken from UCI machine learning repository [1, 2, 7]. This dataset consists of 215 patients and 5 features. These features are T3-resin uptake test (A percentage), Total serum thyroxin as measured by the isotopic displacement method, Total serum triiodothyronine as measured by radioimmuno assay, Basal thyroid-stimulating hormone (TSH) as measured by radioimmuno assay, Maximal absolute difference of TSH value after injection of 200 mg of thyrotropin-releasing hormone as compared to the basal value. This dataset consist of 3 classes which are normal, hyperthyroidism and hypothyroidism.
The second dataset has been gathered by the Intelligent System Laboratory of K.N.Toosi University of Technology in the gland ward of Imam Khomeini hospital during six months in 2010 [8]. This dataset consists of 1538 patients of 21 features each, 15 binary (from x1, x8… x21) and 6 continuous
(x2, x3, x4, x5, x6, x7). In this dataset 331 patients belong to
Hyper class, 648 patients belong to Hypo class and 559 of them belong to Normal class. The features are sex, age, T3, T3RU, T4, FT4, TSH, palpitation, drowsiness, exophthalmia, diarrhea, constipation, edema, menstruation, diaphoresis, heat intolerance, cold intolerance, weight change, appetite, tremor, and nervousness.
III. FEATURE SELECTION
In attempting to classify real-world objects or concepts using computational methods, the selection of an appropriate representation is of considerable importance. For classical pattern recognition techniques, the patterns are generally represented as a vector of feature values. The selection of features can have a considerable impact on the effectiveness of the resulting classification algorithm [9, 10].
It is not often known in advance which features will provide the best discrimination between classes, and it is usually not feasible to measure and represent all possible features of the objects being classified. As a result, feature selection methods have become important techniques for automated pattern recognition [9,11], exploratory data analysis [12], and data mining [13].
The main purpose of feature selection is to reduce the number of features used in classification while maintaining acceptable classification accuracy. Less discriminatory features are eliminated, leaving a subset of the original features which retains sufficient information to discriminate
well among classes. Many search algorithms have been used for feature selection. GA has attracted more and more attention in the feature selection area [14].
Various heuristic methods have been proposed to search for near-optimal feature subsets. Sequential methods, including sequential forward selection and sequential backward selection, involve the addition or removal of a single feature at each step [15, 16]. In this paper, GA, SFS and SBS are applied as feature selection methods.
A. Genetic algorithm
Genetic algorithm (GA) is a class of optimization procedures inspired by the biological mechanism of reproduction. In the past, it has been used to solve various problems including target recognition [17], object recognition [18, 19], face recognition [20], and face detection/verification [21].
GA operates iteratively on a population of structures, each one of which represents a candidate solution to the problem at hand, properly encoded as a string of symbols (e.g., binary). A randomly generated set of such strings forms the initial population from which the GA starts its search. Three basic genetic operators guide this search: selection, crossover, and mutation.
The genetic search process is iterative: evaluating, selecting, and recombining strings in the population during each iteration (generation) until reaching some termination condition. Evaluation of each string is based on a fitness function that is problem-dependent. It determines which of the candidate solutions are better. This corresponds to the environmental determination of survivability in national selection. Selection of a string, which represents a point in the search space, depends on the string’s fitness relative to those of other strings in the population. It probabilistically removes, from the population, those points that have relatively low fitness. Mutation, as in natural systems, is a very low probability operator and just flips a specific bit. Mutation plays the role of restoring lost genetic material.
In contrast, crossover is applied with high probability. It is a randomized yet structured operator that allows information exchange between points. Its goal is to preserve the fittest individual without introducing any new value. The goal of feature subset selection is to use less features to achieve the same or better performance. Therefore, the fitness evaluation contains two terms: (1) error and (2) the number of features selected. We used the fitness function shown below to combine the two terms:
fitness = Error + α × Ones (1)
Fig. 1. A d-dimensional binary vector, comprising a single member of the GA population for GA-based feature selection.
According to “equation (1)”, the lower the error rate, the better the fitness. Also the fewer the number of features, the better the fitness. In this study, we prefer to achieve the best accuracy rate with the fewer number of features. Therefore, the first and the second term should be at the same range.
In “Fig. 1”, GA is used to find an optimal binary vector, where each bit is associated with a feature. If the ith bit of this vector is equals to 1, then the ith feature is allowed to participate in classification. If the bit is equal to 0, then the corresponding feature does not participate.
B. Sequential algorithms
Sequential forward selection (SFS) and sequential backward selection (SBS) are two well-known heuristic feature selection schemes [22]. SFS, starting with an empty feature set, selects the best single feature and then adds that feature to the feature set. SBS starts with the entire feature set and at each step drops the feature whose absence least decreases the performance. Since these strategies make local decisions, they cannot be expected to find globally optimal solutions [23]. These algorithms are tending to fall in local minima.
IV. CLASSIFICATION
Classification is often a very important part of process in many different fields like medicine. The use of artificial intelligence methods in medical diagnosis is increasing gradually. There is no doubt that evaluation of data taken from patients and decisions of experts are the most important factors in diagnosis. However, expert systems and different artificial intelligence techniques for classification also help professionals in a great deal [24].
Thyroid function diagnosis is an important classification problem. SVM is a computational and supervised method used to estimate the classification accuracy of thyroid disease diagnosis in this application.
A. Support vector machine
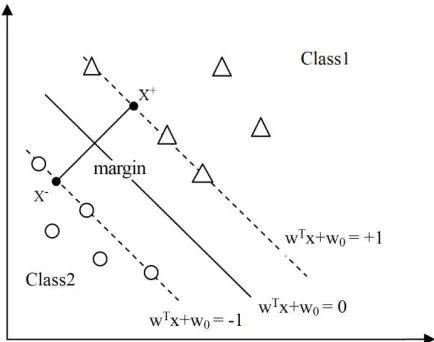
The In this section, we will briefly review the basic concepts of SVM [25, 26] for a typical two class problem (as shown in “Fig. 2”)
{, } and = {+1, −1} (2)
Fig. 2. The
sketch map of two class problem with SVM.
where x is an n-dimension feature vector belonging to either of two classes w, w, and y is the corresponding class indicator (+1 for w, −1 for w). SVM separates the two classes of points by an optimal hyperplane (with the maximum margin)
= +
= 0 (3)
where w is an input vector, x is an adaptive weight vector and
w is a bias. SVM finds the parameters and w to maximize the geometric margin 2/‖w‖ by solving the following optimization problem:
minimize ! =
‖‖ (4) subjectto + − 1 ≥0 ,# = 1, … , % (5)
To solve the quadratic optimization task, the Lagrangian function L'w, w, α is defined as
)*, , + =‖‖− ∑ + [+ − 1] (6)
where α≥ 0, i = 1 ,2, … , N, denotes Lagrange multipliers. The solution can be found through a Wolfe dual problem
max2 )3+ = 4 +
− 12 4 ++555
,5
7
subject to 4 +
= 0 and +≥ 0, # = 1 , … , % 8
Notice that we have now marked the Lagrangians different labels (P for primal and D for dual). Support vector training therefore amounts to maximizing L@α with respect to the non-negative α. In the case where the classes are not separable, we add slack variables ξ into “equation (2)” and the goal function becomes
minimize !, , B =
‖‖+ C ∑ B subject to
where C is the penalty parameter on training errors determined by users. The dual Lagrangian of non-separable class is
max2 )3+ = 4 +
− 12 4 ++555
,5
subject to
∑ + = 0 and 0 ≤ + ≤ C , # = 1 , … , % (10)
Moreover, SVM can also achieve solving the non-linear case when we map the input feature space into a higher-dimension linear feature space via kernels. In the dual Lagrangian “equation (10)”, the inner products are placed by the kernel function Kx, xK, and the non-linear dual Lagrangian L@α “equation (11)”, is similar with that in the linear generalized case
max2 )3+ = 4 +
− 12 4 ++55
,5
L, 5
subject to
4 +
= 0 and 0 ≤ + ≤ C , # = 1 , … , % 11
Typical examples of kernels used in SVM are polynomials, radial basic functions and hyperbolic tangent. In this paper, Gaussian radial basis function which gives the best results is selected. The radial basis function is defined as,
L, M = NO−|QRS|UTT) (12) Where σis the width of the Gaussian function.
B.k - fold cross- validation
For test results to be more valuable, k-fold cross-validation is used among the researchers. It minimizes the bias associated with the random sampling of the training [26].
In this method, whole data are randomly divided to k mutually exclusive and proximately equal size subsets. The classification algorithm trained and tested k times. In each case, one of the folds is taken as test data and the remaining folds are added to form training data. Thus k different test results exist for each training-test configuration. The average of these results gives the test accuracy of the algorithm [27].
In this study, 3-fold and 10-fold cross-validation approaches are used to estimate the performance of the applications.
V. EXPERIMENTAL RESULTS
In this study, SVM classifier based on feature selection methods, is applied for the two thyroid datasets. This allows for computation of sensitivity and specificity. Sensitivity is the number of true positive decisions divided by number of actually positive cases. Specificity is the number of true negative decisions divided by number of actually negative cases. A true positive decision occurs when the positive detection of the classifier coincides with a positive detection of the physician. A true negative decision occurs when both
the classifier and the physician suggest the absence of a positive detection.
A. The First Dataset Results
In this section we consider the problem of thyroid disease diagnosis for the first dataset. The simulation results of feature subset selection using SFS and SBS methods are represented in tables 1 and 2.
According to tables 1and 2, SVM classifier just selects feature subset (2, 3, 5).
GA searching strategy is based on selecting feature subset. Since this dataset comprise of 5 features, to search all feature subsets, we should estimate all combinations of 25 subsets. Because of the fewer amounts of feature subsets, GA is not a proper method in this case. Therefore, all these combinations are evaluated manually. In this step, feature subset (2, 3, 5) has the best accuracy rate amongst other feature subsets.
TABLEI
SIMULATION RESULTS OF SFS FEATURE SELECTION USING SVM FOR THE
FIRST DATASET.
classifier Feature subset
Train %
Test %
Sensitivity (%)
Specificity (%)
SVM
(2,3,5)
(3×FC) 98.6 98.61 99.48 99.56
(2,3,5)
(10×FC) 98.44 98.62 100 97.80
a. Three fold cross validation, b. Ten fold cross validation
TABLEII
SIMULATION RESULTS OF SBS FEATURE SELECTION USING SVM FOR THE
FIRST DATASET.
classifier Feature subset
Train %
Test %
Sensitivity (%)
Specificity (%)
SVM
(2,3,5)
(3×FC) 98.6 98.61 99.48 99.56
(2,3,5)
(10×FC) 98.44 98.62 100 97.80
B.The Second Dataset Results
This real dataset has been gathered by the Intelligent System Lab of K.N.Toosi University of Technology in the gland ward of Imam Khomeini hospital during 6 months in 2010.
The crossover rate and the mutation rate are 0.8 and 0.04, respectively.
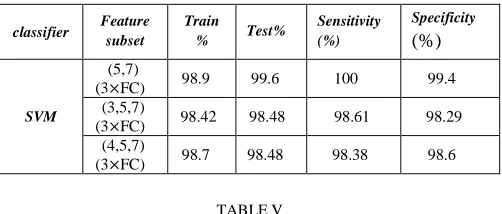
In this dataset, feature subset (5,7) has the best performance in all three feature selection methods. Among these three methods, GA is more reliable than SFS and SBS. GA is based on a global search; in contrast, SFS and SBS algorithms make local decisions. SFS and SBS algorithms need less time to implement than GA.
TABLEIII
SIMULATION RESULTS OF SFS FEATURE SELECTION USING SVM FOR THE
SECOND DATASET.
classifier Feature subset
Train %
Test %
Sensitivity (%)
Specificity (%)
SVM
(4,7)
(3×FC) 97.2 99.13 99.3 98.7 (5,7)
(3×FC) 98.9 99.6 100. 99.4 (4,5,7)
(3×FC) 98.7 98.48 98.38 98.6
TABLEIV
SIMULATION RESULTS OF SBS FEATURE SELECTION USING SVM FOR THE
SECOND DATASET.
classifier Feature subset
Train
% Test%
Sensitivity (%)
Specificity (%)
SVM
(5,7)
(3×FC) 98.9 99.6 100 99.4 (3,5,7)
(3×FC) 98.42 98.48 98.61 98.29 (4,5,7)
(3×FC) 98.7 98.48 98.38 98.6
TABLEV
SIMULATION RESULTS OF GA FEATURE SELECTION USING SVM FOR THE
SECOND DATASET.
VI. DISCUSSION AND COMPARISON
Classification systems have been used for thyroid disease diagnosis as well as for other clinical diagnosis problems. There have been several studies reported focusing on thyroid disease diagnosis [15, 24, 27]. These studies applied different methods to the given problem and achieved high classification accuracies using the first dataset is taken from UCI machine learning repository.
For the first thyroid disease dataset, the classification accuracies obtained by this and other studies are presented in table 6.
According to table 6, the classification accuracies of AIRS and IG-AIRS obtained by Kodaz et al. [24] are better than the
classification accuracies of all methods obtained by Temurtas [27] and Sun [28]. However, IG-AIRS method is worse than the classification accuracy of GPC-EP obtained by Kim et al. [29]. Also the classification accuracy of PNN structure obtained by Temurtas [27] is better than all methods obtained by Ozyılmaz [1], Polat et al. [2] and Sun [28].
In this study, a number of experiments and comparisons to demonstrate the importance of feature selection for thyroid disease diagnosis are performed. Previous works didn’t consider the problem of feature selection. From the same table, the classification accuracies of SVM obtained by this study is better than all the previous methods. Also the best result of classification accuracy is obtained from SVM structure with feature subset (2, 3, 5) (98.62%).
The second dataset is the real data which has been gathered by Intelligent System Labaratory of K.N.Toosi University of Technology from Imam Khomeini hospital. This dataset has not been implemented by any methods of thyroid disease diagnosis yet. The best simulation results of this experiment are shown in table 7. According to this table, feature subset (5, 7) is selected by all three feature selection methods because it performs well in this dataset.
VII. CONCLUSION
The integrated feature selection and classification approach described has proved effective on these two thyroid datasets. Because the feature values are very much closed, thyroid disease is a hard problem to be solved for classification systems. In this study, two thyroid disease datasets are applied in the performance analysis of our proposed system.
For the first dataset, we obtain a classification accuracy of 98.62% using SVM with feature subset (2, 3,5), which is the highest accuracy reached so far. moreover, the classification accuracy obtained from this structure shows an improvement of 1.39% in comparison with the best technique reported.
In this dataset, the feature subset (2, 3, 5) is selected, because it is more effective than other feature subsets.
These features are as follows:
Feature 2: Total serum thyroxin as measured by the isotopic displacement method.
Feature 3: Total serum triiodothyronine as measured by radioimmuno assay.
Feature5: Maximal absolute difference of TSH value after injection of 200 mg of thyrotrophic-releasing hormone as compared to the basal value
The second dataset is the real data which has been gathered by the Intelligent System Laboratory of K.N.Toosi University of Technology from Imam Khomeini hospital. In this case, GA-SVM shows the best classification accuracy among all proposed methods. Features “5” (T4) and “7” (TSH) are continuous.
The application of SVM classifier based on feature selection methods for thyroid disease datasets gives good classifier Feature
subset
Train %
Test %
Sensitivity (%)
Specificity (%)
results with regard to the previous studies for corresponding datasets. Our proposed method can be used confidently to help experts for decision making in their diagnosis.
In the correct of diagnosis of thyroid disorders, proper interpretation of thyroid data besides clinical examination and complementary investigation is an important issue.
TABLEVI
CLASSIFICATION ACCURACIES FOR FIRST THYROID DISEASE DATASET PROBLEM WITH CLASSIFICATION ACCURACIES OBTAINED BY OTHER
STUDIES.
Study Method Accuracy%
Ozyılmaz and Yıldırım
[1]
MLP (MLNN) with bp (3 ×FC) MLP (MLNN) with fbp (3 ×FC) RBF (3 ×FC)
CSFNN (3 × FC)
86.33 89.80 79.08 91.14 Kim and Ghahramani [29]
LDA (10 ×FC) SVM (soft) GPC-EP (s,soft) GPC-EP (m,soft) 93.44 94.44 96.75 97.23
Ploat et al. [2]
AIRS (10 ×FC)
AIRS with fuzzy weighted pre-processing (10 × FC)
81.00
85.00
Temurtas [27]
MLNN with LM (3 × FC) PNN (3 × FC)
LVQ (3 × FC)
MLNN with LM (10 ×FC) PNN (10 × FC)
LVQ (10 × FC)
92.96 94.43 89.79 93.19 94.81 90.05 Sun [28]
C4.5 Base (10 ×FC) C4.5 AdaBoost HPWR Base (Od = 3) HPWR AdaBoost (Od = 3)
91.57 91.12 91.66 88.17 Halife Kodaz [24]
AIRS (10 ×FC) IG-AIRS (10 ×FC)
94.82 95.90
Proposed Method
SVM with feature subset (2,3,5) as input (3 × FC)
SVM with feature subset (2,3,5) as input (10 × FC)
98.5
98.62
Generally, the most important clinical experiments that specialists use to diagnose thyroid diseases are TSH, T4 and T3. In this study, we argue that the most important characteristic of the selected features obtained from our proposed method is that they are the same as the clinical experiments used by specialists to diagnose thyroid diseases.
TABLEVII
SIMULATION RESULTS OF THE PROPOSED METHOD FOR THE SECOND DATASET.
Method Train
%
Test %
Study
SVM with feature subset (5,7) as input 98.9 99.6
Proposed Method
REFERENCES
[1] L. Ozyılmaz and T. Yıldırım, “Diagnosis of thyroid disease using artificial neural network methods,” in: Proceedings of ICONIP’02 9th international conference on neural information processing (Singapore: Orchid Country Club, 2002) pp. 2033–2036.
[2] K. Polat, S. Sahan and S. Gunes, “A novel hybrid method based on artificial immune recognition system (AIRS) with fuzzy weighted preprocessing for thyroid disease diagnosis,” Expert Systems with
Applications,vol. 32, 2007, pp. 1141-1147.
[3] G. Zhang, L.V. Berardi, “An investigation of neural networks in thyroid function diagnosis,” Health Care Management Science, 1998, pp. 29-37. Available: http://www.endocrineweb.com/thyroid.html, (Accessed: 7 August 2007).
[4] K. Hoshi, J. Kawakami, M. Kumagai, S. Kasahara, N. Nisimura, H. Nakamura, et al., “ An analysis of thyroid function diagnosis using Bayesian-type and SOM-type neural networks,” Chemical and
Pharmaceutical Bulletin, vol. 53, 2005, pp. 1570-1574.
[5] D. Delen, G. Walker, A. Kadam, “Predicting breast cancer survivability: A comparison of three data mining methods,” Artificial Intelligence in
Medicine, vol. 34, 2005, pp. 113-127.
[6] R.A. Fisher, “The use of multiple measurements in taxonomic problems,” Annals of Eugenics 7, 1936, pp. 179–188.
[7] UCI Repository of Machine Learning Databases, University of California at Irvine, Department of Computer Science. Available:
http://www.ics.uci.edu/~mlearn/databases/thyroid-disease/new-thyroid.data (Accessed: 10 May 2010).
[8] Imam Khomeini hospital, Tehran University of medical sciences. Available:
http://medicine.tumbs.ac.ir/fa/showhospital.aspx?lt=1&li=149 (Accessed: May 2010).
[9] A.K. Jain and D. Zongker, “Feature selection: Evaluation, application, and small sample performance,” IEEE Trans. Pattern Analysis and
Machine Intelligence vol. 19, 1997, pp. 153–158.
[10] F.J. Ferri, P. Pudil, M. Hatef, and J. Kittler, “Comparative study of techniques for large-scale feature selection,” in: E. S. Gelsema and L. S. Kanal, eds., Pattern Recognition in Practice IV, Multiple Paradigms, Comparative Studies and Hybrid System (Elsevier, Amsterdam, 1994) pp. 403–413.
[11] A. Biem, S. Katagiri, and B.H. Juang, “Pattern recognition using discriminative feature extraction,” IEEE Trans. Signal Processing, vol. 45, 1997, pp. 500–504.
[12] J. Mao and A.K. Jain, “Artificial neural networks for feature extraction and multivariate data projection,” IEEE Trans. Neural Networks 6 (1995) 296–317.
[13] M.L. Raymer, W.F. Punch, E.D. Goodman, P.C. Sanschagrin, and L.A. Kuhn, “Simultaneous feature scaling and selection using a genetic algorithm,” in: Th. Back, eds., Proceedings of 7th International Conference on Genetic Algorithms (ICGA) (CA: Morgan Kaufmann, San Francisco, 1997, pp. 561–567.
[14] D. Goldberg, “Genetic Algorithms in Search, Optimization, and Machine Learning” (Addison Wesley, Reading, MA, 1989).
[15] M.L. Raymer, T.E. Doom, L.A. Kuhn, and W.F. Punch, “Knowledge Discovery in Medical and Biological Datasets Using a Hybrid Bayes Classifier/Evolutionary Algorithm,” IEEE Trans. systems, Man, and
Cybernetics, 2001, pp. 236-245.
[16] A. Whitney, “A direct method of nonparametric measurement selection,” IEEE Trans. Computers, vol. 20, 1971, pp. 1100 –1103. [17] A. Katz, P. Thrift, “Generating image filters for target recognition by
genetic learning,” IEEE Trans. Pattern Analysis and Machine
Intelligence, vol. 16, 1994, pp. 906–910.
[18] G. Bebis, S. Louis, Y. Varol, A. Yfantis, “Genetic object recognition using combinations of views,” IEEE Trans. Evolutionary computation, vol. 6, 2002, pp. 132–146.
[19] D. Swets, B. Punch, J. Weng, “Genetic algorithms for object recognition in a complex scene,” IEEE International Conference on Image
[20] C. Liu, H. Wechsler, “Evolutionary pursuit and its application to face recognition,” IEEE Trans. Pattern Analysis and Machine Intelligence, vol. 22, 2000, pp. 570–582.
[21] G. Bebis, S. Uthiram, M. Georgiopoulos, “Face detection and veri1cation using genetic search,” International Journal on Artificial
Intelligence Tools, vol. 9, 2000, pp. 225–246.
[22] T. Marill, D. Green, “On the effectiveness of receptors in recognition systems,” IEEE Trans. Information Theory, vol. 9, 1963, pp. 11–17. [23] Z. Sun, G. Bebisa, R. Miller, “Object detection using feature subset
selection,” Pattern Recognition, vol. 37, 2004, pp. 2165 – 2176. [24] H. Kodaz, S. Ozsen, “A. Arslan, and S. Gunes, Medical application of
information gain based artificial immune recognition system (AIRS): Diagnosis of thyroid disease,” Expert Systems with Applications, vol. 36, 2008, pp. 3086-3092.
[25] C. J. C. Burges, “A tutorial on support vector machines for pattern recognition, Data Mining and Knowledge Discovery,” vol. 2, 1998, pp. 121–167.
[26] S. Theodoridis and K. Koutroumbas, Pattern recognition (2nd ed.) (Academic Press, New York, 2003).
[27] F. Temurtas, “A comparative study on thyroid disease diagnosis using neural networks,” Expert Systems with Applications, vol. 36, 2009, pp. 944-949.
[28] Y. Sun, Cost-sensitive boosting for classification of imbalanced data, Ph.D. thesis, Waterloo University, Canada, 2007.
[29] H.C. Kim and Z. Ghahramani, “Bayesian Gaussian process classification with the EM-EP algorithm,” IEEE Trans. Pattern Analysis and Machine