Abstract— A model of viral infection of monocytes population by dengue virus is formulated here. The model takes into account the immune response and also the haematocrit. The dynamic of haematocrit effect for dengue infection is presenting by the function that concerning the contact between free-virus and immune response. We also simulate the model base on dengue patient data from Hasan Sadikin Hospital Bandung. From some numerical simulations it is concluded that the first model simulation can capture the phenomena the rise of haematocrit level for dengue infection patient. The second model simulate that the density of thrombocyte decrease during the dengue infection process found in the dengue patient data.
Keywords: Dengue infection, plasma leakage, haematocrit level.
I. INTRODUCTION
engue is among dangerous vector-borne disease found mainly in tropical countries. It may lead to fatality in some cases, especially when it infects people for the second time- known as a secondary infection. The disease is caused by one of four known strains of flavivirus, namely DEN-1, DEN-2, DEN-3, and DEN-4. There are three stages of of severity on an infected human : Dengue Fever comes with headaches, bone or joint muscular pains, rash and leukopeni as symptoms, Dengue Haemorrhagic Fever (DHF) is characterized by four mayor clinical manifestations: high fever, haemorrhagic phenomena, often with hepatomegaly and in severe cases, signs of circulatory failure and blood discharge from the vessel and such patients may develop hypovolaemic shock resulting from plasma leakage. This is called dengue shock syndrome (DSS) and can be fatal [12]. Two main pathophysiological changes occur in DHF/DSS. One is an increased vascular permeability that gives rise to loss of plasma from vascular compartment. This result in haemoconcentration, low pulse pressure and other signs of shock, if plasma loss becomes critical. The second change is disorder in haemostasis involving vascular changes, thrombocytopenia and coagulopathy [12].
The laboratory findings that thrombocytopenia and
haemoconcentration are constant findings in DHF.
N. Nuraini is with Industrial and Financial Mathematics Research Group, Faculty of Mathematics and Natural Sciences Institut Teknologi Bandung, Indonesia (e-mail: [email protected]).
H. Tasman is with Mathematics Department, University of Indonesia. Publication of this research is funded by IMHERE FMIPA ITB 2012.
A drop in platelet count to below 100.000 per mm3 is usually
found between the third and eight day of illness, often before or simultaneous with changes in the haematocrit. A rise in the haematocrit level, indicating plasma leakage, is always present, even in non-shock cases, but is more pronounced in shock cases. Haemoconcentration with an increase in the haematocrit of 20% or more is considered to be definitive evidence of increased vascular permeability and plasma leakage [3], [12]. The normal adult values of haematocrit level are 40-50% for male and 37-47% for female. In this paper we would like to simulate a simple model for haematocrit dynamic using differential equation from dengue infection process. The model try to capture the interaction between cell inside the human body. Mathematical modeling of dengue disease transmission in human and mosquito populations have been done since the beginning of last century. Some of the recent models could be seen in [4],[5],[6],[10],[13]. Meanwhile, mathematical modeling for with-in host dengue viral disease is quite new. Some attempts to understand the dengue viral growth in human body using mathematical models have been done [8]. In this paper we we will investigate the effect of dynamic of haematocrit in two different scenarios, first if the treatment only use a standard virus dynamic equation, second using the data from Hasan Sadikin Hospital Bandung Indonesia, that represent the variability of thrombocytopenia and haematocrit level. In section 2, we describe the previous model in [9] and introduce one compartment concerning the haematocrit level. Section 3, consist the data analysis from Hasan Sadikin Hospital, Bandung, Indonesia. Original data contain the information for dengue patient to see the relation between haematocrit and thrombocytopenia from dengue patient data. In the last two section we show the simulation and conclusion for the micro-scale model of dengue infection.
II. MODEL FORMULATION
Model for haematocrit dynamic. In this section we
formulate a dengue growth model in human body. The model starts from the beginning of detectable viraemia period, that is two days before the onset of symptoms. We assume that the serotype of dengue virus in an infected human is homogenous and dengue virus infects monocytes in blood. The model without dynamic of haematocrit are discussed in [9].
Simulation Model for Dengue Infection
N. Nuraini & H. Tasman
Let S(t), I(t), V(t), Z(t) and H(t) represent the density of susceptible monocytes, infected monocytes, free virus particles, T-cells and haematocrit level in 1 µ l blood at time t respectively. The production of susceptible monocytes by bone marrow is assumed at a constant rate µ and the life span
of susceptible monocytes is 1
α . The flow from susceptible
monocytes to the infected monocytes depends on successful invasion rate of virus, a, the number of susceptible monocytes and free virus particles. The infected period of infected
monocytes is assumed constant as 1
β . We assume virus
multiplication is at constant rate, k, and the virus clearance
rate is also at constant rate γ.
We assume T-cells is produced in thymus at constant rate η
and their life span is 1
δ . Kurane and Ennis proposed that the
increased number of dengue-virus infected monocytes results in the increased T-cell activation [3]. Hence we assume there is stimulation production of T-cells at a constant rate c which is proportional to the density infected monocytes. We also assume that T-cells will eliminate the infected monocytes at a
constant rate υ. Finally, we model the dynamic of haematocrit
depend on the production rate of Red Blood Cell (RBC) ρ, and
the reduction from the life-span of this cell, 1
σ . We assume
that if the dengue virus start to infect the human body, than the haematocrit level will increase with function f. This function represent the effect of interaction between free virus and immune response. Then the model for with-in host dengue viral infection with dynamic of haematocrit is as follow.
,
,
,
,
.
dS S dt dI dt dV kI dt dZ cI dt dH dtaSV
aSV
I
IZ
V
aSV
dIZ
Z
f
H
µ α ηβ
υ
γ
δ
ρ
σ
= − = = = + =−
−
−
−
−
+
−
+ −
( 1 )
Model (1) is closely related with the self regulating cytotoxic T lymphocytes (CTL) response model and the linear immune response model which exist in Chapter 6 of [7]. In model (1) we divide the simulations into two scenarios, first, if we choose f = bVZ, where b is parameter of contact effect for haematocrit level for interaction between free virus and immune response that influence the haematocrit level. Second, if f define as a piecewise function that incorporate the dengue
patient data information for haematocrit level and the density of thrombocyte in the period of infection. We have that for the biological interest, the region of model (1) is
(
)
{
S I V Z H, , , , : , , , ,S I V Z H 0 ,}
Ω = ≥
and all of the parameters used in model (1) are positive.
If we substitute S = 0 into the first equation of model (2), we
get dS 0.
dt >
. Substituting I = 0, V = 0, Z = 0, H = 0 into the
second, the third, the fourth and the fifth equation of model
(1) respectively, we get dI 0,dV 0,dZ 0
dt > dt > dt >
and dH 0,
dt >
respectively. In other words, the vector field on the boundary
of Ω does not point to the exterior of Ω. Hence the region Ω
is positively invariant under the flow induced by model (1).
III. DATA ANALYSIS
In this section we analyze the data of dengue patient from Hasan Sadikin Hospital, Bandung Indonesia in the four days infection period during the treatment session in hospital. We do the following steps to analyze the data.
1. Step one, we plot the thrombocyte and haematocrit
data to see the distribution of the data.
2. Step two, define the difference for each data per day,
for thrombocyte,
∆TRk = TRn+1 – TRn
and for haematocrit
∆HTk = HTn+1 – HTn
where n and k denote the day when dengue patient in hospital, k=1,2,3 and n=1,2,3,4.
3. Step three, plot ∆TRk vs ∆HTk for each day k, and
used linear regression to find the relation between thrombocyte and haematocrit data.
The result of three steps above represent in Figure 1, 2 and 3.
In Figure 1. x- axis denote as ∆HT1 (haematocrite) and y- axis
∆TR1 (thrombocyte). This figure represent the linear
regression for day one to day two. Figure 2. represent ∆HT2
and ∆TR2 for day two to day three. Figure 3. represent ∆HT3
and ∆TR3 for day three to day four. All linear regressions in
Figure 1,2 and 3 show that the density of thrombocyte
decrease, it is confirmed by the symptoms of
thrombocytopenia. As a consequent we choose the function of f in model (1) for second scenario, a piece wise function of linear regression from data analysis result as in Figure 1,2,3. We will simulate the model for four days, and define the f as follow.
4
5
5
10
4.374,1
2;
9.10
1.726, 2
3;
5.10
1.310, 3
4.
H
t
f
H
t
H
t
− − −
−
−
≤ <
= −
−
≤ <
−
−
≤ <
Figure 1. The linier regression for patient data from day one to day two.
Figure 2. The linier regression for patient data from day two to day three.
Figure 3. The linier regression for patient data from day three to day four.
IV. NUMERICAL SIMULATION
We divide this section into two cases. First, if we choose f as a function of free-virus and immune response, that is bV Z, b is parameter of contact effect for haematocrit level for interaction between free virus and immune response. Second, we set the value of function f depends on dengue patient data from the previous section.
Simulation for the first model. In this paper we do not
describe the stability analysis of the model (2), the detailed analysis of the model without haematocrit dynamic are presented in [9].
For the following numerical simulations, the referenced value of parameters used in model (1) is listed in Table 1. The
estimated value of η is obtained by assuming that the
equilibrium value of the density of T-cells in the absence of infection is 2000 cells.
Parameter Estimated value Ref.
µ 80 cells/day. µl [11]
1
α 3 days [11]
1
δ 20 years [1]
η 0.265 cells/day. µl -
ρ 2. 104 cells/day. µl [2]
σ 400/9.103 cells/day. µl [2]
Table 1. Parameter value
The result of simulation model (1) for first scenario is presented below.
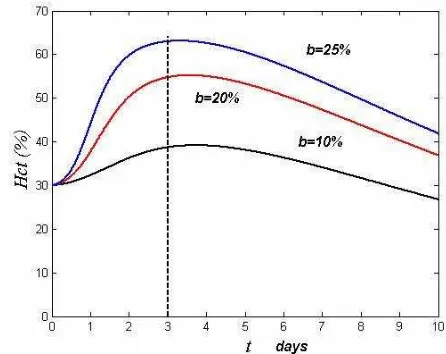
Figure 4. Simulation of model (1) for first scenario for different parameter of contact rate between free virus and
immune response.
haematocrit decreasing to normal level. We compare this situation with our model simulation as in Figure 4. In this figure we see that the haematocrit level also increase until the third day and then decrease to reach the normal level. In this model increasing the parameter of contact effect for haematocrit level for interaction between free virus and immune response will increase the haematocrit level.
Figure 5. Haematocrit data from dengue patient from Hasan Sadikin Hospital Bandung
Simulation for the second model In the second simulation
we choose the parameter f as in equation (2). We solved the equation of haematocrit compartment separately from the model (1) because it is decouple system from equation (1).
Solving dH f H g,
dt = + −ρ σ +
where f as in equation (2) and
g, a function of treatment as long as the patient in hospital. We
choose the function of g constant but depend on time, because we assume that a treatment for dengue patient such as fluid injection. This fluid consist of important vitamins and minerals to imboost the immune response. We simulate the condition when g = 0 as shown in Figure 6.
Figure 6. Simulation of model (1) for second scenario.
In Figure 6 we have that the haematocrit level still increase until fourth day, this situation happened because we assume that we set the treatment function is zero in second model. Simulation of second model capture the phenomena when there is no appropriate treatment in the model, then the level of haematocrit still increasing. We do not discuss the treatment function because there is no available data that we can use to simulate that condition.
V.CONCLUSION
A main characteristic of dengue infection is still mystery, but we assume that the time-course relationship between a drop in platelet count and rapid rise in haematocrit level appears before shock. From some numerical simulations it is concluded that the first model simulation can capture the phenomena the rise of haematocrit level for dengue infection patient. The second simulation model from data analysis result show that the density of thrombocyte decrease during the dengue infection process. If we compare those two simulations we can conclude that first simulation using system of differential equation as in model (2) is more realistic than the second simulation. In the second simulation we use real data of dengue patient from hospital. And this simulation capture the condition when there is no appropriate treatment for this infection. From data analysis we can capture the situation when thrombocyte decrease, the haematocrit level will increase. The second model simulation show that for the given treatment function, g, the decreasing haematocrit level will occured. For further study, we would like capture the plasma leakage phenomena from dengue infection, because evidence of plasma leakage due to vascular permeability in dengue infection, manifested by at least one of the following: a rise in the haematocrit equal to or greater than 20% above average for age, sex and population; a drop in the haematocrit following volume-replacement treatment equal to or greater than 20% of baseline.
References
[1]. A.R. McLean and C.A.Michie, In vivo estimates of
division and death rates of human T
lymphocytes,Proc. Natl. Acad. Sci. USA, 92 (1995), 3707--3711.
[2]. B.S. Bull, J.A. Koepke, E. Simpson et. al ``Procedure
for determining packed cell volume by the
haematocrit method" 3th edition, NCCLS publication
H7-A3, Wayne, Pennsylvania 2000.
[3]. D.J. Gubler, Dengue and Dengue Hemorrhagic
[4]. L. Esteva and C. Vargas, Analysis of a dengue disease transmission model, Mathematical Biosci.,
150 (1998), 131--151.
[5]. L. Esteva and C. Vargas, A model for dengue
disease with variable human population, J. Math. Biol., 38 (1999), 220--240.
[6]. L. Esteva and C. Vargas, Coexistence of different
serotypes of dengue virus, J. Math. Biol., 46 (2003), 31--47.
[7]. M.A. Nowak and R.M. May ``Virus dynamics:
Mathematical principles of immunology and
viroloy," Oxford University Press, 2000.
[8]. N. Nuraini, E. Soewono and K.A. Sidarto, A
mathematical model of dengue internal transmission process, J. Indones. Math. Soc., 13 (2007), 123--132.
[9]. N. Nuraini, H. Tasman, E. Soewono and K.A.
Sidarto, A with-in host Dengue infection model with immune response, J. Math. and Comp. Mod., 49 (2009), 1148--1155.
[10].N. Nuraini, E. Soewono and K.A. Sidarto, A
mathematical model of dengue disease transmission with severe DHF compartment, Bull. Malay. Math. Sci. Soc., 2-30 (2007), 15--29.
[11].R. Bertell, Internal bone seeking radionuclides and
monocyte counts, International Perpectives in Public Health, 9 (1993), 21--26.
[12].World Health Organization, ``Dengue haemorrhagic
fever: Diagnosis, treatment, prevention and control"
2nd edition, WHO, Geneva, 1997.
[13].Z. Feng and J.X. Velasco-Hernandez, Competitive
exclusion in a vector-host model for the dengue fever,J. Math. Biol., 35 (1997), 523--544.