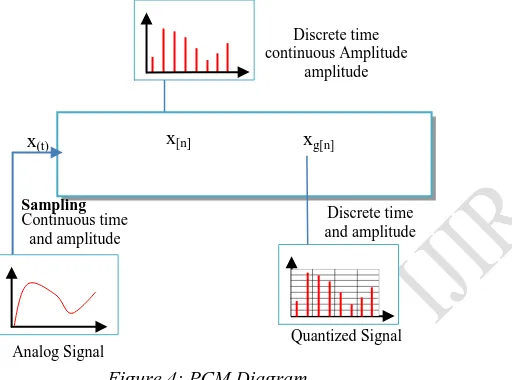
Simulation Scenario For Digital Conversion And Line Encoding Of Data Transmission
Full text
Figure


Related documents
Case reports and case series studies were eligible for the inclu- sion if they met the following criteria, (a) reporting one or more pregnant women diagnosed with brucellosis;
Some studies also validate trust and risk assumptions using canonical games even when the context of the experiments is different from the social behavior or farm
This inference is supported by the observation that in colon cancer SW620 cells, the level of methylated promoter of miR-34a was decreased in response to CDF treatment, and that
(2016): Optic disc perfusion in primary open angle and normal tension glaucoma eyes using optical coherence tomography ‐ based microangiography.. Cennamo G, Montorio D, Velotti
The new COP 2540 is a high frequency rock drill option for SmartROC T35, designed to perform in the same hole range and carry on the legacy of the highly regarded COP 1840. With
Using model interaction Hamiltonians for both electrons and phonons and Green’s function formalism for ballistic transport, we have studied the thermal conductance and
Six stalagmites (from Korallgrottan, B7 Cave, Spannagel Cave, H¨olloch Cave, Savi Cave, and Garma Cave) reveal higher δ 18 O calcite value at present-day compared to 6 ka BP, while
Samples were liquidised with phosphate buffer (A 5ml/g, B 5ml/g, and C 7ml/g) and each sample was extracted twice. Field sample extraction DNA Conc.. Concentration and quality of
