Page 407 www.ijiras.com | Email: [email protected]
Optical, Volumetric And Viscometric Studies Of Binary Liquid
Mixtures
R. D. Singh
Department of Physics, Babu Banarasi Das University, Lucknow, India
M. Gupta
Department of Physics, University of Lucknow, Lucknow, India
I. INTRODUCTION
Excess and bulk properties of mixture provide insight into the molecular interactions between various components and can be used for the development of molecular models describing the thermodynamic behavior of mixtures. Experimental determination of all these properties is time consuming and expensive especially if data have to be known at various state of condition and compositions. Therefore, the properties of multi-component mixtures are often estimated from the corresponding data of the constituting binary mixtures but the reliability of such an estimation is always questionable and has to be tested 1)
Excess properties such as excess molar volume and deviation in refractive index and its variation with temperature and composition of binary mixtures are useful for design engineering process, in chemical and biological industries 2-3) and to test theories of solution 4). Measurements of refractive index, viscosity with molar volume of liquid and liquid mixtures have gained much importance during recent past 5-8), since these data provide reliable information regarding the specific interactions between components.
Thermodynamic and transport property data are of great interest in process design and separation. Viscosity and density data are required in many chemical engineering calculations involving fluid flow, heat and mass transfer. Moreover, the knowledge of the dependence of refractive index and density on composition of mixture is of considerable interest in understanding the intermolecular interaction. The present work is a continuation of systematic experimental studies on thermodynamic and transport properties of binary mixtures of dimethyl sulfoxide (DMSO) with formamide (FA) and N, N- dimethylformamide (DMF), as these solvents and their mixtures have important applications in chemical industry and modern technology9).
In order to investigate the molecular interactions in the mixture of DMSO with formamide and N, N-dimethylformamide through optical, volumetric and viscometric properties, we report here the refractive indices (
n
m), densities (
m) and viscosity (
m) of these mixture over the entire composition range at temperatures 293, 303 and 313K. These experimental data have been used to evaluateAbstract: Refractive indices, densities and viscosities of binary mixtures of dimethyl- sulfoxide (DMSO) with formamide and N,N-dimethylformamide have been measured over the entire composition range at 293, 303 and 313K. Refractive index, viscosity and density data have been used to evaluate the molar refraction deviation (
R
m), excess molar volume (V
mE) and deviation in viscosity (
). The results were fitted to the Redlich –Kister polynomial equation of third degree and the adjustable parameters were obtained using least square method. Precise estimation and reliability of various mixing rules for refractive indices and densities have been scrutinized over the entire composition range for both the mixtures. Further, the experimental results were used to study the nature and extent of interaction present in the mixture.Page 408 www.ijiras.com | Email: [email protected] molar refraction deviation (
R
m), excess volume (V
mE) anddeviation in viscosity (
). The results have been used to discuss the nature of interaction between unlike molecules in terms of dipole-dipole interaction and dispersive forces. Since refractive index is closely related with orientation, ordering and strength of the constituent atomic oscillators of given medium, it is expected that variation of refractive index of mixture with temperature and composition can give valuable insight into the molecular rearrangement due to mixing. Therefore, six mixing rule for refractive index proposed by Lorentz-Lorenz (L-L), Gladestone Dale (G-D), Wiener (W), Heller (H), Newton (Nn) and Eykman (Eyk)10) and Hankinson – Brobst – Thomson (HBT) model 11)for estimation of density have also been applied to these mixtures. The relative merits of these relations were discussed and results have been presented in terms of average percentage deviation (APD) and root mean square deviation.
II. EXPERIMENTAL DETAILS
Refractive indices (
n
m) were measured with Abbe’s refractometer provided by Optics Technologies, Delhi. Calibration of refractometer was performed periodically under atmospheric pressure, in accordance with specifications, using triply distilled water and benzene at 293K. The uncertainty of refractive index measurement was estimated to be less than ± 0.001 units. The sample mixtures were directly injected into the prism assembly of the instrument by means of an air tight hypodermic syringe. An average of four to five measurements was taken for each sample mixtures. Densities and viscosities of liquids and liquid mixtures have been measured using a single capillary pyknometer and Ostwald’s viscometer as discussed earlier 5). All measurements have been carried out at three temperatures viz 293, 303 and 313K using a microprocessor based temperature controller (Julabo F 25 HD) (accuracy ± 0.010C).Mixtures were prepared by weighing the liquids in specially designed ground glass stoppered weighing bottles, taking extreme precautions, in order to prevent evaporation losses during the experiment. A sartorius (BP 121S) single pan balance having a stated precision of 0.1 mg was used through out. The maximum possible error in the mole fraction is estimated to be 0.0001.
The chemicals used were obtained from Ranbaxy Fine Chemical Limited. All the chemical used were purified by standard procedure, discussed by Perrin and Amarego12).
III. THEORY
The molar refraction deviation
R
m was determined using the following equation 5):idl m t m
m
R
R
R
exp (1), where
m m m t mM
x
M
x
n
n
R
2 21 1 2 2 exp
2
1
(1.1),and
2 22 2 2 2 1 1 2 1 2 1
2
1
2
1
m midl m
M
n
n
M
n
n
R
(1.2),The experimentally measured densities were used to predict the excess molar volume using equation 13)
2 2 2 1 1 1 2 2 1 1
x
M
x
M
x
M
x
M
V
mE
(2),and deviation in viscosity (
) were calculated from the experimental result by following equations:)
(
1
1 2
2
m
x
x
(3), where symbols have their usual meaning. A Redlich-Kister equation was used to correlate the derived properties of the binary mixtures by least square method14).
3 1 1 1 2 21
(
)
i i i E
x
x
a
x
x
Y
(4),where
Y
Erefers to
R
m,V
mE or
anda
i is the fitting parameter. The root mean square deviation is evaluated using the relation:
21 2 exp
)
(
m
n
Y
Y
Y
cal E E E
(4.1),where n is number of data point and m is the number of coefficients.
Six mixing rules for refractive indices, as described earlier 10) have been used to scrutinize the relative merits of these mixing rules. Hankinson- Brobst – Thomson (HBT) model for liquid density 11) could be described as:
R SRK RV
V
V
M
1
0* (5), where 3 4 3 2 3 1 0 ) 1 ( ) 1 ( ) 1 ( ) 1 (
1 r r r r
R a T b T c T d T
V (5.1),
0.25 <
T
r< 0.95 and)
00001
.
1
(
)
(
2 3) (
r r r r RT
hT
gT
fT
e
V
(5.2),0.25 <
T
r< 1.0 and coefficients:a
= -1.52816 e = -0.296123 b = 1.43907 f = 0.386914 c = 0.81446 g = -0.0427258 d = 0.190454 h= -0.0480645
IV. RESULTS
Page 409 www.ijiras.com | Email: [email protected] (
V
mE) and deviation in viscosity (
) are reported in TablesI and II for DMSO + formamide and DMSO + N, N- dimethylformamide mixtures respectively at 293, 303 and 313K. The fitting parameters (
a
i) along with root mean square deviation
(
Y
E)
are gathered in Table III. Theoretically estimated values of refractive indices in terms of average percentage deviation (APD) are reported in Table IV.In order to predict density using HBT model, critical values required for each compound along with root mean square deviation are given in Table V. The temperature and composition dependence of molar refraction deviation (
R
m), excess molar volume (V
mE) and deviation in viscosity (
) are shown in Figs. 1-3 respectively for both the mixtures.x1
m
(kg/m3) m
n
R
mE m
V (103) (m3/mol)
(Pa-s) T=293K 0.0000 0.0604 0.1261 0.1982 0.2776 0.3654 0.4643 0.5739 0.6979 0.8391 1.0000 1137.0 1133.9 1130.5 1127.2 1123.8 1120.4 1117.0 1113.5 1110.0 1106.6 1103.0 1.4440 1.4490 1.4530 1.4560 1.4590 1.4630 1.4660 1.4690 1.4730 1.4760 1.4770 0.0000 -0.3748 -0.7047 -0.9910 -1.2005 -1.2972 -1.3190 -1.2212 -0.9519 -0.5421 0.0000 0.0000 -0.0150 -0.0193 -0.0257 -0.0283 -0.0303 -0.0323 -0.0320 -0.0287 -0.0204 0.0000 0.0000 0.2241 0.4351 0.6275 0.7919 0.9157 0.9822 0.9657 0.8327 0.5332 0.0000 T=303K 0.0000 0.0604 0.1261 0.1982 0.2776 0.3654 0.4643 0.5739 0.6979 0.8391 1.0000 1129.0 1125.6 1122.1 1118.5 1114.9 1111.3 1107.7 1104.1 1100.5 1096.8 1093.0 1.4400 1.4430 1.4460 1.4500 1.4530 1.4560 1.4590 1.4620 1.4650 1.4680 1.4710 0.0000 -0.4093 -0.7556 -1.0362 -1.2398 -1.3566 -1.3727 -1.2701 -1.0275 -0.6147 0.0000 0.0000 -0.0135 -0.0179 -0.0239 -0.0262 -0.0279 -0.0297 -0.0292 -0.0271 -0.0185 0.0000 0.0000 0.1784 0.3464 0.4995 0.6303 0.7289 0.7818 0.7682 0.6628 0.4244 0.0000 T=313K 0.0000 0.0604 0.1261 0.1982 0.2776 0.3654 0.4643 0.5739 0.6979 0.8391 1.0000 1121.0 1117.3 1113.3 1109.5 1105.6 1101.7 1097.8 1093.9 1090.0 1086.0 1082.0 1.4370 1.4410 1.4410 1.4450 1.4480 1.4520 1.4550 1.4580 1.4610 1.4640 1.4680 0.0000 -0.3975 -0.8205 -1.0871 -1.2983 -1.3945 -1.4147 -1.3136 -1.0707 -0.6552 0.0000 0.0000 -0.0111 -0.0150 -0.0209 -0.0230 -0.0246 -0.0262 -0.0260 -0.0236 -0.0139 0.0000 0.0000 0.1535 0.2980 0.4298 0.5423 0.6272 0.6727 0.6614 0.5703 0.3652 0.0000Table I: Experimentally measured values of densities (
m), refractive index (n
m), molar refraction deviation (
R
m),excess molar volume (
V
mE) and deviation in viscosity (
) with mole fraction x1 for DMSO + FA mixturex1
m
(kg/m3)
m
n
RmE m
V (103) (m3/mol)
(Pa-s) T=293K 0.0000 0.0940 953.0 966.3 1.4290 1.4330 0.0000 0.0006 0.0000 -0.0124 0.0000 -0.0362 0.1895 0.2862 0.3845 0.4832 0.5838 0.6862 0.7889 0.8943 1.0000 979.9 993.9 1008.3 1022.9 1038.1 1053.7 1069.6 1086.2 1103.0 1.4380 1.4420 1.4470 1.4510 1.4560 1.4610 1.4660 1.4720 1.4770 0.0018 0.0028 0.0034 0.0036 0.0035 0.0030 0.0020 0.0006 0.0000 -0.0205 -0.0264 -0.0301 -0.0316 -0.0307 -0.0273 -0.0215 -0.0130 0.0000 -0.0653 -0.0869 -0.1007 -0.1062 -0.1034 -0.0916 -0.0709 -0.0402 0.0000 T=303K 0.0000 0.0940 0.1895 0.2862 0.3845 0.4832 0.5838 0.6862 0.7889 0.8943 1.0000 943.0 956.2 969.8 983.8 998.2 1012.8 1028.0 1043.6 1059.5 1076.1 1093.0 1.4240 1.4280 1.4320 1.4370 1.4410 1.4460 1.4510 1.4550 1.4600 1.4660 1.4710 0.0000 0.0013 0.0024 0.0033 0.0038 0.0040 0.0040 0.0035 0.0027 0.0016 0.0000 0.0000 -0.0099 -0.0178 -0.0236 -0.0273 -0.0288 -0.0280 -0.0243 -0.0191 -0.0108 0.0000 0.0000 -0.0289 -0.0520 -0.0691 -0.0800 -0.0843 -0.0819 -0.0725 -0.0560 -0.0318 0.0000 T=313K 0.0000 0.0940 0.1895 0.2862 0.3845 0.4832 0.5838 0.6862 0.7889 0.8943 1.0000 934.0 947.0 960.6 974.4 988.7 1003.3 1018.3 1033.9 1049.7 1066.1 1083.0 1.4190 1.4230 1.4280 1.4320 1.4370 1.4420 1.4470 1.4520 1.4570 1.4620 1.4680 0.0000 0.0032 0.0056 0.0072 0.0082 0.0085 0.0082 0.0075 0.0059 0.0035 0.000 0.0000 -0.0027 -0.0116 -0.0183 -0.0225 -0.0243 -0.0236 -0.0202 -0.0141 -0.0051 0.0000 0.0000 -0.0103 -0.0185 -0.0246 -0.0284 -0.0299 -0.0290 -0.0256 -0.0198 -0.0112 0.0000
Table II: Experimentally measured values of densities (
m), refractive index (n
m), molar refraction deviation (
R
m),excess molar volume (
V
mE) and deviation in viscosity (
) with mole fraction x1 for DMSO + DMF mixtureParameters a1 a2 a3
)
(
Y
E
DMSO + FA T=293K
)
/
10
(
3m
3mol
V
mE
0.1408 - -0.0510 0.0975 - 0.0006
(Pa-s) 3.9513 0.0000-0.0047 0.0010 m
R
-5.1883-1.6728 0.0835 0.0047
T=303K )
/ 10 ( 3 3
mol m VE m -0.1244
-0.0018
-0.0300
0.0005
(Pa-s) 3.1440 -0.0041-0.0074 0.0004 m
R
-5.4373-1.5681
-0.3882 0.0039 T=313K
)
/
10
(
3m
3mol
V
Em
-0.1296
-0.0533
-0.0207
0.0005
(Pa-s) 2.7052 -0.0039-0.0067 0.0004 m
R
-5.6581-1.7764
-0.8653 0.0142 DMSO+DMF T=293K
)
/
10
(
3m
3mol
V
Em
-0.1238
-0.0034
-0.0257
0.0002
(Pa-s) -0.4271-0.0096
-0.0096
Page 410 www.ijiras.com | Email: [email protected]
m
R
0.0169 0.0014-0.0149
0.0002
T=303K
)
/
10
(
3m
3mol
V
mE
0.1178 - -0.0009 0.0037 0.0001
(Pa-s) -0.3396-0.0009 0.0045 0.0002
m
R
0.0160 0.0000 0.0016 0.0001T=313K )
/ 10
( 3m3 mol VmE
-0.0841
0.1101 0.1882 0.0001
(Pa-s) -0.1212-0.0011 0.0033 0.0001
m
R
0.0334 0.0007 0.0069 0.0001Table III: The values of co-efficient ai from Redlich Kister equation for
V
mE,
and
R
mand standard deviation)
(
Y
E
for binary mixturesDMSO+FA
Temp(K) L-L G D W H N Eyk
293
-0.0786
0.0027 0.0028 0.0028 0.0027
-0.0738
303
-0.1146
-0.0061
-0.0062
-0.0061
-0.0062
-0.1078
313
-0.1115
-0.0128
-0.0128
-0.0127
-0.0128
-0.1335
DMSO+D MF
293 0.0007 0.0080 0.0080 0.0082 0.0078 0.0078
303 0.0058 0.0058 0.0059 0.0060 0.0057 0.0057
313 0.0058 0.0059 0.0059 0.0061 0.0057 0.0057
Table IV: Average percentage deviation for the mixing rules of refractive index (
n
) for DMSO + FA and DMSO + DMFmixtures at varying temperatures
Critical values DMSO FA DMF
c
T
(K) 727.56 765.33 643.15SRK
0.2985 0.4061 0.3672*
V
0.2288 0.1305 0.2399DMSO + FA
Temperature 293K 303K 313K
APD 0.0311 0.0684 0.0676
DMSO + DMF
APD 0.0047 0.0042 0.0039
Table V: Critical values and estimated root mean square deviation of density from HBT model
V. DISCUSSION
In general, negative values of
R
m andV
mE and positive values of
indicate strong interaction in liquid mixtures which include charge transfer, dipole-dipole, dipole-induced-dipole interaction etc. where as positive values of
R
mandE m
V
and negative values of
are indicative of the weakening of interaction between component molecules.m
R
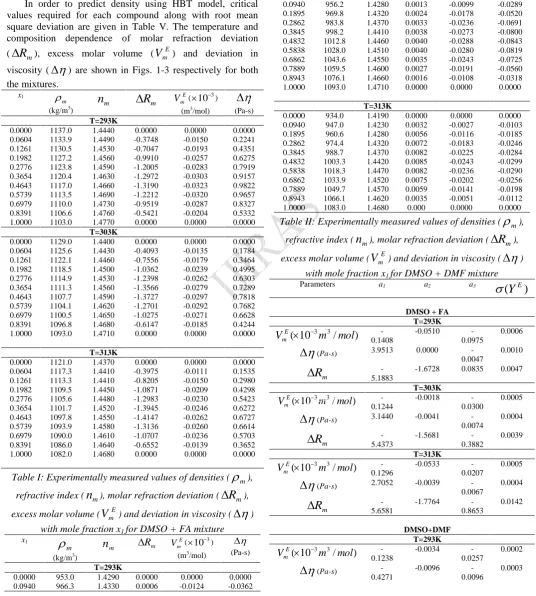
measures the strength of interactions in mixtures and is sensitive functions of wavelength, temperature and mixture composition 15). As can be seen from Figs. 1(a) and 1(b) thatm
R
values are negative for DMSO + FA mixture and positive for DMSO + DMF mixture. An increase in the negative
R
m values and decrease in positive
R
m values with temperature indicate that the molecular association becomes stronger with temperature. The negative and positive values of
R
m in DMSO + FA and DMSO + DMF mixtures respectively indicate that stronger interaction is taking place between DMSO and FA molecules than that between DMSO and DMF molecules. This may be due to the fact that the steric hindrance of the two methyl groups of DMF makes specific interaction weaker in DMSO + DMF mixture exhibiting positive values of
R
m which in turn indicates the predominance of long range dispersive forces.(a)
(b)
Figure 1: Molar refraction deviation (
R
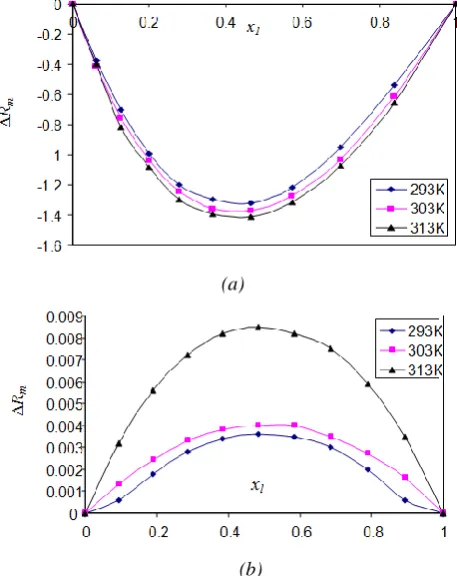
m) as a function ofPage 411 www.ijiras.com | Email: [email protected] The variation of
V
mE with mole fraction of DMSO forboth the mixtures at three temperatures are presented in Figs. (2a) and (2b). The sign and magnitude of
V
mE play vital role in assessing for the molecular rearrangement as a result of molecular interactions between component molecules in the liquid mixtures 16). The negativeV
mE values obtained for both the mixtures indicate the presence of strong intermolecular interaction between unlike molecules. Two effects mainly influence the negative values ofV
mE. The negative values ofE m
V
over the entire mole fraction for both the mixture may be attributed mainly to the association through intermolecular hydrogen bonds between the oxygen atom of sulfoxide group and the hydrogen atom of amide group. Another effect, which would give negative contribution to the excess volumes, is the differences in molecular sizes between the two components in binary mixtures. The difference in free volumes between two components in binary mixtures would facilitate the penetration of one component into the other. The decrease in negative values ofV
mE for both the mixture with increase in temperature indicates the decrease in strength of molecular interaction with temperature.(a)
(b)
Figure 2: Excess molar volume (
V
mE) as a function of mole fraction of DMSO (x
1) for (a) DMSO + FA and (b) DMSO +DMF mixtures.
Figure 3 illustrates that the deviation in viscosity (
) are positive in DMSO + FA mixture and decreases with increase in temperature while
is negative in DMSO + DMF mixture and decreases with increase in temperature. Positive contribution to
values for DMSO + FA mixture suggest the presence of strong specific dipole-dipoleinteraction between unlike molecules. The negative values of
in case of DMSO + DMF mixture can be attributed to the fact that mixing of DMSO with DMF will induce the partial dissociation and loosening of dipolar interaction between DMSO molecules. Thus, the apparent intermolecular interaction in DMSO + DMF mixture may be arising from the weak dipole induced type forces resulting from the polarization of DMSO molecules by the dipoles of the surrounding DMF molecules. This effect can be superimposed upon dipole-dipole interaction and lead to a slight increase in attraction giving less negative
values at higher temperatures. It can also be seen from Fig. 3 that specific interaction arising from induced dipole-dipole type force tends to increase with increasing temperature. Similar trends in
R
m,V
mE and
values have also been reported earlier 9,17,18).Figure 3: Deviation in viscosity (
) as a function of mole fraction of DMSO (x1) for (DMSO + FA) mixture (Mix 1) and(DMSO + DMF) mixture (Mix 2)
Further, theoretically estimated values of refractive index in terms of average percentage deviation (APD) using six mixing rules as described earlier 10) are listed in Table IV for both the mixtures. All the mixing rules show good agreement between experimental and theoretically evaluated refractive index, Glad-Stone Dale (GD), Wiener’s (W), Heller’s (H), and Newton’s (Nn) relations provide an excellent agreement between experimental and estimated refractive indices, with maximum APD of -0.0128 and minimum APD of -0.0027 in case of DMSO + FA mixture. However Lorentz-Lorenz (L-L) and Eykman’s (Eyk) relations give maximum APD of -0.1115 and -0.1335 respectively for this mixture. Also the values of APD obtained from Wiener’s and Heller’s relations are very close for both the mixtures as expected since Heller’s equation is simply a limiting form of the Wiener’s equation and this trend is consistent with the observations reported earlier 19). In the case of DMSO + DMF mixture, all the six relations exhibit an excellent agreement between the experimental and predicted refractive indices.
Page 412 www.ijiras.com | Email: [email protected] the most accurate and most general model for prediction of
mixing densities of the two binary mixtures.
VI. CONCLUSION
Results obtained in this paper seem to indicate that the stable inter molecular complexes are formed in case DMSO + FA mixture. However dipole-dipole interaction and dispersive forces seem to be responsible in DMSO + DMF mixture. Comparison of experimental and predicted values of refractive index and density in terms of APD / root mean square deviation for both the mixtures show the suitability of mixing rules and HBT model for representing the mixing refractive indices and densities respectively.
ACKNOWLEDGMENT
The authors are thankful to Prof. J.D. Pandey, Emeritus Fellow UGC, Former Head, Chemistry Department, Allahabad University for continuous support and valuable discussions.
REFERENCES
[1] Chen, H.W. (2006). Densities, Viscosities and refractive indices for binary and ternary mixtures of diisopropyl ether, ethanol and 2, 2, 4 trimethylpenatane. Journal of Chem.Eng, Data, 51, 261-267.
[2] Ali, A. (2002). Molecular interaction study in binary mixture of Dimethylsulphoxide with 1, 2-dichloroethane and 1, 1,2,2-tetrachloroethane at 303K. Indian Journal of. Physics. 76B No.1, 23.
[3] Ansari, N. (2014). Refrectometric studies on molecular interaction in six binary liquid mixtures. Open journal of Physical chemistry,Vol 4,No1,1-5,
[4] Shanmuga priya, C. (2010). Molecular interaction studies in liquid mixtures using ultrasonic technique. International Journal of advanced science and technology, 18, 59 -73.
[5] Gupta, M. (2003).Optical volumetric study of molecular interaction in binary mixtures of tetrahydrofuron with 1-propanol and 2-1-propanol. Journal of Physics Chem. Liq. 41, 575.
[6] Pandey, J. D. (2006).Refrectometric and dielectric studies of binary liquid mixtures at different temperatures. Indian Journal. Chem.45A, 653.
[7] Rathnam, M. V. (2005). Viscosity, Density and refractive index of some (ester + hydrocarbon) binary mixture at 303.15 and 313.15K. Journal of. Chemical. Eng. Data, 50, 325
[8] Ilookhani, H. (2005). Viscosities and excess molar volumes of ternary system toluene (1) + cyclohexane (2) + pentane (3) at 298.15K. Journal of. Chemical. Eng Data, 50, 1928
[9] Francesconi, R.. (2005). Excess enthalpies, Heat capacities, Densities, Viscocities and Refractive indices of dimethylsulfoxide + three arylalchohol at 308.15K and atmospheric pressure. Journal of. Chemical Eng. Data, 50, 1932.
[10] Bhatia, S. C. (2002).Refractive indices of binary liquid mixture of (decane+ benzene) and (Hexadecane + Benzene, or + Hexane) at 303.15, 308.15 and 313.15K, Indian Journal of. Chem., 41A, 266.
[11] Hankinson, R. W. (1979).A new correlation for saturated densities of liquids and their mixtures, AIchE Journal. 25, 653-663
[12] Perrin, D. D. (1988). Purification of Laboratory Chemicals. Pergamon Press, Oxford, 3rd ed.
[13] Wahab, M. A. (2002). Volumetric behavior of binary liquid mixtures at temperature of 303.15K. Bull Korean Chem. Soc., 23, No 7, 953.
[14] Redlich, O. (1948) Thermodynamics of nonelectrolyte solutions-x-y-trelations in binary system. Indian Eng. Chem, 40, 345.
[15] Aminabhavi, T. M. (1993). Volumetric, acoustic, optical and viscometric properties of binary mixtures of 2- methoxyethanol with aliphatic alcohols (C1-C8). Indian Eng Chem Res, 32,931.
[16] Ali, A. (2002). Ultrasonic, volumetric and viscometric study of molecular interaction in binary mixtures of 2, 3,4-trimethyl pentane with n-hexane and cyclohexane at 308 K. Indian journal of applied physics ,76B , No.5, 661. [17] Wankhede, D. S. (2005). Excess molar volumes and viscosity deviation of binary mixtures of 2, 4, 6 Trimethyl-1, 3, 5-Trioxane + ethanol, propanol and 1-butanol at 298.15, 303.15 and 308.15K. Journal of chemical engineering data, 50(30),969-972
[18] Pandharinath, S. N. (2005). Volumetric properties of binary mixtures. Journal of chemical engineering data, 50, 455.