Estimation of Surface Runoff For Ahmedabad
Urban Area using SCS-CN Method and GIS
Chirag S. Bhura Dr. N. P. Singh
M.E Student Associate Professor
L.D.C.E, Ahmedabad-380015, Gujarat, India L.D.C.E, Ahmedabad-380015, Gujarat, India
P. R. Mori Dr. Indra Prakash
M.E Student Faculty
L.D.C.E, Ahmedabad-380015, Gujarat, India BISAG, Gandhinagar, Gujarat, India
Khalid Mehmood
Project Manager
BISAG, Gandhinagar, Gujarat, India
Abstract
Soil conservation Service (SCS) model was used for the estimation of surface runoff for Ahmedabad urban area. Sub-watershed level areas covering Ahmedabad urban area are considered for the estimation of runoff. The daily rainfall data of 4 rain gauge stations (1988-2012) is collected. Thiesson polygon method is used for finding average distribution of rainfall in whole study area. Landuse/Landcover map was prepared from the satellite image and soil map of study area was prepared using GIS. Landuse/Landcover map and Soil map are used to estimate curve number for SCS method. Antecedent Moisture Conditions (AMC-I, AMC-II and AMC-III) are also used for selecting suitable curve number in study area. SCS-CN method was used to determine the runoff depth distribution using remote sensing and Geographic Information System.
Keywords: AMC-I, AMC-II and AMC-III), SCS
________________________________________________________________________________________________________
I.
INTRODUCTION
Runoff corresponding to rainfall is an important characteristic of a watershed. Remote sensing techniques are more reliable and faster method for data collection than any other conventional techniques. Satellite images are useful for preparation of landuse/landcover map, which is essential parameter in SCS runoff estimation. Use of GIS as a spatial data management and an analysis tool is effective for hydrological studies. In this study SCS-CN modified for Indian condition has been used for generation of runoff in the study area. The Soil Conservation Service (SCS) runoff model is useful for estimating runoff depths for different antecedent moisture condition (AMC).
II.
STUDY AREA
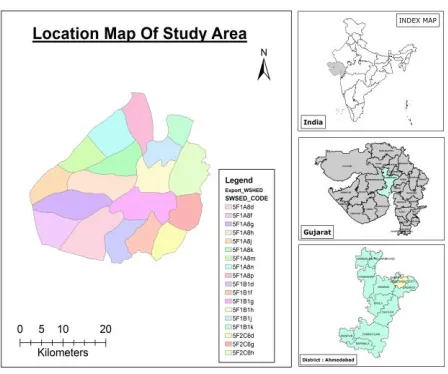
Urban area of Ahmedabad city covered by Sub-watershed boundary is selected for the study area in Gujarat, India. Ahmedabad city lies between 22˚ 55’ and 23˚ 08’ North Latitude and 72˚ 30’ and 72˚ 42’ East Longitude.
Data Source: A.
Fig. 1: Location Map of Study Area
III.
METHODOLOGY
Fig. 2: Methodology for Rainfall-Runoff Estimation
SCS Curve Number Method: A.
Soil Conservation Model is distributed watershed modelling. The soil conservation service model developed by United States Department of Agriculture (USDA) computes direct runoff through an empirical equation that requires the rainfall and a watershed coefficient as inputs (T.R. Nayak et.al.2003). The general equation for the SCS curve number method is as follows:
(1)
Where, F, actual retention (mm): S, potential maximum retention (mm): Q, actual direct runoff (mm): P total rainfall (mm): I initial abstractions (mm).
From the continuity principle,
(2)
The value of the initial abstraction Ia to be approximately equal to 30% of the watershed storage S, as per Handbook of
Hydrology as follows (Kumar et al., 1991).
(3)
Solving equation 1 and 2 simultaneously,
(5)
∑( )
(6)
Where CNw is the weighted curve number; CNi is the curve number from 1 to any number N;
Ai is the area with curve number CNi; and A the total area of the watershed.
The parameter CN, having a range of values between 0 and 100 is called the curve number. In this method, a curve number (CN) is assigned to each watershed or portion of watershed based on soil type, landuse and antecedent moisture condition (Hydrology Handbook, 1996).
Antecedent Moisture Condition (AMC): B.
Antecedent moisture condition refers to the moisture content present in the soil at the beginning of the rainfall-runoff event under consideration. It is well known that initial abstraction and infiltration are governed by AMC.
Table - 1
Classification of Antecedent Moisture Condition
AMC Type
Total Rain in Previous 5 days
Dormant Season Growing Season
I Less than 13 mm Less than 36 mm
II 13 to 28 mm 36 to 53 mm
III More than 28 mm More than 53 mm
The conversion of CNII to other two AMC conditions can be made through the use of following correlation equations. For AMC-I:
(7) For AMC-III,
(8)
Thiesson Polygon: C.
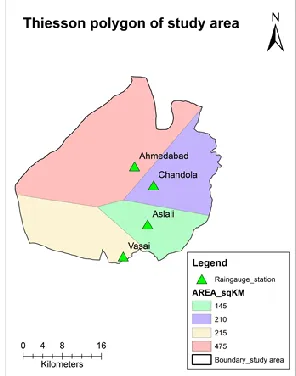
Daily rainfall data for 4 rain gauge station of 25 years (1988-2012) is collected from the state water data center. Thiesson polygon method is used for finding average distribution of rainfall in whole study area. Thiesson polygon is prepared using ArcGIS 9.3.
Hydrologic Soil Groups: D.
In the determination of CN, the hydrological soil classification is adopted. Here, soils are classified in to four classes A, B, C, and D based upon the infiltration, texture, structure and degree of swelling when saturated. Soil groups are formed by finding the soil group classification for soil available in study area. In the present study, areas under different soil group were found 32% and 68% for B and C group of soil, respectively. The figure 4 shows the HSG map of study area.
Fig. 4: Hydrological Soil Group Map of Study Area
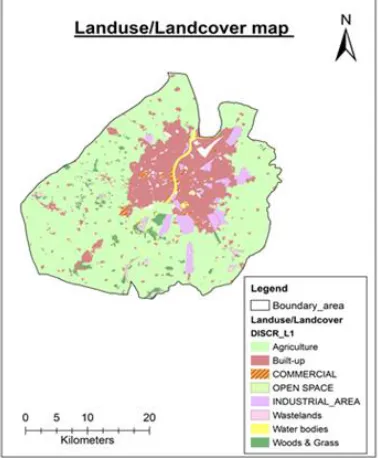
Landuse/ Landcover Map: E.
Landuse/landcover map is prepared by mapping form the satellite map in GIS. Landuse map is prepared using visual interpretation technique from satellite image.
Weighted Curve Number: F.
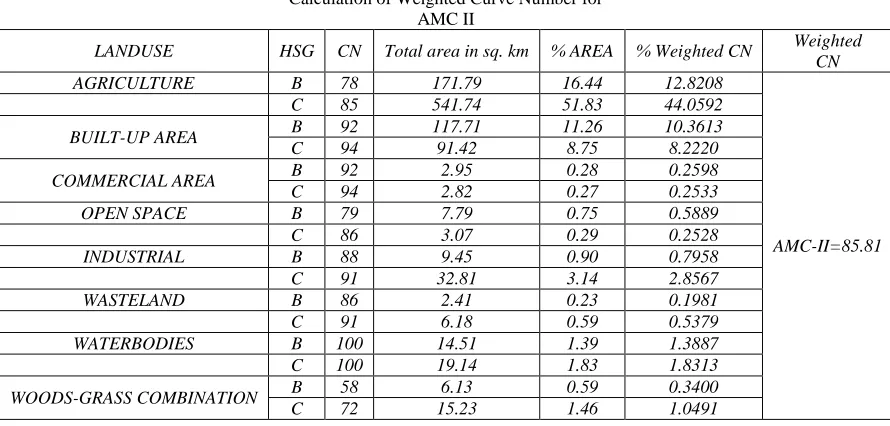
The CN value for each soil hydrologic group and corresponding land use classes are presented in Table 2 Weighted curve number for the area was calculated and the value of Weighted CN is 85.81 (Taking CN=86) for AMC-II, CN for AMC-I=73 and AMC-III=94 are calculated from equation (7) and (8).
Table - 2
Calculation of Weighted Curve Number for AMC II
LANDUSE HSG CN Total area in sq. km % AREA % Weighted CN Weighted CN
AGRICULTURE B 78 171.79 16.44 12.8208
AMC-II=85.81
C 85 541.74 51.83 44.0592
BUILT-UP AREA B 92 117.71 11.26 10.3613
C 94 91.42 8.75 8.2220
COMMERCIAL AREA B 92 2.95 0.28 0.2598
C 94 2.82 0.27 0.2533
OPEN SPACE B 79 7.79 0.75 0.5889
C 86 3.07 0.29 0.2528
INDUSTRIAL B 88 9.45 0.90 0.7958
C 91 32.81 3.14 2.8567
WASTELAND B 86 2.41 0.23 0.1981
C 91 6.18 0.59 0.5379
WATERBODIES B 100 14.51 1.39 1.3887
C 100 19.14 1.83 1.8313
WOODS-GRASS COMBINATION B 58 6.13 0.59 0.3400
C 72 15.23 1.46 1.0491
IV.
RESULT
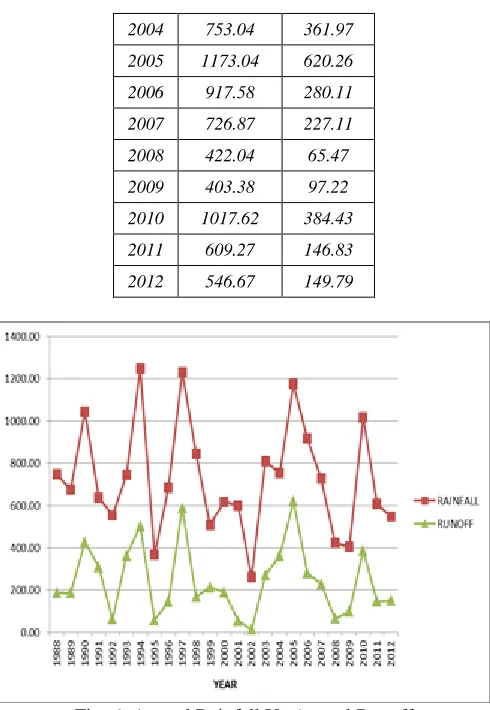
Table - 3
Annual Rainfall - Runoff for Study Area
YEAR RAINFALL RUNOFF
mm mm
1988 748.99 186.00
1989 674.43 184.38
1990 1044.41 424.95
1991 638.71 309.38
1992 553.88 62.64
1993 745.42 362.15
1994 1246.66 501.65
1995 365.89 57.89
1996 684.22 144.10
1997 1230.29 589.26
1998 845.09 166.94
1999 507.16 212.54
2000 618.68 190.07
2001 600.84 55.33
2004 753.04 361.97
2005 1173.04 620.26
2006 917.58 280.11
2007 726.87 227.11
2008 422.04 65.47
2009 403.38 97.22
2010 1017.62 384.43
2011 609.27 146.83
2012 546.67 149.79
Fig. 6: Annual Rainfall Vs Annual Runoff
V.
CONCLUSION
GIS is an effective tool for preparation of input parameters of SCS-CN model and it’s also helpful in presentation of input parameters in form of various thematic maps.
Average runoff was calculated from the average rainfall using SCS-CN method integrated with remote sensing and GIS.
ACKNOWLEDGEMENTS
The authors are thankful to the State Water Data Centre (SWDC), Gandhinagar for providing the rainfall data. The authors are also thankful to the Director and Faculty members of Bhaskaracharya Institute for Space Application and Geo-Informatics (BISAG), Gandhinagar for their support & guidance provided for this study.
REFERENCES
[1] Abhijit M.Zende, Nagarajan R, Atal K.R., “Analysis of Surface runoff from Yerala River Basin using SCS-CN and GIS”, International journal of Geomatics and Geosciences, Vol 4,No 3,2014.
[2] Arun W. Dhawale, “Runoff Estimation for Darewadi Watershed Using RS and GIS” International journal of Recent Technology and Engineering, Volume-1, Issue-6,p 46
[3] K Subramanya, “Engineering Hydrology” Ministry of Agriculture, Govt. of India,” Handbook of Hydrology”, New Delhi, 1972
[4] S. Gajbhiye, S.K. Mishra, “Application of NRSC-SCS Curve Number Model in Runoff Estimation Using RS & GIS” IEEE-International Conference on Advances in Engineering Science and Management-2012 pp 346-352
[5] Samah Al-Jabari, Majed Abu Sharakh and Ziad Al-Mimi, “ESTIMATION OF RUNOFF FOR AGRICULTURE WATERSHED USING SCS CURVE NUMBER AND GIS”, Thirteenth International Water Technology Conference, Hurghada, Egypt, p 1213
[6] U. M. SHAMSI, “GIS TOOLS FOR WATER, WASTEWATER AND STORMWATER SYSTEM”, ASCE publication