ISSN (e): 2250-3021, ISSN (p): 2278-8719
Vol. 08, Issue 12 (December. 2018), ||V (IV) || PP 01-07
Optimization of Inventory Control for Supply Chain
Management using Novel Techniques of Regression: a Case Study
Vinod Kumar Dhull
1*, Praveen Pande
2, Dharamvir Mangal
31*,2 Department of Mechanical Engineering, Teerthankar Mahaveer University, Moradabad, U.P., India 3
Department of Mechanical Engineering, Gautam Buddha University, Noida U.P., India Corresponding Author:Vinod Kumar Dhull
Abstract:
This research paper presents the optimization of inventory control for supply chain management (SCM) by using techniques of regression. Parameters like blooms quantity (mt), ordering cost per order (OC),carrying cost (CC), and purchase order per unit are considered for the analysis. Common used technique for
calculation of inventory control parameters is the economic order quantity (EOQ) and the same parameters have been predicted by the different techniques of regression. Comparison is made between standard EOQ model, and values predicted by different regression techniques. Analysis reveals that the regression has shown strong correlation with the standard values for predicting the inventory control parameters and the accuracy varies between 96.65% to 99.85%.
Keywords:
Inventory Control, Supply Chain Management, Regression Analysis, Economic Order Quantity Model.--- --- Date of Submission: 14-12-2018 Date of acceptance: 29-12-2018 --- ---
I.
INTRODUCTION
SCM practices as a set of actions undertaken in a group to support effective management system which includes supply and material management issues, information technology, operations, customer service and information sharing [1,2]. Components such as inventory management, technology, cost, competitiveness and external regulations need to be managed efficiently to attain the business goals of each members of SCM that leads to value formation to end customers. Organizations are parts of supply chains that link the process of acquiring raw materials, manufacturing, assemblage and delivery to end customer [3]. Success of company depend on its internal performance its collaborating partners. Competency of producing business associations with suppliers, customers and other strategic partners is based on trust and longtime assurance that becomes a vital competitive parameter [4]. Enhancement of vertical incorporation requires increased coordination of wealth and activities, which in turn results in greater complication in management and control. Increasingly, supply chain management is being expected as the management of key business processes across the system of organizations that practices supply chain. On the other hand many organizations have recognizable benefits of SCM. Most of the organizations are unclear about the processes and sub-processes to be utilized for better SCM and activities to be controlled to interrelate with the traditional methods [5]. To maintain competitive advantage over the rivals the organizations pay continuously attention in responding to the customer demand and focuses on material, information and cash flows from vendors to customers or vice-versa [6,7]. Hence, SCM is considered as the most popular operations strategic tool for improving organizational competitiveness in the 21stcentury [8]. SCM is an integral process in which manufacturer strategically collaborates with its supply chain partners and collaboratively manages intra and inters organizational activities to achieve effective and efficient flow of products, money and information to maximize the value addition to customer [9]. In SCM all parties which are directly or indirectly involves in fulfilling the customer’s demand and hence the key issue of SCM is customer focus and satisfaction [10]. From the customer’s point of view the quality of product, value for money & post sales facilities are key features and hence the success or failure of SCM is ultimately determined in the marketplace by the end user i.e. consumer [11]. Demanding competition in today's markets, introduction of products with short life cycles, and the discriminating expectations of customers have forced organizations to invest and focus attention on SCM as system which is affected by the globally competitive environment making SCM an inevitable challenge to most of the organization [12, 13].
three sectors which are agriculture, manufacturing and service. Inventories contribute to second largest asset category for manufacturing companies, next to plant and equipment with a share of 15% to 30% of total cost. Given substantial investment in inventories, the importance of inventory management cannot be overemphasized [16, 17].
Inventory management and SCM are the inevitable part of any business operations and application of different software for inventory management has made significant changes with the expansion of technology and availability of process [18]. The performance of a SCM can be enhanced by judging its ability to remain market-sensitive without losing the integration of chain. Other challenges in designing and analyzing a supply chain is its processes which governed by its strategic attributes. [19,20]. Along with the emergence of business era that embraces change as one of the major characteristics, manufacturing success and survival are becoming more and more difficult to ensure thus there is need of addressing the market proactively [21, 22]. EOQ is well-known technique used by engineers and managers in engineering economics, industrial engineering, operational and financial courses. EOQ formulas have practical and exact applications in defining concepts of cost tradeoffs and inventory control [23, 24, and 25].
EOQ model is considered as the exchange between ordering cost and storage cost for selecting the quantity to be used for restoring item inventories. This model can also be defined as the Cost Minimizing Order quantity [26]. EOQ helps in identifying optimal quantity of orders that minimizes total variable costs which is required to order and hold inventory. This is well known EOQ model as it recognizes the most profitable size of order to be place [27]. This model is one of the oldest classical production scheduling models which is used in the current study. The present study is intended to determine the industry practice in inventory management and to evaluate management performance in this regard. In order to evaluate the performance of the inventory management referring the annual reports of the organization the required data has been collected. This research attempts to fill the gap between manual calculations of inventory control by software analysis using techniques of regression.
II.
RESEARCH METHODOLOGY
The data was provided by Indo Auto Tech Limited, Faridabad to calculate EOQ for single product. EOQ model has been used to minimize inventory and find the optimal order quantity with an objective of minimizing total cost associated with single product. Additional data was collected for research method to calculate the EOQ, ordering cost (CO), number of orders (N), total annual cost (TC), carrying cost (CC), order
size (S) and average inventory (IA) per year for single product. Provided data was utilized to calculate the above
parameters to selected the optimum combination among them in terms of cost reduction. Average Inventory per year was calculated in order to compare the estimated cost from current method applied by the company and the research method. Common decisions faced by operations managers is “how much to order” or “how many times to order” to satisfy external or internal requirements for item. Mostly, this decision is made with little knowledge related to cost. Figure 1 shows the flow chart of methodology applied for obtaining optimum solution
Following assumptions have been used in adopted model:
Demand is constant and continuous over the time.
The lead-time is constant.
There is no limit on order size to stores capacity.
The cost of placing an order is independent of size of order.
This model is the easiest way for calculating Inventory. EOQ may be calculated as:
EOQ = 2AOC/CO (1)
𝐶𝑂 = 𝑂𝐶∗ 𝑁 (2)
𝑁 = 𝐴 𝐸𝑂𝑄 (3)
𝑇𝐶 = 𝐶𝐶+ 𝐶𝑂 (4)
𝐶𝐶 = 𝑆 ∗ 𝐼𝐴 (5)
𝑆 = 𝐴/𝑁 (6)
𝐼𝐴= 𝑆/2 (7)
Equations (1) to (7) have been implemented for calculating the EOQ, CC,CO,TC, IAN, and S respectively.
Table 1: Actual values received as input parameters from Indo AutoTech Limited, Faridabad
Items Units 2017 2016 2015 2014 2013
Billets/Blooms Qty mt 134538 106066 123596 28889 26987
Ordering Cost per Order INR 2600 2400 2200 2000 1800
Carrying Cost % 10 10 10 10 10
Purchase price per unit INR 460 440 420 400 380
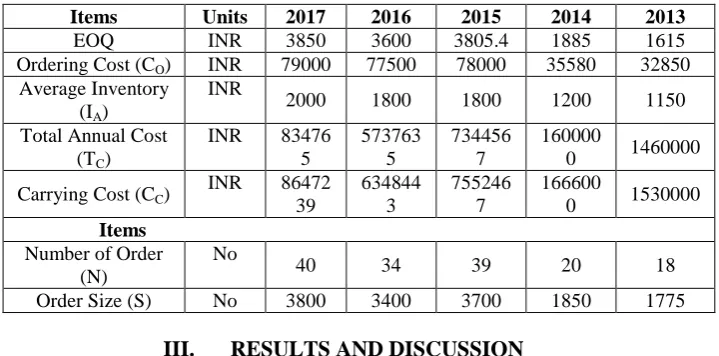
Table 2: Actual values received from Indo Auto Tech Limited, Faridabad as output parameters for inventory control
Items Units 2017 2016 2015 2014 2013
EOQ INR 3850 3600 3805.4 1885 1615
Ordering Cost (CO) INR 79000 77500 78000 35580 32850
Average Inventory (IA)
INR
2000 1800 1800 1200 1150
Total Annual Cost (TC)
INR 83476
5 573763 5 734456 7 160000
0 1460000
Carrying Cost (CC)
INR 86472
39 634844 3 755246 7 166600
0 1530000
Items Number of Order
(N)
No
40 34 39 20 18
Order Size (S) No 3800 3400 3700 1850 1775
III.
RESULTS AND DISCUSSION
Statistics plays an important role in business, because it provides the quantitative basis for arriving at decisions in all matters. Moreover, without education of statistics, business management is incomplete. According to Danish physicist and Nobel laureate, Niels Bohr, nothing exists until it is experimental. This is very much relevant in the present times for creation of knowledge, just as steel is the raw material for manufacturing automobiles. The use of computers in teaching statistics can make an impact in two ways. First, it can affect the amount and rate of learning of statistics. Second, it can affect one’s attitude towards computers such as SPSS, SYSTAT, SAS, MINITAB, etc. The regression analysis is the statistical technique that identifies the relationship between two or more quantitative variables: a dependent variable, whose value is to be predicted, and an independent or explanatory variable (or variables), which is known. The goal of regression analysis is to determine the values of parameters for a function that cause the function to best fit a set of data observations that you provide. A simple regression analysis can show that the relation an independent variable X and a dependent variable Y is linear, using the simple linear regression equation: Y = a + b X (Where a and b are constants).Multiple regressions will provide an equation that predicts one variable from two or more independent variables: Y = a + bX1 + cX2 + dX3 (Where a, b and c are constants).
Following correlations are given by regression analysis:
EOQ (Rs.) = 963.156 + 0.0202768 Billets/Blooms Qty (mt) + 0.129256 Ordering Cost per Order (INR)
(8)
Ordering Cost (INR) = 16846.5 + 0.4375 Billets/Blooms Qty (mt) + 3.17403 Ordering Cost per Order (INR)
(9)
Number of Order (No.) = 15.8428 + 0.000208187 Billets/Blooms Qty (mt) - 0.00142441 Ordering Cost per Order (INRv)
(10)
Total Annual Cost (Rs.) = -302368 + 61.1311 Billets/Blooms Qty (mt) + 29.9195 Ordering Cost per Order (INR)
(11)
Carrying Cost (Rs.) = -1.15019e+006 + 61.0951 Billets/Blooms Qty (mt) + 530.046 Ordering Cost per Order (INR)
(12)
Order Size (No.) = 1439.01 + 0.0197649 Billets/Blooms Qty (mt) - 0.0884378 Ordering Cost per Order (INR)
(13)
Average Inventory (Rs.) = 374.105 + 0.00553327 Billets/Blooms Qty (mt) + 0.341371 Ordering Cost per Order (INR)
(14)
Figure 2 (a-g): Financial year versus various inventory control parameters
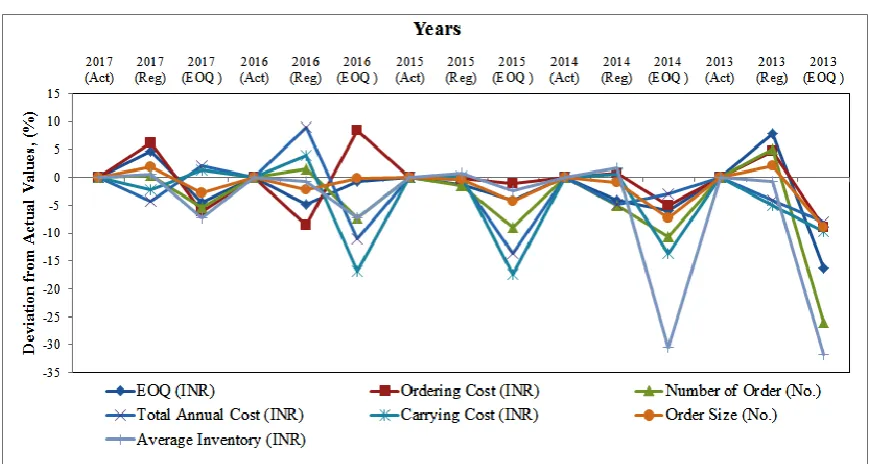
Figure3. Deviation in percentage between Actual, EOQ and Regression Correlation
IV.
CONCLUSIONS
REFERENCES
[1]. Bowersox, D. J., Closs, D. J., & Cooper, M. B. (2002). Supply chain logistics management (Vol. 2). New York, NY: McGraw-Hill.
[2]. Brown, R. G. (1959). Statistical forecasting for inventory control. McGraw/Hill.
[3]. Cadavid, D. C. U., & Zuluaga, C. C. (2011). A framework for decision support system in inventory
management area. In Ninth LACCEI Latin American and Caribbean Conf (pp. 3-5).
[4]. Cannella, S., Framinan, J. M., Bruccoleri, M., Barbosa-Póvoa, A. P., & Relvas, S. (2015). The effect of inventory record inaccuracy in information exchange supply chains. European Journal of Operational Research, 243(1), 120-129.
[5]. Cannon, A. R. (2008). Inventory improvement and financial performance. International Journal of Production Economics, 115(2), 581-593.
[6]. Chalotra, V. (2013). Inventory management and small firms growth: An analytical study in supply chain. Vision, 17(3), 213-222.
[7]. Chan, S. W., Tasmin, R., Aziati, A. N., Rasi, R. Z., Ismail, F. B., & Yaw, L. P. (2017, August). Factors Influencing the Effectiveness of Inventory Management in Manufacturing SMEs. In IOP Conference Series: Materials Science and Engineering (Vol. 226, No. 1, p. 012024). IOP Publishing.
[8]. Choi, T. Y., & Hong, Y. (2002). Unveiling the structure of supply networks: case studies in Honda, Acura, and DaimlerChrysler. Journal of Operations Management, 20(5), 469-493.
[9]. Davis, R. K. (1963). Inventory Control: Theory and Practice.
[10]. De Toni, A. F., & Zamolo, E. (2005). From a traditional replenishment system to vendor-managed inventory: A case study from the household electrical appliances sector. International Journal of Production Economics, 96(1), 63-79.
[11]. Dhoka, D., & Choudary, Y. L. (2013). ABC Classification for Inventory Optimization. IOSR Journal of Business and Management (IOSR-JBM), 15(1), 38-41.
[12]. Eroglu, C., & Hofer, C. (2011). Lean, leaner, too lean? The inventory-performance link revisited. Journal of Operations Management, 29(4), 356-369.
[13]. Fabrycky, W. J., & Banks, J. (1967). Procurement and inventory systems: theory and analysis. Reinhold. [14]. Gupta, D. P., Gopalakrishnan, B., Chaudhari, S. A., & Jalali, S. (2011). Development of an integrated
model for process planning and parameter selection for machining processes. International journal of production research, 49(21), 6301-6319.
[15]. Hollier, R. H., & Vrat, P. (1978). A proposal for classification of inventory systems. Omega, 6(3), 277-279.
[16]. Jonsson, P., & Mattsson, S. A. (2008). Inventory management practices and their implications on perceived planning performance. International journal of production research, 46(7), 1787-1812.
[17]. Kabajeh, M. A. M., Al Nu’aimat, S. M. A., & Dahmash, F. N. (2012). The relationship between the
ROA, ROE and ROI ratios with Jordanian insurance public companies market share prices. International
Journal of Humanities and Social Science, 2(11), 115-120.
[18]. Sahari, S., Tinggi, M., & Kadri, N. (2012). Inventory management in Malaysian construction firms: impact on performance. SIU Journal of Management, 2(1), 59-72.
[19]. Shafi, M. (2014). Management of inventories in textile industry: a cross country research
review. Singaporean Journal of Business, Economics and Management Studies, 51(1121), 1-15.
[20]. Shin, S., Ennis, K. L., & Spurlin, W. P. (2015). Effect of inventory management efficiency on
profitability: Current evidence from the US manufacturing industry. Journal of Economics and Economic
Education Research, 16(1), 98.
[21]. Stephen, A. G., & GUPTE, J. Contemporary Inventory Management Techniques: A Conceptual
Investigation.
[22]. Stock, J. R., Boyer, S. L., & Harmon, T. (2010). Research opportunities in supply chain management. Journal of the Academy of Marketing Science, 38(1), 32-41.
[23]. Suraidi, N. N., Rahman, N. A. A., & Suhaimi, R. D. S. R. A Study on Relationship between Inventory Management and Company Performances: A Case Study of Textile Chain Store.
[24]. Tom Jose, V., Jayakumar, A., & Sijo, M. T. (2013). Analysis of inventory control techniques; A comparative study. International Journal of Scientific and Research Publications, 3(3), 1.
[25]. Toomey, J. W. (2000). Inventory management: principles, concepts and techniques (Vol. 12). Springer Science & Business Media.
[26]. Van Donk, D. P., & Van Der Vaart, T. (2005). A case of shared resources, uncertainty and supply chain integration in the process industry. International Journal of Production Economics, 96(1), 97-108. [27]. Vrat, P. (2014). Basic concepts in inventory management. In Materials Management (pp. 21-36).
International organization of Scientific Research
7 | Page
ACKNOWLEDGEMENT
We are greatly thankful to IndoAuto Tech Limited Faridabad and Mr.SurenderSheoran (Operation Head) for providing data and technical Support.
Abbreviations Full forms
Act Actual Values
Reg Regression Values
Res Research Values
% Percentage
A Total units required
Qt In-transit Inventory
Qb Surplus inventory
Tc Total Annual Cost
Cc Carrying Cost
Co Ordering Cost
Oc Cost per Order
S Order Size
N Number of Orders for the year
sIA Average Inventory
mt Metric Ton
INR Indian Rupees