Available online
www.ijpras.com
International Journal of Pharmaceutical Research & Allied Sciences, 2016, 5(1):58
-
64
Research Article
ISSN : 2277
-
3657
CODEN(USA) : IJPRPM
Method Development of Antihypertensive Agent Using Official Dissolution
Media
Ajit C. Jadhav
#, Sadhana R. Shahi*, Imran Tadvi and Santosh D. Borde
*Department of Pharmaceutics, Government College of Pharmacy, Opp. Govt. Polytechnic, Osmanpura, Aurangabad-431005, Maharashtra, India.
#Email [email protected] Subject-Analytical Chemistry
_____________________________________________________________________________________________
ABSTRACT
A simple, rapid, precise, and economical spectrophotometric method has been developed for the quantitative estimation of Losartan Potassium in Bulk and pharmaceutical formulation. The simple, precise, economical and rapid method was developed and validated for the estimation of Losartan Potassium using Distilled Water as a solvent. The stock solution of Losartan Potassium was prepared and subsequent suitable dilution was prepared in Distilled water to obtained standard curve. The standard solution of Losartan Potassium shows absorption maxima at 205nm. The drug obeyed beer lambert’s law in the concentration range of 2-10µg/ mL with regression 0.9997 at 205 nm. The overall % recovery was found to be 99.99% which reflects that the method is free from interference of the impurities and other additives used in formulation. The low value of % RSD was indicative of accuracy and reproducibility of the method. The %RSD for interday and intraday precision was found to be 0.5421 and 0.7747, respectively which is <2% hence proved that method is precise. The results of analysis have been validated as per ICH guidelines. The developed method can be adopted in routine analysis of Losartan Potassium in tablet dosage form as well bulk dosage form.
Key words: Losartan Potassium, UV Spectrophotometry, method development, validation, ICH guidelines,
Distilled water
_____________________________________________________________________________________________
INTRODUCTION
Dissolution is an official test routinely used in Research and Development (R & D) Laboratories and Quality Control (QC) for the evaluation of pharmaceutical products. The purpose of in vitro dissolution studies in QC is to check batch to batch consistency and detection of manufacturing deviation while in R and D the focus is to provide some predictive estimate of the drug release in respect to the in vivo performance of a drug product. [1]
Losartan potassium is chemically 2-butyl-4-chloro- 1-[p-(o-1H-tetrazol-5-yl-phenyl) benzyl]-imidazole-5-Methanol mono potassium salt. [2]
Ajit C. Jadhav et al Int. J. Pharm. Res. Allied Sci., 2016, 5(1):58-64
_____________________________________________________________________________________
As per literature investigation Several analytical methods have been applied to the analysis of Losartan potassium in pharmaceutical products that make use of high performance thin layer chromatography (HPTLC)and RP-HPLC. [4-5], capillary electrophoresis, capillary electro chromatography[6], and spectrophotometry. [7-8]
All these reported methods either took a long time for analysis or employ mobile phases with pH adjustment of buffer solutions which is tedious and not suitable, especially for routine testing of quality control samples of dissolution study. Hence it was felt necessary to develop a simple, economical precise and rapid spectrophotometric method for the direct quantitative determination of Losartan Potassium. The current research work deals with the development of spectrophotometric method and its validation as per International Conference on Harmonization (ICH) guideline. [9-11]. The developed method was found to be selective, accurate, precise, reliable, and economical.
N
N Cl
C4H9
CH2OH
K
N N N
N
Figure 1: Chemical structure of Losartan Potassium
Method and materials Instrumentation
Shimadzu UV1700 pharmaspec double beam spectrophotometer with UV Probe software version 2 was used to develop analytical method. Another same machine with same version of software installed on another system is used for interday precision study. The above instruments have automatic wavelength accuracy 0.1 nm and matched quartz cells with 1cm cell path length.
Material and reagent
Losartan Potassium was gifted from Wockhardt Pharma ltd Aurangabad. All chemicals, solvents and reagents used were analytical grade and purchased from Merck chemicals, India.
Method development[12-13] Preparation of stock solution
A stock solution was prepared by weighing 10 mg of Losartan Potassium in100 mL of volumetric flask and dissolved in Distilled Water to obtain a concentration 0.1 mg/mL or 100 µg/mL (stock).
Selection of wavelength for analysis of Losartan Potassium
Accurately measured 1mL of stock solution was transferred into 10 mL volumetric flask and diluted to 10 mL to give concentration of 10 µg/ mL and it was used for initial spectral scan in the UV range of 400-200 nm to detect maximum wavelength and further dilutions for linearity were prepared from the stock solution by allegation method.
Preparation of serial dilutions
The serial dilutions from the stock I in the range of 2, 4, 6 up to 10 µg/mL were prepared.
Construction of calibration curve
The absorbance of prepared 5 different concentrations was measured at λmax 205 nm. The developed method was further analyze for correlation coefficient and validated. The data obtained was summarized in table.
Method validation[14]
The methods were validated according to ICH guidelines for validation of analytical procedures. Analysis of variance (ANOVA) was used to verify the validity of the methods.
Linearity and range
Ajit C. Jadhav et al Int. J. Pharm. Res. Allied Sci., 2016, 5(1):58-64
_____________________________________________________________________________________
recorded and plot the graph. The linearity was evaluated by linear regression analysis, which was calculated by the least square regression method. The linear regression equation and coefficient correlation was obtained from the UV probe software.
Accuracy
The accuracy was determined in triplicate by analyzing % recovery of Losartan Potassium by standard addition recovery method. The study carried out by adding the known amount of the sample solution in the standard stock solution. The recovery study was carried out at three different levels i.e. 80%, 100% and 120% standard addition method. The percentage recovery was calculated as mean ± standard deviation. The results were shown in table 2.
Precision
The precision of the method was demonstrated by intra-day and inter-day variation studies. In the intraday precision study three different solution of same concentration were prepared and analyzed three times in a day (morning, noon and evening) for single day, where as in interday precision study the solutions of same concentration were prepared and analyzed thrice, for three consecutive days, and the absorbance’s were recorded. The result was indicated by calculating % RSD.
Limit of detection and limit of quantification
The parameters LOD and LOQ were determined on the basis of response and slope of the regression equation.
Limit of detection
The limit of detection (LOD) was determined by preparing solutions of different concentrations from 2-10µg/mL. The detection limit of an individual analytical procedure is the lowest amount of analyte in a sample, which can be detected, but not necessarily quantitated as an exact value.
=3.3 ×
Limit of quantification
The LOQ is the concentration that can be quantitated reliably with a specified level of accuracy and precision. The LOQ was calculated using the formula involving the standard deviation of response and the slope of the calibration curve.
= 10 ×
Sensitivity
The sensitivity of method was determined by using calculating the different parameter like molar absorptivity and sandell’s sensitivity.
Robustness
Robustness of the method was determined by carrying out the analysis under different conditions of temperature such as room temperature, wavelength conditions and variation in concentrations. The respective absorbance was noted and the result was expressed as %RSD as shown in table 7.
Ruggedness
Ruggedness of the method was determined by carrying out the analysis by different analyst and the respective absorbance of solution of Losartan potassium having concentration as 4 µg/ml was noted. The result is expressed as shown in table 6. The developed method for estimation of Losartan potassium was found to be robust and rugged as shown in table 6 and table 7.
Specificity
Specificity is the ability to assess unequivocally the analyte in the presence of components which may be expected to be present. Typically these might include impurities, degradant, matrix, etc. Specificity was done by using an excipient, Aerosil 200(Colloidal Silicon Dioxide). The three different concentrations at three levels 80%, 100%, 120% respectively are spiked in standard Losartan potassium solution (2 µg/ml).at each levels of the amount, three determinations were performed to check effect of Aerosil 200.
RESULTS AND DISCUSSION
Method development
Ajit C. Jadhav et al
Int.
J. Pharm. Res. Allied Sci., 2016, 5(1):58-64
_____________________________________________________________________________________
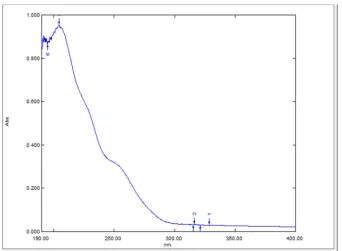
400nm and 200 nm and it was observed that maximum absorbance (λmax) was found to be at 205 nm as shown in Figure 2. The method further validate for detection level, quantification level, linearity and range, accuracy and precision were then conducted.
The found wavelength and dilution pattern permitted good results for method development and validation different concentrations of Losartan Potassium.
Figure 2: Losartan potassium Spectra
Linearity and range
Five points calibration curve were prepared by using serial dilution in a concentration range from 2, 4, 6 up to 10
µg/ml. The response graph (concentration vs. absorbance) was found to be linear in the investigational concentration range and the regression equation was y=0.10351x - 0.01835with correlation coefficient 0.9996
Table 1: Calibration Curve data of Losartan potassium
Concentration (µg/mL) Absorbance
2 0.11
4 0.25
6 0.38
8 0.53
10 0.67
Table 2: Evaluation of accuracy
Amount of Drug
(µg/ml)
Level of Addition
(%)
Amount Added
(µg/ml)
Total amount
Amount Recovered
(µg/ml)
% Recovery
% Recovery
(Mean±SD) %RSD
2 80 1.6 3.6 3.6 100
99.990±0.0160 0.016038993
2 80 1.6 3.6 3.6 100
2 80 1.6 3.6 3.599 99.972
2 100 2 4 4 100
100 -
2 100 2 4 4 100
2 100 2 4 4 100
2 120 2.4 4.4 4.399 99.977
99.992±0.0131 0.013122591
2 120 2.4 4.4 4.4 100
Ajit C. Jadhav et al
Int.
J. Pharm. Res. Allied Sci., 2016, 5(1):58-64
_____________________________________________________________________________________
Figure 3: Calibration curve of losartan in distilled water at 205nm
Accuracy
The study of the spiked drug were depicted that the spectrophotometer responses showed good recovery for 80, 100 and 120% i.e. 99.79, 100.22 and 99.12%, respectively with very low percent RSD indicating that the method was accurate.
Precision
The precision of an analytical procedure express the closeness of agreement between a series of measurement obtained from multiple sampling of the homogenous sample under the prescribed conditions. To determine this, solutions having concentration 4 µg/ml were measured in triplicate in a day and the same was measured in the next 3 days. The % RSD values were measured and presented in Table3, 4 and5. In all cases, the RSD was always less than 2 indicating the precision of the method
Repeatability
Table 3: Repeatability study
Observation Value Obtained
Absorbance 0.25
Mean∗ 0.251
SD 0.0025
%RSD 1.0026
∗(n=3) Interday Precision
Table 4:Inter-day Precision study
Sr No. Mean Absorbance Mean ± SD %RSD Mean %RSD
1
0.25
0.2503±0.0005 0.2306 0.251
0.25
2
0.251
0.251±0.001 0.3984
0.25 0.5421
0.252
3
0.25
0.2523±0.0025 0.9973 0.252
Ajit C. Jadhav et al Int. J. Pharm. Res. Allied Sci., 2016, 5(1):58-64
_____________________________________________________________________________________
Intraday Precision
Table 5: Intraday precision study
Sr. No. Absorbance Mean ± SD %RSD Mean %RSD
1
0.25
0.2483± 0.0028 1.1624 0.25
0.24
2
0.251
0.2503± 0.0005 0.2306
0.25 0.7747
0.25
3
0.25
0.248± 0.0023 0.9312 0.246
0.25
Limit of detection and quantification
Considering the signal-to-noise ratio of 3.3 and 10, In the spectrophotometric analysis concentration of 1.0 µg/ml of Losartan Potassium at absorption wavelength 205 nm the corresponding absorbance value was 0.051. Hence, this concentration was developed as the detection limit. The limit of quantitation for the UV method was 0.2594 µg/ml, defined as the lower concentration that provided an adequate precision (R.S.D. < 2.0%).
Sensitivity
The developed method showed the high molar absorptivity value i.e. 25355, which indicated that it absorb light very effectively at the appropriate wavelength, and hence low concentrations of a compound with can be easily detected. Sandell’s sensitivity value 0.0181µg/cm2 suggested that the Losartan Potassium can be detected in the very low concentration at path length of 1cm. both the above parameter will proved the sensitivity of drug and method developed at the specific wavelength at a specific concentration.
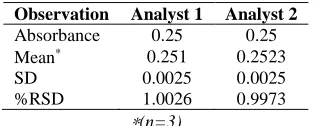
Ruggedness
In the ruggedness study, the influence of small, deliberate variations of the analytical parameters on absorbance of drug was examined. The factor selected was change in analyst. Result of ruggedness study indicate that the selected factor remained unaffected by small variations with % RSD of 0.9973- 1.0026, which confirms the ruggedness of method.
Robustness
In the robustness study, the influence of small, deliberate variations of the analytical parameters on absorbance of drug was examined. The factor selected was change in wavelength. Results of robustness study indicate that the selected factor remained unaffected by small variations with %RSD of 0.1559-0.3033, which confirms the robustness of method.
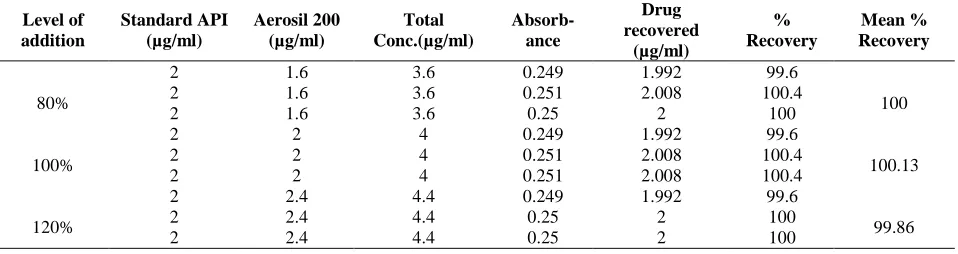
Specificity
The specificity of proposed method was ascertained by performing study at three concentration levels i.e. 80%, 100%and 120%.The mean recovery of added excipient at each level was found to be 99.86– 100.13with standard deviation of .The % RSD was found to be 0.2312-0.4612.The percent recovery obtained indicates non-interference from the excipients in the formulation .the results of specificity study are given in table 8.
Table 6: Ruggedness data for Losartan potassium
Observation Analyst 1 Analyst 2
Absorbance 0.25 0.25
Mean∗ 0.251 0.2523
SD 0.0025 0.0025
%RSD 1.0026 0.9973
∗(n=3)
Table 7: Robustness data for Losartan Potassium
Sr. No. Wavelength Absorbance(mean± SD)∗ %RSD
1 204 0.3703±0.0005 0.1559
2 205 0.3806±0.0011 0.3033
3 206 0.3696±0.0005 0.1561
Ajit C. Jadhav et al Int. J. Pharm. Res. Allied Sci., 2016, 5(1):58-64
_____________________________________________________________________________________
Table 8: Specificity study
Level of addition
Standard API (µg/ml)
Aerosil 200 (µg/ml)
Total Conc.(µg/ml)
Absorb-ance
Drug recovered
(µg/ml)
% Recovery
Mean % Recovery
80%
2 1.6 3.6 0.249 1.992 99.6
100
2 1.6 3.6 0.251 2.008 100.4
2 1.6 3.6 0.25 2 100
100%
2 2 4 0.249 1.992 99.6
100.13
2 2 4 0.251 2.008 100.4
2 2 4 0.251 2.008 100.4
120%
2 2.4 4.4 0.249 1.992 99.6
99.86
2 2.4 4.4 0.25 2 100
2 2.4 4.4 0.25 2 100
CONCLUSION
From the result it was concluded that simple, rapid, precise, and economical spectrophotometric method has been developed for the quantitative estimation of Losartan Potassium in pharmaceutical formulation. The method was validated as per the ICH guidelines and it was found that the developed method was robust and sensitive. Hence, this method can be successfully and suitably acquired for routine quality control analysis of Losartan Potassium in bulk and pharmaceutical dosage form.
Acknowledgement
The author is thankful to HOD, Department of Pharmaceutics, Government college of Pharmacy, Aurangabad for providing facilities to carry out the research work. The author wishes to express his gratitude to Wockhardt Pharma ltd Aurangabad Pharmaceuticals for providing gift sample of Losartan Potassium.
REFERENCES
[1] Pawar H.A, Lalitha K.G, Development and Validation of a Novel RP-HPLC Method for Estimation of Losartan Potassium in Dissolution Samples of Immediate and Sustained Release Tablets, Hindawi Publishing Corporation Chromatography Research International volume, 2014, (8) :1.
[2] The United States Pharmacopoeia Drug Information, vol. 1, The United States Pharmacopoeia Convention, Rockville, Md, USA, 18th edition, 1998.
[3] K.D Tripathi, Essential of medical pharmacology, Jaypee brother’s medical publishers (p) ltd, 5th edition, 453.
[4] K. E. McCarthy,Q.Wang, E. W. Tsai, R. E.Gilbert,D. P. Ip, and M. A. Brooks, Determination of losartan and its degradates in COZAAR tablets by reversed-phase high-performance thin layer chromatography, Journal of Pharmaceutical and Biomedical
Analysis, 1998,17(4) :671–677.
[5] S. R. Sathe and S. B. Bari, “Simultaneous analysis of losartan potassium, atenolol, and hydrochlorothiazide in bulk and in tablets by high-performance thin-layer chromatography without absorption densitometry,” Acta Chromatographica, no. 19, pp. 270–278, 2007.
[6] M. G. Quaglia, E. Donati, G. Carlucci, P.Mazzeo, and S. Fanali, Determination of losartan and hydrochlorothiazide in tablets by CE and CEC, Journal of Pharmaceutical and Biomedical Analysis, 2002, 29(6): 981–987.
[7] O. C. Lastra, I. G. Lemus, H. J. S´anchez, and R. F. Pérez, Development and validation of an UV derivative spectrophotometric determination of Losartan potassium in tablets, Journal of Pharmaceutical and Biomedical Analysis, 2003, 33(2) :175–180.
[8] A. H. Prabhakar and R. Giridhar, A rapid colorimetric method for the determination of Losartan potassium in bulk and in synthetic mixture for solid dosage form, Journal of Pharmaceutical and Biomedical Analysis, 2002, 27(6): 861–866.
[9] ICH, Q2 (R1) validation of analytical procedure, test and methodology, in Proceedings of the International Conference on Harmonization, Geneva, Switzerland, 2005.
[10] ICH, Q2A. Validation of Analytical Procedures, Consensus Guidelines, ICH Harmonized Tripartite Guidelines, 1994. [11] ICH, Q2B. Validation of Analytical Procedures: Methodology, Consensus Guidelines, ICH Harmonized Tripartite Guidelines, 1996.
[12]Katariya Vijay R., Karva Gopal S., Shahi Sadhana R., Spectrophotometric estimation of ritonavir, Inventi
Rapid: Pharm Analysis & Quality Assurance, 2013.
[13]Parkh D.R, Patil M.P,Sonawane S.S,Jain P.J.,Development and validation of Spectrophotometric method for estimation of mebendazole in bulk and pharmaceutical formulation,2015,4(7):2223-2235.