R E S E A R C H
Open Access
Effects of coenzyme Q10 supplementation
on antioxidant capacity and inflammation
in hepatocellular carcinoma patients after
surgery: a randomized, placebo-controlled
trial
Hsiao-Tien Liu
1,2, Yi-Chia Huang
3, Shao-Bin Cheng
1,2, Yin-Tzu Huang
2and Ping-Ting Lin
3,4*Abstract
Background:It has been reported that higher levels of oxidative stress and inflammation play a key role in the progression of hepatocellular carcinoma (HCC) after surgery. Coenzyme Q10 is an endogenous lipid-soluble antioxidant. To date, no intervention study has investigated coenzyme Q10 supplementation in HCC patients after surgery. The purpose of this study was to investigate oxidative stress, antioxidant enzymes activity, and inflammation levels in HCC patients after surgery following administration of coenzyme Q10 (300 mg/day).
Methods:This study was designed as a single-blinded, randomized, parallel, placebo-controlled study. Patients who were diagnosed with primary HCC (n= 41) and were randomly assign to a placebo (n= 20) or coenzyme Q10 (300 mg/day,n= 21) group after surgery. The intervention lasted for 12 weeks. Plasma coenzyme Q10, vitamin E, oxidative stress antioxidant enzymes activity and inflammatory markers levels were measured.
Results:The oxidative stress (p= 0.04) and inflammatory markers (hs-CRP and IL-6,p< 0.01) levels were significantly decreased, and the antioxidant enzymes activity was significantly increased (p< 0.01) after 12 weeks of coenzyme Q10 supplementation. In addition, the coenzyme Q10 level was significantly negatively correlated with the oxidative stress (p= 0.01), and positively correlated with antioxidant enzymes activity (SOD,p= 0.01; CAT,p< 0.05; GPx,p= 0.04) and vitamin E level (p= 0.01) after supplementation.
Conclusion:In conclusion, we demonstrated that a dose of 300 mg/d of coenzyme Q10 supplementation
significantly increased the antioxidant capacity and reduced the oxidative stress and inflammation levels in HCC patients after surgery.
Trial registration:Clinical Trials.gov Identifier: NCT01964001
Keywords:Coenzyme Q10 supplementation, Oxidative stress, Antioxidation, Inflammation, Hepatocellular
carcinoma, Surgery
* Correspondence:[email protected] 3
Department of Nutrition, Chung Shan Medical University, Taichung 40201, Taiwan
4Department of Nutrition, Chung Shan Medical University Hospital, Taichung 40201, Taiwan
Full list of author information is available at the end of the article
Background
The most recent World Health Organization (WHO, 2014) report indicated that liver cancer is the second leading cause of cancer deaths worldwide, and 0.8 mil-lion people (9.1 % of the global population) died from liver cancer [1]. In Taiwan, liver cancer is also the sec-ond leading cause of cancer deaths among men and women (Ministry of Health and Welfare, 2014). Hepa-tocellular carcinoma (HCC) accounts for most liver cancers [2]. The major risk factors for HCC include hepatitis B or C virus, alcoholic liver disease, and most likely, nonalcoholic fatty liver disease [2]. Recently, it has been reported that higher level of oxidative stress and inflammation play a key role in the progression of HCC [3]. Oxidative stress may increase via the gener-ation of reactive oxygen species (ROS) and defects in redox defense mechanisms with antioxidant enzymes, such as superoxide dismutase (SOD), catalase (CAT), or glutathione peroxidase (GPx), in mitochondria [4]. This mitochondrial dysfunction may lead to pathological mechanisms of chronic hepatic inflammation and subse-quent hepatocarcinogenesis [3]. A case-control study has recently found that patients with HCC had significantly higher levels of oxidative stress, inflammation, and lower antioxidant capacities [5]. Consequently, it is worth trying an agent that can lower oxidative stress and reduce in-flammation in patients with HCC.
Coenzyme Q10 (also called ubiquinone) is a lipid-soluble benzoquinone that has 10 isoprenyl units in its side chain and is a key component of the mitochondrial respiratory chain for adenosine triphosphate synthesis [6, 7]. Additionally, coenzyme Q10 is an intracellular antioxidant that protects membrane phospholipids, mitochondrial membrane protein, and LDL-C from free radical-induced oxidative damage [8, 9]. In vivo studies have demonstrated that coenzyme Q10 has therapeutic and chemotherapeutic effects by modulating the expres-sion of hepPar-1, alpha-fetoprotein, inducible nitric oxide synthase, cyclooxygenase-2 and nuclear factor-κB (NF-κB) in the liver tissue of rats with HCC [10, 11]. However, to date, no published study has investigated the anti-oxidative and anti-inflammation effects of coen-zyme Q10 supplementation in patients with HCC. Thus, the purpose of this clinical study was to examine the levels of oxidative stress, antioxidant enzymes activity, and inflammation after coenzyme Q10 supplementation (300 mg/day) in patients with HCC.
Methods
Participants
This study was designed as a single-blinded, randomized, parallel, placebo-controlled study. Following tumor re-section, patients who were diagnosed with primary HCC (International Classification of Diseases 9, code 155.0)
were recruited from the Division of General Surgery of Taichung Veterans General Hospital. We excluded patients who were younger than 20 years of age or older than 80 years of age, as well as during pregnant or lactating women, patient undergoing chemotherapy or hormone therapy, those with a history or current diagnosis of cardiovascular or renal disease, and those taking warfarin or statin medications. For patients ing vitamins supplements, we asked them to stop tak-ing the supplements for at least for 1 month before enrolling in the study. Informed consent was obtained from each subject. This study was approved by the Institutional Review Board of Taichung Veterans General Hospital, Taiwan and registered at Clinical Trials.gov (NCT01964001).
Using a sample size calculation, we expected that the change in the levels of malondialdehyde would be 0.15 ± 0.2 μM after the coenzyme Q10 supplementation; therefore, the desired power was set at 0.8 to detect a true effect and at anαvalue equal to 0.05, with a mini-mum of 16 subjects in each intervention group. We enrolled 41 HCC patients in this study, and we used a random numbers table to randomly assign the subjects to the placebo (n= 20) or coenzyme Q10 (Q10-300 group, n= 21) group. The coenzyme Q10 and placebo (starch) capsules were commercially available prepara-tions (New Health Co., Ltd. Taichung, Taiwan). The intervention was administered for 12 weeks. The subjects were instructed to take two capsules daily (coenzyme Q10 supplements 300 mg/d, 150 mg/b.i.d). To monitor compli-ance, we determined the degree of compliance for each patient, according to the number of returning capsules, and we measured the coenzyme Q10 level every 4 weeks after the supplementation. The following data were re-corded for all subjects: age, blood pressures, and smoking and drinking habits, and exercise frequency. Body weight, height, waist and hip circumferences were measured; and the body mass index (BMI) and the ratio of waist to hip were calculated.
Blood collection and biochemical measurements
(hs-CRP) was quantified by particle-enhanced immuno-nephelometry with an image analyzer (Dade Behring, IL, USA). Plasma tumor necrosis factor-α (TNF-α) (R&D Systems Inc., Minneapolis, USA) and interleukin-6 (IL-interleukin-6) (eBioscience, CA, USA) levels were measured using an enzyme-linked immunosorbent assay (ELISA) with commercially available kits, according to the man-ufacturer’s instructions.
Plasma coenzyme Q10 and vitamin E levels were measured using high-performance liquid chromatog-raphy (HPLC) and were detected with a UV detector at 275 nm and 292 nm, respectively [12, 13]. Plasma mal-ondialdehyde (MDA) was determined using the TBARs (thiobarbituric acid reactive substances) method, as described by Botsoglou [14]. The red blood cell (RBC) samples were washed with normal saline after remov-ing the plasma. Then, the RBC samples were diluted with 25x sodium phosphate buffer for superoxide dismutase (SOD) and glutathione peroxidase (GPx) measurements, with 250x sodium phosphate buffer for the catalase (CAT) measurement. The antioxidant en-zymes activities (CAT, SOD, and GPx) were determined in the fresh samples and the methods used to measure these activities have been previously described [15–17]. The protein content of the plasma and RBC was deter-mined based on the biuret reaction of the bicinchoninic acid (BCA) kit (Thermo, Rockford, IL, USA). The values of the antioxidant enzymes activities were expressed as unit/ mg of protein. All analyses were performed in duplicate.
Fig. 1Flow Diagram
Table 1Characteristics of subjects
Placebo (n= 19) Q10-300 (n= 20) males (n, %) 12 (63.2 %) 15 (75.0 %) age (y) 61.5 ± 11.0 (62.0)a 59.7 ± 8.3 (58.5)
SBP (mmHg) 133.8 ± 18.0 (134.0) 124.8 ± 19.3 (119.5)
DBP (mmHg) 77.9 ± 11.2 (78.0) 76.9 ± 12.3 (76.0)
waist circumference (cm)
89.1 ± 7.8 (88.0) 86.7 ± 10.2 (88.5)
waist hip ratio 0.92 ± 0.05 (0.91) 0.94 ± 0.16 (0.94)
BMI (kg/m2) 24.7 ± 3.2 (24.5) 23.1 ± 2.6 (22.8)
current smokerb,n(%) 6 (31.6 %) 5 (25.0 %) drinks alcoholc,n(%) 3 (15.8 %) 3 (15.0 %) Exercised,n(%) 9 (47.4 %) 8 (40.0 %) Hepatitis B,n(%) 14 (73.7 %) 12 (60.0 %) Hepatitis C,n(%) 4 (21.1 %) 7 (35.0 %) Cirrhosis,n(%) 6 (31.6 %) 5 (25.0 %) Recurrence,n(%) 3 (15.8 %) 4 (20.0 %) Hematology
BUN (mg/dL) 15.5 ± 4.9 (15.0) 17.1 ± 9.2 (15.5)
creatinine (mg/dL) 0.8 ± 0.3 (0.8) 0.9 ± 0.3 (0.9)
GOT (IU/L) 35.2 ± 24.8 (27.0) 40.4 ± 23.0 (31.5)
GPT (IU/L) 44.8 ± 36.6 (38.0) 55.5 ± 39.8 (45.5)
TC (mg/dL) 162.7 ± 36.4 (148.0) 162.1 ± 32.7 (156.0)
TG (mg/dL) 95.3 ± 42.3 (87.0) 93.4 ± 29.9 (92.5)
LDL-C (mg/dL) 100.4 ± 32.3 (90.0) 102.3 ± 32.8 (100.0)
HDL-C (mg/dL) 50.6 ± 11.6 (50.0) 49.2 ± 12.4 (47.5)
TC / HDL-C 3.3 ± 1.0 (2.9) 3.5 ± 1.0 (3.5)
Dietary intake
Energy (kcal/d) 1608.5 ± 334.5 (1531.2) 1686.5 ± 460.8 (1655.8)
Protein (g/d) 65.9 ± 17.9 (68.0) 66.2 ± 21.2 (66.8)
% of total calories 16.6 % 15.7 %
Fat (g/d) 49.5 ± 23.9 (48.2) 50.6 ± 16.1 (51.7)
% of total calories 26.6 % 26.8 %
carbohydrate (g/d) 228.6 ± 40.8 (227.0) 251.1 ± 89.6 (238.6)
% of total calories 57.2 % 57.9 %
PUFA (g/d) 15.6 ± 11.8 (13.0) 13.8 ± 8.6 (11.1)
MUFA (g/d) 15.1 ± 9.5 (11.9) 15.3 ± 6.6 (15.6)
SFA (g/d) 12.8 ± 8.0 (10.3) 14.2 ± 5.7 (14.3)
vitamin A (μg R.E./d) 3216.8 ± 4244.7 (1188.1)
3204.2 ± 3705.5 (1110.4)
vitamin E (mgα-T.E./d) 421.6 ± 727.1 (21.5) 615.0 ± 989.3 (10.8)
cholesterol (mg/d) 250.0 ± 163.8 (238.2) 231.8 ± 117.6 (197.8)
dietary fiber (g/d) 13.0 ± 6.5 (11.9) 10.9 ± 6.1 (9.7) BMIbody mass index,BUNblood urea nitrogen,GOTglutamic oxaloacetic transaminase,HCChepatocellular carcinoma,HDL-Chigh-density lipoprotein-cholesterol,LDL-Clow density lipoprotein-cholesterol,MUFA monounsaturated fatty acid,PUFApolyunsaturated fatty fat,SFAsaturated fatty acid,TCtotal cholesterol,TGtriglyceride
a
means ± SD (medians)
b
current smoker: individuals currently smoking one or more cigarettes per day
c
drinks alcohol: individuals drinking one or 1 more alcoholic drinks per day regularly
d
Statistical analyses
The data were analyzed using SigmaPlot software (ver-sion 12.0, Systat, San Jose, CA, USA). The normality of the distribution of the variables was evaluated using the Shapiro-Wilk test. When comparing the continuous variables between the placebo and the Q10-300 groups, Student’s t-test or the Mann-Whitney rank sum test was used. For categorical response variables, the differ-ences between the two groups were assessed using the Chi-square test or Fisher’s exact test. When comparing the levels of coenzyme Q10, vitamin E, and antioxidant enzymes activities at week 0, 4, 8, and week 12 within the group, one-way repeated measures ANOVA or Friedman repeated measures ANOVA on ranks was performed, and used Holm-Sidak post hoc test to assess the statistically significant differences. When comparing the levels of inflammatory markers at week 0 and week 12 within the group, paired-t test was performed. To examine the correlation between the coenzyme Q10 level and the levels of vitamin E, antioxidant enzymes activities, and inflammatory markers after the supple-mentation, Spearman rank order correlation was used. Additionally, simple linear regressions were used to examine the correlations between the changes in the levels of coenzyme Q10 and the changes in the levels of oxidative stress, antioxidant enzymes activity, and vita-min E. The results were considered to be statistically significant at P< 0.05. The values presented in the text are the means ± standard deviation (medians).
Results
Characteristics and dietary intake of subjects
The sampling and trial profiles are summarized in Fig. 1, along with the number of subjects who completed the study in each group. Thirty-nine subjects completed the intervention (placebo, n= 19; Q10-300, n= 20). Table 1 shows the demographic characteristics and the dietary intakes of the subjects. At baseline, there were no signifi-cant between group differences in terms of age, blood pressure, anthropometric measurements, hematological entities, and dietary intake, as well as the frequency of smoking, drinking, or exercise. A total of 66.7 % of the subjects had hepatitis B, and 28.2 % of the subjects had hepatitis B or cirrhosis. In addition, 82.0 % of the sub-jects were newly diagnosed with HCC.
Levels of coenzyme Q10, antioxidant capacity, and inflammation after supplementation
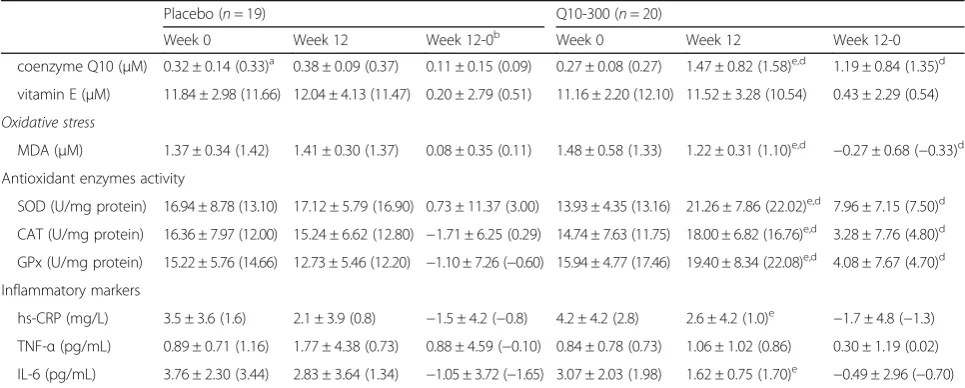
The levels of coenzyme Q10, vitamin E, oxidative stress, and antioxidant enzymes after intervention are shown in Table 2 and Fig. 2. The plasma coenzyme Q10 concentration was significantly increased after the coenzyme Q10 supplementation (P< 0.01). Sub-jects in the Q10-300 group had significantly higher levels of coenzyme Q10 than those in the placebo group at weeks 4, 8, and 12 (P< 0.01). The plasma MDA level was significantly decreased after the coen-zyme Q10 supplementation (1.48 ± 0.58 μM decreased to 1.22 ± 0.31 μM, P= 0.04) and in the patients in the
Table 2Changes in the levels of coenzyme Q10, vitamin E, oxidative stress, antioxidant enzymes activities, and inflammation in HCC patients after supplementation
Placebo (n= 19) Q10-300 (n= 20)
Week 0 Week 12 Week 12-0b Week 0 Week 12 Week 12-0
coenzyme Q10 (μM) 0.32 ± 0.14 (0.33)a 0.38 ± 0.09 (0.37) 0.11 ± 0.15 (0.09) 0.27 ± 0.08 (0.27) 1.47 ± 0.82 (1.58)e,d 1.19 ± 0.84 (1.35)d
vitamin E (μM) 11.84 ± 2.98 (11.66) 12.04 ± 4.13 (11.47) 0.20 ± 2.79 (0.51) 11.16 ± 2.20 (12.10) 11.52 ± 3.28 (10.54) 0.43 ± 2.29 (0.54)
Oxidative stress
MDA (μM) 1.37 ± 0.34 (1.42) 1.41 ± 0.30 (1.37) 0.08 ± 0.35 (0.11) 1.48 ± 0.58 (1.33) 1.22 ± 0.31 (1.10)e,d −0.27 ± 0.68 (−0.33)d
Antioxidant enzymes activity
SOD (U/mg protein) 16.94 ± 8.78 (13.10) 17.12 ± 5.79 (16.90) 0.73 ± 11.37 (3.00) 13.93 ± 4.35 (13.16) 21.26 ± 7.86 (22.02)e,d 7.96 ± 7.15 (7.50)d
CAT (U/mg protein) 16.36 ± 7.97 (12.00) 15.24 ± 6.62 (12.80) −1.71 ± 6.25 (0.29) 14.74 ± 7.63 (11.75) 18.00 ± 6.82 (16.76)e,d 3.28 ± 7.76 (4.80)d
GPx (U/mg protein) 15.22 ± 5.76 (14.66) 12.73 ± 5.46 (12.20) −1.10 ± 7.26 (−0.60) 15.94 ± 4.77 (17.46) 19.40 ± 8.34 (22.08)e,d 4.08 ± 7.67 (4.70)d
Inflammatory markers
hs-CRP (mg/L) 3.5 ± 3.6 (1.6) 2.1 ± 3.9 (0.8) −1.5 ± 4.2 (−0.8) 4.2 ± 4.2 (2.8) 2.6 ± 4.2 (1.0)e −1.7 ± 4.8 (−1.3)
TNF-α(pg/mL) 0.89 ± 0.71 (1.16) 1.77 ± 4.38 (0.73) 0.88 ± 4.59 (−0.10) 0.84 ± 0.78 (0.73) 1.06 ± 1.02 (0.86) 0.30 ± 1.19 (0.02)
IL-6 (pg/mL) 3.76 ± 2.30 (3.44) 2.83 ± 3.64 (1.34) −1.05 ± 3.72 (−1.65) 3.07 ± 2.03 (1.98) 1.62 ± 0.75 (1.70)e −0.49 ± 2.96 (−0.70) CATCatalase activity,GPxglutathione peroxidase,HCChepatocellular carcinoma,hs-CRPhigh sensitivity C-reactive protein,IL-6interleukin-6,MDAMalondialdehyde,
SODsuperoxide dismutase,TNF-αtumor necrosis factor-α
a
means ± SD (medians)
b
Difference between week 12 and week 0
d
values are significantly different between the two groups
e
placebo group at week 12 (1.22 ± 0.31 μM vs. 1.41 ± 0.30μM,P= 0.04). In terms of the antioxidant enzymes activity, the SOD (13.93 ± 4.35 U/mg protein increased to 19.39 ± 4.79 U/mg protein,P< 0.01) and GPx activities (15.94 ± 4.77 U/mg protein increased to 18.82 ± 7.03 U/ mg protein, P< 0.01) were significantly increased after 8 weeks of coenzyme Q10 supplementation and the CAT activity was significantly increased after 4 weeks of coenzyme Q10 supplementation (14.74 ± 7.63 U/mg protein increased to 18.32 ± 12.03 U/mg protein, P < 0.01).
The post-supplementation changes in the levels of co-enzyme Q10, vitamin E, oxidative stress, antioxidant enzymes activities, and inflammation in HCC patients are also shown in Table 2. After 12 weeks of supple-mentation, subjects in the Q10-300 supplementation
showed an increased level of changes in their level of coenzyme Q10 (P< 0.01) and antioxidant enzymes ac-tivity (SOD,P= 0.03; CAT,P= 0.01; GPx,P< 0.01) than those in the placebo group. The levels of MDA (P< 0.01) and inflammatory markers were significantly lower in the Q10-300 group compared to the placebo group after 12 weeks of supplementation (hs-CRP, 4.2 ± 4.2 mg/L decreased to 2.6 ± 4.2 mg/L,P< 0.01; IL-6, 3.07 ± 2.03 pg/ mL decreased to 1.62 ± 0.75 pg/mL, P< 0.01). However, the levels of vitamin E (P= 0.81) and inflammatory markers (hs-CRP, P= 0.64, TNF-α, P= 0.68, IL-6, P= 0.80), as well as the difference between week 12 and week 0 of inflammatory markers (hs-CRP, P= 0.58, TNF-α,P= 0.29, IL-6,P= 0.13) were not significantly dif-ferent between the placebo and Q10-300 groups after supplementation.
Fig. 2Levels of coenzyme Q10, vitamin E, oxidative stress, and antioxidant enzymes after supplementation.†values are significantly different between the two groups.*values are significantly different within each group. CAT, catalase activity; GPx, glutathione peroxidase; HCC,
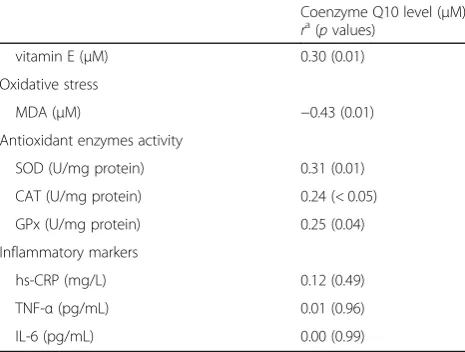
Correlations between coenzyme Q10, antioxidant capacity, and inflammation after supplementation The correlations between coenzyme Q10, vitamin E, oxidative stress, antioxidant enzymes activities, and in-flammation after supplementation are shown in Table 3. The plasma coenzyme Q10 concentration was signifi-cantly correlated with the levels of vitamin E (r= 0.30, P= 0.01), MDA (r= -0.43,P= 0.01), and antioxidant en-zymes activities (SOD, r= 0.31, P= 0.01; CAT, r= 0.24, P< 0.05; GPx, r= 0.25,P= 0.04) after 12 weeks of sup-plementation. However, there was no significant associ-ation between the levels of coenzyme Q10 and inflammatory markers after supplementation.
Furthermore, we examined the correlations between the changes in the levels of coenzyme Q10 and oxidative stress, antioxidant enzymes, and vitamin E (Fig. 3). Changes in the levels of coenzyme Q10 was signifi-cantly correlated with changes in the levels of MDA (β= -0.29, p= 0.02), antioxidant enzymes activity (SOD, β= 2.57, p= 0.02; CAT, β= 4.47, p< 0.01; β= 3.53,p= 0.03), and vitamin E (β= 1.44,p= 0.01).
Discussion
This is the first clinical study to demonstrate that coen-zyme Q10 (at a dose of 300 mg/d for 12 weeks) in-creases antioxidant enzymes activities (SOD, CAT, and GPx) and decreases oxidative stress and inflammation in patients with HCC. Coenzyme Q10 shows a signifi-cant anticarcinogenic activity in various cancer models via its antioxidant and anti-inflammatory properties [10, 11,18, 19]. Coenzyme Q10 is a highly safe and well tolerable supplement. Because coenzyme Q10 is a well
antioxidant and anti-inflammation agent, it may repre-sent a potential complementary therapeutic option in chronic disease patients who suffer from a higher status of oxidative stress or inflammation [20–22].
In this study, subjects in both groups had a low level of coenzyme Q10 (normal ranges: 0.5–1.7 μM) [23] at baseline (0.30 ± 0.11 μM). After a 4-week supplementa-tion of coenzyme Q10 supplementasupplementa-tion at a dose of 300 mg/d, the low level of coenzyme Q10 rapidly and significantly increased in patients with HCC (0.27 ± 0.08 μM to 1.31 ± 0.63 μM, p< 0.01), and this level was sustained for 12 weeks. Additionally, antioxidant enzyme activity significantly increased after the coenzyme Q10 supplementation, the CAT activity was significantly in-creased by 25.5 % after 4 weeks of supplementation, and SOD, CAT, and GPx were significantly increased by 43.2 %, 40.4 %, and 13.4 % after 8 weeks of supplementa-tion. After 12 weeks of coenzyme Q10 supplementation, SOD, CAT, and GPx were significantly increased by 67.3 %, 42.6 %, and 26.5 % and oxidative stress (MDA) was significantly decreased by 17.3 %. Although there was no significant difference in the level of vitamin E after 12 weeks of supplementation, there was a signifi-cantly positive correlation between the levels of coen-zyme Q10 and vitamin E after supplementation. Because patients with HCC suffer from a higher level of oxidative stress and inflammation [5], and a deficiency in coen-zyme Q10 was found in HCC patients, we suggest that the administration of coenzyme Q10 supplements in pa-tients with HCC during the surgery may be beneficial. Administered coenzyme Q10 at dose of 300 mg/d to HCC patients can significantly increase their antioxidant capacity, protect vitamin E against superoxide-driven oxidation and regenerate/maintain the level of vitamin E during antioxidation processes [24, 25].
Patients infected with hepatitis B and hepatitis C viruses account for 65–80 % of HCC worldwide [26]. In the present study, 66.7 and 28.2 % of the patients with HCC had a history of infection with hepatitis B and hepatitis C viruses, respectively. These chronic infections cause liver inflammation, and may lead to liver fibrosis/ cirrhosis or HCC [27]. In this study, a total of 69.2 % of the subjects (N= 27, placebo, n= 11; Q10-300, n= 16) had chronic inflammation (hs-CRP≥1.0 mg/L) and 38.5 % of the subjects (N= 15, placebo, n= 5; Q10-300, n= 10) had a higher level of inflammation (hs-CRP≥ 3.0 mg/L) after surgery. After 12 weeks of coenzyme Q10 supplementation, the levels of hs-CRP and IL-6 were significantly decreased (Table 2), although the levels of inflammatory markers were not significantly lower compared to the placebo group and no significant association between the level of coenzyme Q10 and in-flammatory markers after intervention (Table 3). We failure to detect significant correlations between the
Table 3Correlations between coenzyme Q10 level and vitamin E, oxidative stress, antioxidant enzymes activity and inflammation in HCC patients after supplementation
Coenzyme Q10 level (μM)
ra(pvalues) vitamin E (μM) 0.30 (0.01)
Oxidative stress
MDA (μM) −0.43 (0.01)
Antioxidant enzymes activity
SOD (U/mg protein) 0.31 (0.01)
CAT (U/mg protein) 0.24 (< 0.05)
GPx (U/mg protein) 0.25 (0.04)
Inflammatory markers
hs-CRP (mg/L) 0.12 (0.49)
TNF-α(pg/mL) 0.01 (0.96)
IL-6 (pg/mL) 0.00 (0.99)
CATCatalase activity,MDAMalondialdehyde,GPxglutathione peroxidase,HCC
hepatocellular carcinoma,hs-CRPhigh sensitivity C-reactive protein,IL-6
interleukin-6,SODsuperoxide dismutase,TNF-αtumor necrosis factor-α
a
levels of coenzyme Q10 and inflammatory markers maybe due to higher variations of inflammation status in patients with HCC after surgery. Surgical resection is the most efficient treatment of patients with HCC. However, surgery may elicits the activation of the systemic inflammatory, endocrine/metabolic, and im-munological systems, which is referred to as the surgi-cal stress response [28]. However, Coenzyme Q10, as an antioxidant, could inhibit the inflammatory cascade of NF-κB -activation by the ROS [29–31]. Therefore, it
may be useful to decrease inflammation in patients with HCC after surgery through coenzyme Q10 to in-crease the antioxidant capacity, particularly those with a higher level of inflammation.
Regarding the safety of coenzyme Q10 supplementa-tion in the present study, there were no clinically signifi-cant changes in the subjects’vital signs, serum chemical values, or hematological values, and there were no ser-ious adverse events, no complaints of myalgia or muscle weakness, and no withdrawals due to adverse events.
Note that the level of GPT was significantly decreased after the coenzyme Q10 supplementation (data not shown, 55.5 ± 39.8 IU/L decreased to 49.1 ± 46.2 IU/L,p = 0.02) and that changes in the levels of coenzyme Q10 were significantly correlated with changes in the levels of GPT (data not shown, β= -10.09, p= 0.03). In addition to GPT, the level of high density lipoprotein-cholesterol (HDL-C) was significantly increased after the coenzyme Q10 supplementation (data not shown, 1.3 ± 0.3 mmol/L increased to 1.5 ± 0.4 mmol/L, p< 0.01). Thus, at a dose of 300 mg/d coenzyme Q10 is safe for patients with HCC, and it protects against cardiotoxicity or liver toxicity during cancer treatment [32]. Our study has two limitations should be mentioned. First, the num-ber of participants was small, although we did recruit more subjects than expected. Second, this study was de-signed for 12 weeks intervention only. Larger and longer intervention studies are needed to confirm the beneficial effect of coenzyme Q10 supplementation in patients with HCC after surgery.
Conclusion
In conclusion, this clinical study is the first to demonstrate that a dose of 300 mg/d of coenzyme Q10 supplementa-tion significantly increased antioxidant capacity and reduced the levels of inflammatory markers (hs-CRP and IL-6) in patients with HCC after surgery. We suggest that coenzyme Q10 supplementation could be considered as a complementary treatment strategy for patients with HCC after surgery, particularly those under higher levels of oxi-dative stress and inflammation.
Acknowledgments
We would like to express our sincere appreciation to the subjects for their participation and to Dr. Hsia, who kindly provided the coenzyme Q10 supplements for this trial. We thank the nurses at Taichung Veterans General Hospital and the technical advisor at the Taipei Institute of Pathology for providing expert assistance in blood sample collection and data analysis.
Funding
This study was supported by a grant from the Taichung Veterans General Hospital (TCVGH-1034601A and TCVGH-1044601A), Taiwan.
Availability of data and materials
This study acts as a pilot study for a larger study that will be performed. Data sets will be made available once the results of the larger study is published. However those who are interesting to get the data can contact PTL: [email protected] for further information.
Authors’contributions
HTL, YCH, and SBJ performed the study and the data analyses. YTH helped to perform out the study and sample analyses. PTL conceived of the study, participated in its design, and coordinated the study. HTL and PTL drafted the manuscript. All authors read and approved the final manuscript.
Competing interests
The authors declare that they have no competing interests.
Consent for publication Not applicable.
Ethics approval and consent to participate
This study was approved by the Institutional Review Board of Taichung Veterans General Hospital, Taiwan and each subject gave written informed consent before participating. All protocols and procedures were performed according to the Declaration of Helsinki. This study was registered under NCT01964001 at Clinicaltrials.gov.
Author details
1Graduate Program in Nutrition, Chung Shan Medical University, Taichung 40201, Taiwan.2Division of General Surgery, Department of Surgery, Taichung Veterans General Hospital, Taichung 40705, Taiwan.3Department of Nutrition, Chung Shan Medical University, Taichung 40201, Taiwan. 4Department of Nutrition, Chung Shan Medical University Hospital, Taichung 40201, Taiwan.
Received: 15 August 2016 Accepted: 3 October 2016
References
1. Stewart BW, Wild CP. World Cancer Report 2014. Geneva: IARC Nonserial Publication; 2014.
2. El-Serag HB. Hepatocellular carcinoma. N Engl J Med. 2011;365:1118–27. 3. Akinobu T, Kazuhide Y. Control of oxidative stress in hepatocellular
carcinoma: Helpful or harmful? World J Hepatol. 2015;7:968–79. 4. Muriel P. Role of free radicals in liver diseases. Hepatol Int. 2009;3:526–36. 5. Yahya RS, Ghanem OH, Foyouh AA, Atwa M, Enany SA. Role of interleukin-8
and oxidative stress in patients with hepatocellular carcinoma. Clin Lab. 2013;59:969–76.
6. Ernster L, Dallner G. Biochemical, physiological and medical aspects of ubiquinone function. Biochim Giophys Acta. 1995;1271:195–204. 7. Bhagavan HN, Chopra RK. Coenzyme Q10: absorption, tissue uptake,
metabolism and pharmacokinetics. Free Radic Res. 2006;40:445–53. 8. Alleva R, Tomasetti M, Battino M, Curatola G, Littarru GP, Folkers K. The roles
of coenzyme Q10 and vitamin E on the peroxidation of human low density lipoprotein subfractions. Proc Natl Acad Sci U S A. 1995;26:9388–91. 9. Singh U, Devaraj S, Jialal I. Coenzyme Q10 supplementation and heart
failure. Nutr Rev. 2007;1:286–93.
10. Fouad AA, Al-Mulhim AS, Jresat I. Therapeutic effect of coenzyme Q10 against experimentally-induced hepatocellular carcinoma in rats. Environ Toxicol Pharmacol. 2013;35:100–8.
11. Kim JM, Park E. Coenzyme Q10 attenuated DMH-induced precancerous lesions in SD rats. J Nutr Sci Vitaminol. 2010;56:139–44.
12. Karpińska J, MikołućB, Motkowski R, Piotrowska-Jastrzebska J. HPLC method for simultaneous determination of retinol, alpha-tocopherol and coenzyme Q10 in human plasma. J Pharm Biomed Anal. 2006;42:232–6.
13. Littarru GP, Mosca F, Fattorini D, Bompadre S. Method to assay coenzyme Q10 in blood plasma or blood serum. United State Patent. 2007; 7303921. https://patentimages.storage.googleapis.com/pdfs/6aadab0bc819eac3443b/ US7303921.pdf.
14. Botsoglou NA. Rapid, sensitive, and specific thiobarbituric acid method for measuring lipid peroxidation in animal tissue, food and feedstuff samples. J Agric Food Chem. 1994;42:1931–7.
15. Paglia D, Valentine W. Studies on the qualitative characterization of erythrocyte glutathione peroxidase. J Lab Clin Med. 1967;70:159–69. 16. Marklund S, Marklund G. Involvement of superoxide anion radical in
autoxidation of pyrogallol and a convenient assay for superoxide dismutase. Eur J Biochem. 1974;47:469–74.
17. Aebi H. Catalase in vitro. Methods Enzymol. 1984;105:121–6.
18. Sakano K, Takahashi M, Kitano M, Sugimura T, Wakabayashi K. Suppression of azoxymethane-induced colonic premalignant lesion formation by coenzyme Q10 in rats. Asian Pac J Cancer Prev. 2006;7:599–603. 19. Bahar M, Khaghani S, Pasalar P, Paknejad M, Khorramizadeh MR,
Khorramizadeh MR, Mirmiranpour H, Nejad SG. Exogenous coenzyme Q10 modulates MMP-2 activity in MCF-7 cell line as a breast cancer cellular model. Nutr J. 2010;9:62.
20 Lee BJ, Huang YC, Chen SJ, Lin PT. Coenzyme Q10 supplements reduce oxidative stress and increase activities of antioxidant enzymes in patients with coronary artery disease. Nutrition. 2012;28:250–5.
protein, interleukin-6 and homocysteine) in patients with coronary artery. Nutrition. 2012;28:767–72.
22 Lee BJ, Tseng YF, Yen CH, Lin PT. Effects of coenzyme Q10 supplementation (300 mg/day) on antioxidation and anti-inflammation in coronary artery disease patients during statins therapy: a randomized, placebo-controlled trial. Nutr J. 2013;12:142.
23 Molyneux SL, Young JM, Florkowski CM, Lever M, Georgr PM. Coenzyme Q10: Is there a clinical role and a case for measurement? Clin Biochem Rev. 2008;29:71–82.
24 Stoyanovsky DA, Osipov AN, Quinn PJ, Kagan VE. Ubiquinone-dependent recycling of vitamin E radicals by superoxide. Arch Biochem Biophys. 1995; 323:343–51.
25 Lass A, Sohal RS. Electron transport-linked ubiquinone-dependent recycling ofα-tocopherol inhibits autooxidation of mitochondrial membranes. Arch Biochem Biophys. 1998;352:229–36.
26 Bosch FX, Ribes J, Borràs J. Epidemiology of primary liver cancer. Semin Liver Dis. 1999;19:271–85.
27 Boltjes A, Movita D, Boonstra A, Woltman AM. The role of Kupffer cells in hepatitis B and hepatitis C virus infections. J Hepatol. 2014;61:660–71. 28 Kücükakin B, Gögenur I, Reiter RJ, Rosenberg J. Oxidative stress in relation to
surgery: is there a role for the antioxidant melatonin? J Surg Res. 2009;152: 338–47.
29 Schmelzer C, Lindner I, Rimbach G, Niklowitz P, Menke T, Döring F. Functions of coenzyme Q10 in inflammation and gene expression. Biofactors. 2008;32:179–83.
30 Schmelzer C, Lorenz G, Rinbach G, Doring F. In vitro effects of the reduced form of coenzyme Q(10) on secretion levels of TNF-alpha and chemokines in response to LPS in the human monocytic cell line THP-1. J Clin Biochem Nutr. 2009;44:62–6.
31 Zhang YP, Eber A, Yuan Y, Yang Z, Rodriguez Y, Levitt RC, Takacs P, Candiotti KA. Prophylactic and antinociceptive effects of coenzyme Q10 on diabetic neuropathic pain in a mouse model of type 1 diabetes. Anesthesiology. 2013;118:945–54.
32 Roffe L, Schmidt K, Ernst E. Efficacy of coenzyme Q10 for improved tolerability of cancer treatments: a systematic review. J Clin Oncol. 2004;22: 4418–24.
• We accept pre-submission inquiries
• Our selector tool helps you to find the most relevant journal
• We provide round the clock customer support
• Convenient online submission
• Thorough peer review
• Inclusion in PubMed and all major indexing services
• Maximum visibility for your research
Submit your manuscript at www.biomedcentral.com/submit