Multimodal neuroimaging computing: the workflows, methods,
and platforms
Sidong Liu
•Weidong Cai
•Siqi Liu
•Fan Zhang
•Michael Fulham
•Dagan Feng
•Sonia Pujol
•Ron Kikinis
Received: 29 July 2015 / Accepted: 20 August 2015 / Published online: 4 September 2015 ÓThe Author(s) 2015. This article is published with open access at Springerlink.com
Abstract
The last two decades have witnessed the
explosive growth in the development and use of
noninva-sive neuroimaging technologies that advance the research
on human brain under normal and pathological conditions.
Multimodal neuroimaging has become a major driver of
current neuroimaging research due to the recognition of the
clinical benefits of multimodal data, and the better access
to hybrid devices. Multimodal neuroimaging computing is
very challenging, and requires sophisticated computing to
address the variations in spatiotemporal resolution and
merge the biophysical/biochemical information. We review
the current workflows and methods for multimodal
neu-roimaging computing, and also demonstrate how to
con-duct
research
using
the
established
neuroimaging
computing packages and platforms.
Keywords
Multimodal
Neuroimaging
Medical image
computing
1 Introduction
Neuroimaging has profoundly advanced neuroscience
research and clinical care rapidly in the past two decades,
prominently by magnetic resonance imaging (MRI),
com-plemented positron emission tomography (PET), and
electroencephalography
(EEG)/magnetoencephalography
(MEG). The art of neuroimaging today is shaped by three
concurrent, interlinked technological developments [
1
]:
Data Acquisition
The advances of imaging
instrumen-tation have enabled digital image acquisition, as well as
electronic data storage and communication systems, such
as the picture archiving and communication system
(PACS). These imaging systems, CT, MRI and PET
showed obvious clinical benefits by providing high contrast
tissue differentiation. The previous film-based reading was
replaced by the electronic displays (axial, coronal and
sagittal planes of the volume) without losing diagnostic
quality.
Medical Image Computing
The growth of neuroimaging
has spurred a parallel development of neuroimaging
com-puting methods and workflows, including bias correction,
registration, segmentation, information extraction and
visualization. We should note the difference between
neuroimaging and neuroimaging computing.
Neuroimag-ing focuses on the image acquisition, capturNeuroimag-ing the
snap-shot of the brain; whereas neuroimaging computing focuses
on the computational analysis of the brain images,
extracting and enhancing the information of relevance to
best describe the brain anatomy and function.
Package and Platform Development
To fit into research
and clinical timelines and facilitate translational medicine,
the neuroimaging computing methods and workflows are
often integrated into software packages. Many such
pack-ages were added to imaging systems by the major vendors
S. Liu (&)W. CaiS. LiuF. ZhangD. FengSchool of IT, The University of Sydney, Sydney, Australia e-mail: [email protected]
F. ZhangS. PujolR. Kikinis
Surgical Planning Laboratory, Harvard Medical School, Boston, USA
M. Fulham
Department of PET and Nuclear Medicine, Royal Prince Alfred Hospital, Sydney Medical School, The University of Sydney, Sydney, Australia
D. Feng
Med-X Research Institute, Shanghai Jiao Tong University, Shanghai, China
of medical imaging equipment and many specialized
companies. However, a greater number of neuroimaging
computing packages and platforms are free and
open-source, designed and supported by the medical imaging
research groups and communities.
Multimodal neuroimaging, i.e., the simultaneous
imag-ing measurement (EEG/fMRI [
2
], PET/CT [
3
]) or
sum-mation of separate measurement (PET and sMRI [
4
], sMRI
and dMRI [
5
], fMRI and dMRI [
6
]), has become an
emerging research area due to better access to imaging
devices, especially the hybrid systems, such as PET/CT [
7
,
8
] and PET/MR [
9
]. The recent advances in neuroimaging
computing methods also enabled joint analysis of the
multimodal data. The free and open-source software
(FOSS) packages and platforms for neuroimaging
com-puting further facilitate the translation of the multimodal
neuroimaging research from the lab to better clinical care.
Multimodal neuroimaging advances the neuroscience
research by overcoming the limits of individual imaging
modalities and by identifying the associations of findings
from different imaging sources. Multimodal neuroimaging
has been used to investigate a multitude of populations and
disorders, such as Alzheimer’s disease (AD) [
4
,
10
–
12
],
schizophrenia [
13
–
16
], epilepsy [
3
,
17
–
19
],
obsessive-compulsive disorder (OCD) [
20
–
22
], bipolar disorder [
23
,
24
], attention-deficit hyperactivity disorder (ADHD) [
25
–
27
], Autism spectrum disorder (ASD) [
28
–
30
], traumatic
brain injury (TBI) [
31
–
34
], stroke [
35
,
36
], multiple
scle-rosis (MS) [
37
–
39
], and brain tumors [
9
,
40
–
42
]. We have
recently reviewed advances in neuroimaging technologies
and the applications of multimodal neuroimaging in these
neuropsychiatric disorders [
43
]. Multimodal neuroimaging
has also been used in many non-clinical applications, such
as building brain machine interface (BMI) [
44
], tracing
neural activity pathways [
45
] and mapping mind and
behavior to brain anatomy [
46
–
48
].
Multimodal neuroimaging computing is a very
chal-lenging task due to large inter-modality variations in
spa-tiotemporal
resolution,
and
biophysical/biochemical
mechanism. Compared to single imaging modality
com-puting, it requires more sophisticated bias correction,
co-registration, segmentation,
feature extraction, pattern
analysis, and visualization. Various methods for
neu-roimaging analysis have been proposed, and many have
been integrated into the task-oriented packages or
inte-grated platforms.
In this paper, we review the state-of-the-art methods and
workflows for both modality-specific neuroimaging
com-puting and multimodal neuroimaging comcom-puting, and
demonstrate how to conduct multimodal neuroimaging
research using the established packages and platforms.
Fig.
1
provides an overview of the current status and
illus-trates the major components of neuroimaging computing,
including
neuroimaging
modalities,
modality-specific
computing workflows (a series of tasks), multimodal
puting methods, algorithms, packages, platforms and
com-munities. MRI, PET, EEG/MEG and their computing
workflows and methods are discussed in this review. A
neuroimaging computing task in an analysis workflow may
be fulfilled by multiple algorithms, and the most widely used
algorithms, e.g., voxel-based morphometry (VBM) [
49
], are
often integrated into software packages, e.g., Statistical
Parametric Mapping (SPM)
1, FMRIB Software Library
(FSL)
2, and Neurostat
3. The new imaging tasks also demand
the refinement of existing algorithms and development of
new algorithms. Similar algorithms are often developed
independently in different labs, sometimes with little
awareness of existing packages/platforms.
This paper is organized as follows. In Sect.
2
, we
elaborate the computing workflows, which consist of a
number of specific tasks, for individual modalities. In
Sect.
3
, we review the major multimodal neuroimaging
computing methods, i.e., registration, segmentation, feature
integration, pattern analysis and visualization. In Sect.
4
,
we introduce the task-oriented packages and platforms for
the tasks mentioned in previous sections. We focus on the
free and open source software (FOSS) in this review, since
they could help to better realize the quickly evolved
methods and workflows than their commercial
counter-parts, and thus accelerate translational medicine. For the
sake of clarity and precision, the algorithms, packages and
platforms are not described in detail, but we refer the
interested readers to more specific papers instead. In
Sect.
5
, we give one example of brain tumor surgical
planning using the established packages and platforms.
Lastly, we outline the future directions of multimodal
computing in Sect.
6
.
2 Modality-specific neuroimaging computing
workflows
2.1 Bias and artifacts correction
Different neuroimaging techniques have different
spa-tiotemporal
resolutions,
and
biophysical/biochemical
c
Fig. 1 Overview of the current status and major components of multimodal neuroimaging computing, including neuroimaging modalities, modality-specific computing workflows, multimodal computing methods, algorithms, task-oriented packages, all-inte-grated platforms, and neuroimaging research communities
1 www.fil.ion.ucl.ac.uk/spm.
2 www.fmrib.ox.ac.uk/fsl.
3 http://128.208.140.75/
MRTrix
sMRI dMRI fMRI PET EEG / MEG
Feature Selection
Multi-Dimensional Visualization
3D Slicer
MIPAV BrainVisa
MITK All Integrated
Platforms
Camino
DTI-TK Diffusion Tensor
Analysis
Modalities
Bias and Artifacts Correction
Skull Stripping
Tissue / ROI Segmentation
Modality-Specific Computing Workflows
Surface Reconstruction
Tensor / ODF
Estimation Spatial Normalization
Fiber Tracking
Connectome
Packages & Platforms
Atlas Inverse Mapping
Multi-Atlas Labeling Rigid
Registration
Affine Registration
Deformable Registration
Feature Embedding
Interactive Visualization Spatial Smoothing
Registration Visualization
Functional MRI Analysis
AFNI
Classification
Regression
PyMVPA
FOSS and Data Sharing
INCF NITRC NIPY NeuroDebian
Brain Morphometry
Features Fusion
FOSS Development TrackVis
Source Reconstruction
DSI Studio
Communities
Joint Feature Learning
Time / Frequency Analysis
BrainSuite
REST
EEGLAB MNE
ERP / ERF Analysis
Parametric Map Reconstruction
Parameter Estimation
Manual / Semi-Auto Outlining
s i s y l a n A n r e t t a P n
o i t a t n e m g e S
Task-Oriented Packages Algorithms
Simulation Image Markup & Annotation
Multimodal Computing Methods
Functional Brain Mapping
eConnectome
Connec tome
NA-MIC
ITK-SNAP
BioImage Suite Registration &
Segmentation
IRTK
MindBoggle FSL
Multifunctional Packages
FreeSurfer SPM
ANTs
NifTK
MEG / EEG Analysis
… …
mechanisms, and thereby require different computing
workflows; yet a common step of all workflows is the
correction of bias and artifacts in neuroimaging data. The
main goal of this task is to remove the data components
that contaminate the signals. Tustison recently provided a
set of guidelines for managing the instrumental bias when
designing and reporting neuroimaging studies [
50
].
Bias and artifacts in neuroimaging signals may result
from imaging systems, environment, and body motion.
Many biases and artifacts are induced by the imaging
systems, e.g. inhomogeneous radio frequency (RF) coils in
MRI, contrast agents in PET/CT, broken or saturated
sen-sors in EEG/MEG system. Environment-related artifacts,
arising from generators of magnetic fields outside the
human body such as magnetic noise from power lines and
other environmental noise sources, such as elevators, air
conditioners, nearby traffic, mechanical vibrations
trans-mitted to shielded room, bed vibration, and pulsation [
51
].
Motion-related artifacts are caused by eye movements,
head movements, cardiac and muscular activity, and
res-piratory motion. The motion of magnetic implements, such
as pacemakers and implantable defibrillators [
52
] may also
give rise to artifacts, and may cause danger to patients in
strong magnetic field, although there are new MRI
com-patible pacemakers/defibrillators that have been introduced
[
53
].
The bias and artifacts in MRI are mainly system-related,
e.g., RF inhomogeneity causing slice and volume intensity
inconsistency. The nonparametric nonuniformity
normal-ization (N3) algorithm and its variant based on Insight
Toolkit [
54
,
55
] (N4ITK) [
56
] are the
de facto
standard in
this area. The acquisition protocols for dMRI are inherently
complex, which require fast gradient switching in
Echo-Planar Imaging (EPI) and longer scanning time. dMRI is
prone to many other types of artifacts, such as eddy current,
motion artifacts and gradient-wise inconsistencies [
57
].
Tortoise [
58
] and FSL diffusion toolbox (FDT) [
59
] are
popular choices for eddy current correction and motion
correction in dMRI data, and the recently proposed
DTI-Prep [
60
] offers a thorough solution for all known data
quality problems of dMRI. Motion is a serious issue in
fMRI, and may lead to voxel displacements in serial fMRI
volumes and between slices. Therefore, serial realignment
and slice timing correction is required to eliminate the
effects of head motion during the scanning session. Linear
transformation is usually sufficient for serial alignment,
whereas a non-linear auto-regression model is often used
for slice timing correction [
61
]. These two types of
cor-rection are commonly performed using SPM and FSL.
Dedicated PET scanners have been replaced by the hybrid
PET/CT systems [
62
]. The most commonly seen artifacts
on PET/CT are mismatches between CT and PET images
caused by body motion due to the long acquisition time of
the scan. Metallic implants and contrast agents may also
give rise to artifacts on PET/CT, usually leading to
over-estimation of PET attenuation coefficients and
false-posi-tive findings [
63
]. Knowledge and experience are needed to
minimize these artifacts and, in that way, produce
better-quality PET/CT images. EEG and MEG signals are often
contaminated by all of the three types of artifacts, such as
the system-related superconducting quantum interference
device (SQUID) jumps, and the noise from the
environ-ment or body motion [
51
]. Visual checks and manual
removal are usually required to exclude the artifacts.
Another strategy uses signal-processing methods to reduce
artifacts while preserving the signal. Linear transformation,
e.g., principal component analysis (PCA) and independent
component analysis (ICA) [
64
,
65
], and regression, e.g.,
signal space projection (SSP) and signal space separation
(SSS) [
66
,
67
], are frequently applied to the raw EEG/
MEG data.
2.2 Structural MRI computing
The sMRI computing workflows usually involve skull
striping, tissue and region of interest (ROI) segmentation,
surface reconstruction [
68
], and can include brain
mor-phometry analysis, such as the voxel-based mormor-phometry
(VBM)/tensor-based morphometry
(TBM)/deformation-based morphometry (DBM) [
49
], and surface-based
mor-phometry (SBM) [
69
] by comparing one group of subjects
to another or tracking the changes over a sequence of
observations for the same subject. FreeSurfer [
70
] is a
well-established tool for brain tissue segmentation and surface
reconstruction. When registered into a standard brain
space, e.g., the Talariach coordinates [
71
] and MNI
coor-dinates [
72
], and labeled with different regions of interest
(ROIs) using brain templates, e.g., ICBM template [
73
] and
the AAL template [
74
], the sMRI datasets can further be
analyzed at the ROI level. Various techniques have been
investigated to quantitatively analyze the morphological
changes in cortex, e.g., grey matter density [
49
], cortical
folding [
75
], curvedness and shape index [
76
,
77
], cortical
thickness [
69
], and surface area [
78
,
79
], local gyrification
index (LGI) [
75
], and many other shape [
78
,
80
] or texture
features [
81
–
83
]. Mangin et al. [
84
] provided an extensive
review on the popular morphological features, and Winkler
et al. [
85
] demonstrated how to use these features in
imaging genetics.
2.3 Diffusion MRI computing
local white matter morphometry and probe the white matter
fiber tracts in the following steps. Advanced fiber
orienta-tion estimaorienta-tion methods include the ball and stick mixture
models [
59
], the constrained spherical deconvolution
(CSD) [
86
], the q-ball imaging (QBI) [
87
], diffusion
spectral imaging (DSI) [
88
], the generalized q-sampling
imaging (GQI) [
89
], and the QBI with Funk Radon and
Cosine Transform (FRACT) [
90
]. Wilkins et al. have
provided a detailed comparison of these models [
91
]. In the
second step, various parametric maps based on the tensors/
ODFs, i.e., fractional anisotropy (FA), mean diffusivity
(MD), radial diffusivity (RD), and axial diffusivity (AXD)
maps [
92
], reveal the focal morphometry of the white
matter [
93
]. The third step is to apply the fiber tracking
algorithms [
94
] to construct 3D models of the white matter
tracts, referred to as tractography. Tractography further
enables the quantitative analysis of fiber tract morphometry
i.e., orientation and dispersion [
95
], and the analysis of
connectome, i.e., connectivity networks of populations of
neurons [
96
]. Brain parcellation and fiber clustering are
two major approaches that can separate the neurons into
different groups/ROIs, and construct the connectome [
97
].
Jones et al. [
98
] recently provided a set of guidelines which
define the good practice in dMRI computing.
2.4 Functional MRI computing
After bias and artifacts correction in fMRI, a mean image
of the series, or a co-registered anatomical image, e.g.,
sMRI, is used to estimate some registration coefficients that
map it onto a template, followed by spatial smoothing and
parameter estimation. Friston [
99
] gave an introduction to
these procedures. When the brain is performing a task,
cerebral blood flow (CBF) usually changes as neurons
work to complete the task. The primary use of task-evoked
fMRI is to identify the correlation between brain activation
pattern and brain functions, such as perception, language,
memory, emotion and thought [
100
,
101
]. Many models
and methods have been suggested to detect patterns of
brain activation, and some of them have been integrated
into the software packages, such as the general linear
model (GLM) in the SPM and FSL packages, and
inde-pendent component analysis (ICA)/canonical correlation
analysis (CCA) in AFNI package
4. When brain is at resting
state, fMRI is used to detect the spontaneous activation
pattern in the absence of an explicit task or stimuli [
102
].
Resting-state fMRI enables us to deduce the functional
connectivity between dispersed brain regions, which form
functional brain networks, or resting state networks
(RSNs). The Default Mode Network (DMN) is a functional
network of several brain regions that show increased
activity at rest and decreased activity when performing a
task [
103
]. DMN has been widely used as a measure to
compare individual differences in behavior, genetics and
neuropathologies, although its use as a biomarker is
con-troversial [
104
,
105
]. Rubinov [
106
] provided a review of
the connectivity measures.
2.5 PET computing
The computing of PET also requires spatial normalization
and smoothing, and parameter estimation, similar to fMRI.
SPM and Neurostat packages are available for
voxel-by-voxel PET analysis. PET functional features are generally
pertaining to the radioactive tracers, reflecting particular
biochemical
process.
2-[
18F
fluoro-2-deoxy-D-glucose
(FDG) is the most widely used tracer to depict glucose
metabolism.
Several
amyloid-binding
compounds,
18F-BAY94-9172,
11C-SB-13,
11C-BF-227,
18F-AV-45 and
11C-Pittsburgh compound B
(
11C-PiB), have been reported
as tracers for imaging amyloid plaques in AD. A number of
extensive surveys have been conducted on these amyloid
radioactive tracers [
107
–
110
]. A variety of static and
kinetic parameters can be extracted from the PET data, i.e.
the standard uptake value (SUV) [
111
,
112
], cerebral
metabolic rate of glucose consumption (CMRGlc) [
81
,
113
], mean index [
114
], z-scores [
115
], hypo-metabolic
convergence index (HCI) and amyloid convergence index
(ACI) [
116
], tissue time activity curve (TTAC) [
117
], and
difference-of-Gaussian (DoG) parametric maps [
118
].
2.6 EEG and MEG computing
In EEG and MEG there are usually four components after
removing the artifacts or unwanted data components that
contaminate the signals. The analysis of event-related
potentials (ERP) in EEG or event-related fields (ERF) in
MEG aims to analyze brain responses that are evoked by a
stimulus or an action, followed by spectral analysis, which
transforms the signals into time-frequency domain. The
aim of source reconstruction is to localize the neural
sources underlying the signals measured at the sensor level.
MRI is usually used to provide anatomical reference for
source reconstruction. The aim of connectome analysis is
to investigate the causality of brain activities and
connec-tivity of brain networks by exploring information flow and
interaction between brain regions. Gross et al. provided
basic guidelines on EEG and MEG in research [
51
]. MNE
5,
EEGLAB
6and eConnectome
7are the most widely used
4 http://afni.nimh.nih.gov/.
5 http://martinos.org/mne/.
6 http://sccn.ucsd.edu/eeglab/.
software packages specifically designed for EEG and MEG
computing.
3 Multimodal neuroimaging computing methods
3.1 Registration
Registration is the most commonly used technique in a
neuroimaging study, and it finds the spatial relationship
between two or more images, e.g., multimodal
neu-roimaging data alignment, serial alignment, and atlas
mapping. A registration method can be defined in five
aspects, i.e., a cost function for evaluating the similarity
between images, a transformation model to determine the
degree-of-freedom (DOF) of the deformation, an
opti-mization method for minimizing the cost function, a
sam-pling and interpolation strategy for computation of the cost
function, and a multi-resolution scheme for controlling the
coarseness of the deformation [
119
].
Registration methods can be roughly classified into three
categories according to the DOF of their transformation
models. Rigid registration has a DOF of 6 and allows for
global translations and rotations. Affine registration, i.e.,
linear registration, allows for translation, rotation, scaling
and skew of the images. Rigid and affine registration
methods are usually sufficient for registering the
multi-modal datasets of same subject. However, deformable
registration, which supports local deformations, is
fre-quently needed to register images with large differences,
e.g., registering an image to a template, or registering
pre-and post-contrast images of the same subject. Deformable
registration always requires rigid or affine registration to
obtain a rough initial alignment. In many multimodal
studies, a combination of these registration methods were
used. For example, we recently jointly analyzed the ADNI
FDG-PET and T1-weighted MRI datasets to classify AD
and mild cognitive impairment (MCI) patients [
79
]. The
PET images were aligned to MRI using an affine
regis-tration method (FSL FLIRT) [
120
]. The MRI datasets were
registered to the MNI template using a deformable method
(IRTK) [
121
], and the output registration coefficients by
IRTK were applied to register the PET images to the same
template. There are many other widely used registration
algorithms, such as B-Spline registration [
119
,
122
],
Demons [
123
], and SyN [
124
], and ITK [
54
] registration
framework is a standard-bearer for all of these popular
registration methods.
3.2 Segmentation
Segmentation is also referred to as brain parcellation or
labeling. The brain can be segmented at different levels,
i.e., tissues (grey matter, white matter, cerebrospinal fluid),
cortical regions, and sub-cortical regions. The
segmenta-tion methods can be classified into three categories [
125
].
The first category is manual and semi-automatic methods,
which require manually outlining the brain regions
according to a protocol [
126
,
127
] or labeling the
land-marks or seed points [
128
,
129
]. These methods are
labour-intensive and prone to intra- and inter-operator variation.
The second category is the atlas inverse mapping
methods, which can inversely map a labeled atlas, e.g., the
standard ICBM and AAL template, or user-defined image,
to the original image space. Yao et al. recently provided a
review of popular brain atlases [
130
]. Atlas inverse
map-ping is simple, but its performance heavily depends on the
selected atlas and mapping method.
A more robust but complex solution is multi-atlas
labeling,
including
the
multi-atlas
propagation with
enhanced registration (MAPER) [
131
] and its variants
[
132
,
133
]. These methods carry out whole-brain
seg-mentation in the original image space by fusing multiple
labeling results derived from the multiple atlases.
Multi-atlas labeling is computationally expensive, but the
per-formance is comparable to manual labeling [
125
]. FSL
FAST
8and NifSeg
9are widely used for brain tissue
seg-mentation.
IRTK,
Advanced
Normalization
Tools
(ANTs)
10and NifReg
11are commonly used in multi-atlas
labeling as the normalization tools.
3.3 Feature fusion
Various features can be extracted from the neuroimaging
data, as described in Sect.
2
. Feature fusion is needed to
jointly analyze the features from multimodal data. A
straightforward solution is to concatenate input multi-view
features into a high-dimensional vector, and then apply
feature
selection
methods,
such
as
t-test
[
134
],
ANOVA [
118
], Elastic Net [
10
,
135
], lasso [
136
] or a
combination of these methods [
137
,
138
], to reduce the
’curse of dimensionality’.
These methods show promising results. However, the
inter-subject variations cannot be eliminated using the
concatenation methods because the inter-subject distances
measured by different features may have different scales
and variations. With a focus on the subjects, the feature
embedding methods, such as multi-view spectral
embed-ding (MSE) [
139
] and multi-view local linear embedding
(MLLE) [
140
], have been used to explore the geometric
structures of local patches in multiple feature spaces and
8 http://fsl.fmrib.ox.ac.uk/fsl/fslwiki/FAST.
9 http://cmictig.cs.ucl.ac.uk/wiki/index.php/NiftySeg.
10 http://stnava.github.io/ANTs/.
align the local patches in a unified feature space with
maximum preservation of the geometric relationships.
In addition, machine learning, especially deep learning,
is increasingly used to extract high-level features from
neuroimaging data. The advantage of learning-based
fea-tures is they do not depend on prior knowledge of the
disorder or imaging characteristics as the hand-engineered
features. They are also essentially suitable for multimodal
feature learning, and could expect better performance with
larger datasets. However, learning-based features heavily
depend on the training datasets [
141
]. Recently, Suk et al.
[
142
] proposed a feature representation learning framework
for multimodal neuroimaging data. One stacked
auto-en-coder (SAE) was trained for each modality, then the learnt
high-level features were further fused with a multi-kernel
support vector machine (MK-SVM). They further proposed
another deep learning framework based on the deep
Boltzmann machine (DBM) and trained it using the 3D
patches extracted from the multimodal data [
143
].
3.4 Pattern analysis
Pattern analysis aims to deduce the patterns of disease
pathologies, sensorimotor or cognitive functions in the
brain and identify the associated regionally specific effects.
A substantial proportion of pattern analysis methods
focused on classification of different groups of subjects,
e.g., distinguishing AD patients from normal controls [
10
,
138
]. Hinrichs et al. [
144
,
145
] and Zhang et al. [
4
] recently
proposed the multi-kernel support vector machine
(MK-SVM) algorithm, which is based on multi-kernel learning
and extends the kernel tricks in SVM to the multiple
fea-ture spaces. We previously proposed a multifold Bayesian
kernelization (MBK) model [
79
] to transfer the features
into diagnosis probability distribution functions (PDFs),
and then merge the PDFs instead of the feature spaces.
Regression-based pattern analysis is often used to
identify the biomarkers of a group of subjects and probe the
boundaries between different groups. The multimodal
biomarkers can be based on the voxel features, ROI
fea-tures and other feafea-tures, as described in Sect.
2
.
Regres-sion, such as Softmax regression [
10
], Elastic Net [
135
],
and lasso [
136
] can be combined with feature learning in a
unified framework.
Recently, the pattern analysis methods have been
extended to simulation of future brain development based
on the previous states of the brain and comparison to other
brains. The basic assumption is that brains with similar
cross-sectional and longitudinal deformations would have
similar follow-up development [
146
,
147
]. When the
population is sufficiently large to include a majority of
neurodegenerative changes, the simulated results are more
accurate.
3.5 Visualization
The neuroimaging data are mainly 2D and 3D, thus can be
visualized in multi-dimensional spaces with 2D and 3D
viewers. Multimodal data in 2D space are usually displayed
with three layers, including background, foreground and
label maps. The 3D viewer enables visualization of volume
data, such as volume renderings, triangulated surface
models and fiber tracts. Basic image visualization
func-tions, such as look up tables, zoom, window / level, pan,
multi-planar reformat, crosshairs, and synchronous pan /
scroll for linked viewers, have been implemented in most
visualization platforms, such as Slicer
12and BioImage
Suite
13. These platforms also can accommodate
visualiza-tion of high-dimensional data, e.g., tensors and vector
fields.
Image markup refers to the graphical elements overlay,
such as fiducials (points), rulers, bounding boxes, and label
maps. Image annotation refers to the text-based
informa-tion [
148
]. Both image markups and annotations are used to
describe the meta information of the images, and
annota-tions can be associated with markup elements as free text.
Another important use of the image markups is
inter-active visualization. The aforementioned platforms also
provide a graphical user interface to interact with the data.
For example, the volume rendering module of Slicer allows
the users to define a bounding box and visualize the content
in the bounding box only. Another module, tractography
interactive seeding, is designed for interactive seeding of
DTI fiber tracts passing through a list of fiducials or
ver-tices of a 3D model. Slicer also allows the configuration of
the layouts and manipulation of content in the viewers to
suit a specific use case.
4 FOSS packages and platforms
4.1 Task-oriented packages
The FOSS packages for neuroimaging computing are
usually initially designed for a single task, such as
regis-tration and segmentation, and some of them then are
extended to related tasks and become multifunctional
packages. A number of the most widely used FOSS
packages are listed in Fig.
1
—packages and platforms.
Popular multifunctional packages include FreeSurfer,
FSL, SPM, ANTs and NifTK. They cover similar aspects
of functionality, but all have particular strengths.
Free-Surfer and FSL provide a comprehensive solution of
analysis tools for fMRI, sMRI and dMRI data. SPM is
12 http://www.slicer.org/.
designed for the analysis of fMRI, PET, SPECT, EEG and
MEG. The recently developed ANTs and NifTK are useful
for managing, interpreting and visualizing multimodal
data, and represent the state-of-the-art in medical image
registration and segmentation. Tustison et al. [
149
] recently
compared ANTs and FreeSurfer in a large-scale evaluation
of cortical thickness measurements. Other packages may
focus on a specific task or a set of related tasks. IRTK
14,
BRAINs [
150
], BrainVisa
15, ITK-SNAP
16and
MindBog-gle
17are popular choices for registration and segmentation.
In dMRI analysis, Camino
18, DTI-TK
19, DSI Studio
20,
TrackVis
21and MRTrix
22are most widely used packages.
Soares et al. [
151
] recently conducted a thorough
evalua-tion of these packages and the other dMRI computing
packages in published studies. In functional neuroimaging
computing, AFNI, PyMVPA
23and REST
24are widely
used for fMRI analysis, whereas MNE, EEGLAB,
eCon-nectome for EEG/MEG analysis.
4.2 All integrated platforms
For clinical applications, the medical image computing and
visualization functions are part of the operation system and
must meet the same standards of reliability, robustness, and
simplicity of operation as the core imaging equipment.
This is usually accomplished using software platforms
added onto imaging system by the major vendors of
medical image equipment and many specialized
compa-nies. Examples include Advantage Windows (General
Electric), Syngo Via (Siemens), Vital Image Vitrea
(Toshiba), Visage Amira (Visage
Imaging),
PMOD
(PMOD Technologies Ltd.), Definiens (Definiens Inc.), and
MimVista (MIM Software Inc.). These packages provide
users with a set of analysis tools, compatibility with PACS
and customer support. Such clinically oriented systems are
not always affordable for academic researchers.
Commer-cial solutions are typically not extensible by the end user,
nor oriented towards prototyping of new tools, and may
require specialized hardware, thereby limiting their
appli-cability in projects that involve the development of new
image computing methods.
As opposed to the commercial platforms, FOSS
plat-forms are meant to provide a research platform that is
freely available and does not require specialized hardware.
A key step in the evolution of today’s flexible and
sophisticated capabilities for image-data-based research
medicine was the creation of the 3D Slicer, which is based
on a modular architecture [
1
,
152
]. 3D Slicer has become a
successful and long-lived platform for the effective use of
volumetric images in clinical research and procedure
development. There are a number of platforms which aim
to cover similar aspects of functionality, e.g., BioImage
Suite, BrainSuite
25, MIPAV
26and MITK
27.
Some of the libraries contributing to the foundation of
Slicer were designed in close collaboration and often share
the same developer community. These libraries, including
CMake, ITK, VTK and CTK, are distributed as part of the
National Alliance for Medical Image Computing
(NA-MIC) Kit [
153
], which are actively supported by the
NA-MIC research community
28. Many popular packages, e.g.,
ANTs, MindBoggle, ITK-SNAP, DTIPrep, and MITK are
also based on the NA-MIC Kit. NIPY
29and NeuroDebian
30are another two major research communities for
neu-roimaging research and platform development. To promote
open science, neuroimaging tools and resources are always
shared to other community members, usually through the
INCF
31and NITRC
32forums.
5 Example: surgical planning for brain tumor resection
Tractography derived from dMRI has great potential to
help neurosurgeons determine tumor resection boundaries
in functional areas involving eloquent white matter fibers.
The MICCAI DTI Challenge
33is dedicated to comparing
different fiber-tracking algorithms in reconstruction of
white matter tracts, such as peritumoral tracts and
cere-brospinal tract (CST). In this section, we present an
example of pre-operative planning for brain tumor
resec-tion using the sMRI and dMRI data. The original data
consist of a DWI volume and two structure scans of a
patient with meningioma. The DWI scan was acquired with
a spin-echo EPI sequence with the following parameters:
voxel size 2.2
2.2
2.2 mm, FOV 220 mm, 58 slices,
14https://www.doc.ic.ac.uk/
*dr/software/.
15http://brainvisa.info/.
16http://www.itksnap.org/.
17http://www.mindboggle.info/.
18http://cmic.cs.ucl.ac.uk/camino/.
19http://dti-tk.sourceforge.net/.
20http://dsi-studio.labsolver.org/.
21http://trackvis.org/.
22https://github.com/MRtrix3.
23http://www.pymvpa.org/.
24http://restfmri.net/.
25 http://brainsuite.org/.
26 http://mipav.cit.nih.gov/.
27 http://mitk.org/wiki/MITK.
28 http://www.na-mic.org/.
29 http://nipy.org/.
30 http://neuro.debian.net/.
31 http://www.incf.org/.
32 http://www.nitrc.org/.
b-value 1000 s/mm
2, 30 diffusion-weighted volumes and 1
baseline volume. The T1 original was acquired using a Ax
3D T1 MPRAGE sequence. The T2 original was acquired
using a Ax 3D SPACE sequence.
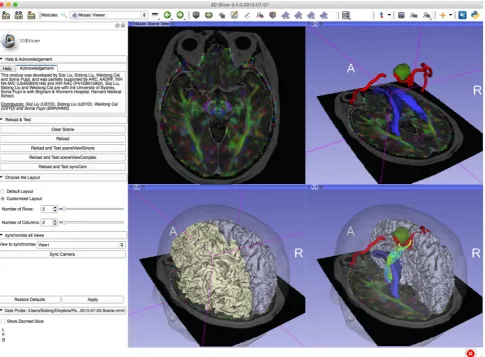
The original data were computed in four steps, as
illustrated in Fig.
2
. For dMRI-specific computing, the
tensors were estimated using a weighted least square
(WLS) algorithm, and the output is a DTI volume. We then
registered the T1 and T2 MRI volumes to baseline volume
using the affine registration algorithm. The registered T1
and T2 volumes were used as the anatomical references.
For sMRI-specific computing, tumor, ventricle and motor
cortex were manually seeded and semi-automatically
labeled in the baseline volume. The label map of the tumor
and ventricle were than used to generate the 3D surface
model using the Model Maker module in Slicer. The head
surface, pial surface and white matter surfaces for both
hemisphere were reconstructed using the Morphologist
2013 pipeline in BrainVisa [
68
]. For multimodal
comput-ing, the white matter tracts were visualized using the Slicer
Tractography Interactive Seeding module, which allows
users to mark the image with fiducials, and then move it
around the tumor to visualize the peritumoral fiber tracts.
6 Future directions
The neuroimaging techniques will keep advancing rapidly,
towards
higher
spatial/temporal/angular
resolutions,
shorter scanning time, and greater image contrast. In
par-ticular, the advances in the hybrid imaging scanners, e.g.,
PET/CT and PET/MRI, will enter more clinics and
Fig. 2 Experimental visualization of brain tumor case of DTI Challenge 2015 using 3D Slicer. Thepanel on the leftshows the GUI of the Slicer Mosaic Viewer module previously developed by us. The right sideshows the four data viewers, each visualizing a specific step in the surgical planning workflows. Theup left viewer shows the registered T1 that overlaid on the DTI volume. Theup right viewer
laboratories, lowering the cost for data acquisition and
enabling more interesting discoveries in a greater multitude
of populations and disorders.
The continued growth in the complexity and
dimen-sionality of neuroimaging data will spur the parallel
advances of computational models and methods to
accommodate such complex data. Such models and
meth-ods need to keep increasing the grade of automation,
accuracy, reproducibility and robustness, and eventually
need to be integrated into the clinical workflows to
facili-tate clinical testing of the new neuroimaging biomarkers.
The multidisciplinary nature of neuroimaging
comput-ing will keep brcomput-ingcomput-ing together clinicians, biologists,
computer scientists, engineers, physicists, and other
researchers who are contributing to, and need to keep
abreast of, advances in the neurotechnologies and
appli-cations. New methods and models will be developed by the
collaboration of different groups or individuals, with rapid
iterations. Therefore, future packages and platforms need
to respond more quickly to the updates, without
compro-mising the functionality, extensibility and portability. This
might cause difficulties in the maintenance of large
pack-ages and platforms, but will encourage the researchers to
provide smarter solutions, e.g., providing an online version
to make the whole process of developing, sharing and
updating much quicker for both developers and users.
Acknowledgments This work was supported by supported by ARC, NA-MIC (NIH U54EB005149), and NAC (NIH P41RR013218).
Open Access This article is distributed under the terms of the Creative Commons Attribution 4.0 International License (http://crea
tivecommons.org/licenses/by/4.0/), which permits unrestricted use,
distribution, and reproduction in any medium, provided you give appropriate credit to the original author(s) and the source, provide a link to the Creative Commons license, and indicate if changes were made.
References
1. Kikinis R, Pieper SD, Vosburgh K (2014) 3D Slicer: a platform for subject-specific image analysis, visualization, and clinical support. Intraoper Imaging Image-Guided Therapy 3(19):277–289
2. He B, Liu Z (2008) Multimodal functional neuroimaging: inte-grating functional MRI and EEG/MEG. IEEE Rev Biomed Eng 1:23–40
3. Knopman AA, Wong CH, Stevenson RJ et al (2015) The rela-tionship between neuropsychological functioning and FDG–PET hypometabolism in intractable mesial temporal lobe epilepsy. Epilepsy Behav 44:136–142
4. Zhang D, Wang Y, Zhou L, Yuan H, Shen D (2011) Multimodal classification of Alzheimer’s disease and mild cognitive impairment. NeuroImage 55(3):856–867
5. Savadjiev P, Rathi Y, Bouix S, Smith AR et al (2014) Fusion of white and gray matter geometry: a framework for investigating brain development. Med Image Anal 18:1349–1360
6. Zhu D, Zhang T, Jiang X, Hu X et al (2014a) Fusing DTI and fMRI data: a survey of methods and applications. NeuroImage 102:184–191
7. Beyer T, Townsend DW, Brun T, Kinahan PE, Charron M, Robby R et al (2000) A combined PET/CT scanner for clinical oncology. J Nucl Med 41(8):1369–1379
8. Townsend DW (2001) A combined PET/CT scanner: the choi-ces. J Nucl Med 42(3):533–534
9. Bisdas S, Nagele T, Schlemmer P, Boss A, Claussen C, Pichler B, Ernemann U (2010) Switching on the lights for real-time multimodality tumor neuroimaging: the integrated positron-emission tomography/MR imaging system. Am J Neuroradiol 31:610–614
10. Liu SQ, Liu S, Cai W, Che H, Pujol S, Kikinis R, Feng D (2015b) Multi-modal neuroimaging feature learning for multi-class diagnosis of Alzheimer’s disease. IEEE Trans Biomed Eng 62(4):1132–1140
11. Nir TM, Jahanshad N, Villalon-Reina JE, Toga AW, Jack CR, Weiner MW, Thompson PM (2013) Effectiveness of regional DTI measures in distinguishing Alzheimer’s disease, MCI, and normal aging. NeuroImage 3:180–195
12. Racine AM, Adluru N, Alexander AL, Christian BT et al. (2014) Associations between white matter microstructure and amyloid burden in precinical Alzheimer’s disease: a multmodal imaging investigation. NeuroImage 4:604–614
13. Cooper D, Barker V, Radua J, Fusar-Poli P, Lawrie SM (2014) Multimodal voxel-based meta-analysis of structural and func-tional magnetic resonance imaging studies in those at elevated genetic risk of developing schizophrenia. Psychiatry Res 221(1):69–77
14. Kochunov P, Chiappelli J, Wright SN, Rowland LM et al (2014) Multimodal white matter imaging to investigate reduced frac-tional anisotropy and its age-related decline in schizophrenia. Psychiatry Res 223(2):148–156
15. Liu X, Lai Y, Wang X, Hao C et al (2014b) A combined DTI and structural MRI study in medicated-naive chronic schizophrenia. Magn Reson Imaging 32(1):1–8
16. Pomarol-Clotet E, Canales-Rodriguez E, Salvador R, Sarro S et al (2010) Medial prefrontal cortex pathology in schizophrenia as revealed by convergent findings from multimodal imaging. Mol Psychiatry 15:823–830
17. Bonilha L, Keller SS (2015) Quantitative MRI in refractory temporal lobe epilepsy: relationship with surgical outcomes. Quant Imaging Med Surg 5(2):204–224
18. Fernandez S, Donaire A, Seres E, Setoain X, Bargallo N et al (2015) PET/MRI and PET/MRI/SISCOM coregistration in the presurgical evaluation of refractory facol epilepsy. Epilepsy Res 111:1–9
19. Abela E, Rummel C, Hauf M, Weisstanner C, Schindler K, Wiest R (2014) Neuroimaging of epilepsy: lesions, networks, oscillations. Clin Neuroradiol 24(1):5–15
20. Agam Y, Vangel M, Roffman JL, Gallagher PJ et al (2014) Dissociable genetic contributions to error processing: a multi-modal neuroimaging study. PLoS ONE 9(7):e101,784 21. Radua J, Grau M, van den Heuvel OA, de Schotten MT et al
(2014) Multimodal voxel-based meta-analysis of white matter abnormalities in obsessive-compulsive disorder. Neuropsy-chopharmacology 39(7):1547–1557
22. Taylor SF, Stern ER, Gehring WJ (2007) Neural systems for error monitoring: recent findings and theoretical perspectives. Neuroscientist 13(2):160–172
24. Sui J, Pearlson GD, Caprihan A, Adali T, Kiehl KA et al (2011) Discriminating schizophrenia and bipolar disorder by fusing fMRI and DTI in a multimodal CCA?joint ICA model. Neu-roImage 57(3):839–855
25. Anderson A, Douglas PK, Kerr WT, Haynes VS et al (2014) Non-negative matrix factorization of multimodal MRI, fMRI and phenotypic data reveals differential changes in default mode subnetworks in ADHD. NeuroImage 102(1):207–219
26. Dai D, Wang J, Hua J, He H (2012) Classification of ADHD children through multimodal magnetic resonance imaging. Front Syst Neurosci 6(63):1–8
27. Hong SB, Zalesky A, Fornito A, Park S, Yang YH et al (2014) Connectomic disturbances in attention-deficit/hyperactivity dis-order: a whole-brain tractography analysis. Biol Psychiatry 76(8):656–663
28. Anagnostou E, Taylor MJ (2011) Review of neuroimaging in Autism spectrum disorders: what have we learnt and where we go from here. Mol Autism 2(4):1–9
29. Mueller S, Keeser D, Samson AC, Kirsch V, Blautzik J et al. (2013) Convergent Findings of Altered Functional and Struc-tural Briain Connectivity in Individuals with High Functioning Autism: A Multimodal MRI Study. PLoS ONE 8(6):e67,329 30. Stigler KA, McDonald BC, Anand A et al (2011) Structural and
functional magnetic resonance imaging of Autism spectrum disorders. Brain Res 1380:146–161
31. Cherubini A, Luccichenti G, Peran P, Hagberg GE et al (2007) Multimodal fMRI tractography in normal subjects and in clini-cally recovered traumatic brain injury patients. NeuroImage 34(4):1331–1341
32. Dean PJ, Sato JR, Vieira G, McNamara A, Sterr A (2014) Multimodal imaging of mild traumatic brain injury and persis-tent postconcussion syndrome. Brain Behav 5(1):45–61 33. Irimia A, Chambers MC, Alger JR, Filippou M, Prastawa MW
et al (2011) Comparison of acute and chronic traumatic brain injury using semi-automatic multimodal segmentation of MR volumes. J Neurotrauma 28(11):2287–2306
34. Turken AU, Herron TJ, Kang X, O’Connor LE, Sorenson DJ et al. (2009) Multimodal surface-based morphometry reveals diffuse cortical atrophy in traumatic brain injury. BMC Medical Imaging 9(20)
35. Copen WA (2015) Multimodal imaging in acute ischemic stroke. Curr Treat Options Cardiovas Med 17(10):1–17 36. Tong E, Hou Q, Fiebach JB, Wintermark M (2014) The role of
imaging in acute ischemic stroke. Neurosurg Focus 36(1):E3 37. Achiron A, Barak Y (2003) Cognitive impairment in probable
multiple sclerosis. J Neurol Neurosurg Psychiatry 74:443–446 38. Louapre C, Perlbarg V, Garcia-Lorenzo D, Urbanski M et al
(2014)Brain networks disconnection in early multiple sclerosis cognitive deficits: an anatomofunctional study. Hum Brain Map 35:4706–4717
39. Tona F, Petsas N, Sbardella E, Prosperini L et al (2014) Multiple sclerosis: altered thalamic resting-state functional connectivity and its effect on cognitive function. Radiology 271(3):814–821 40. Durst CR, Raghavan P, Shaffrey ME, Schiff D et al (2014) Multimodal MR imaging model to predict tumor infiltration in patients with gliomas. Neuroradiology 56(2):107–115
41. Neuner I, Kaffanke JB, Langen KJ, Kops ER, Tellmann L et al (2012) Multimodal imaging utilising integrated MR-PET for human brain tumor assessment. Eur Radiol 22:2568–2580 42. Tempany CM, Jayender J, Kapur T, Bueno R et al (2014)
Multimodal imaging for improved diagnosis and treatment of cancers. Cancer 121(6):817–827
43. Liu S, Cai W, Liu SQ, Zhang F, Fulham M, Feng D, Pujol S, Kikinis R (2015a) Multimodal neuroimaging computing: a review of the applications in neuropsychiatric disorders. Brain Info 2(3). doi:10.1007/s40708-015-0019-x
44. Morioka H, Kanemura A, Morimoto S, Yoshioka T et al (2013) Decoding spatial attention by using cortical currents estimated from electroencephalography with near-infrared spectroscopy prior information. NeuroImage 90:128–139
45. Liu Z, Ding L, He B (2006) Integration of EEG/MEG with MRI and fMRI in functional neuroimaging. IEEE Eng Med Biol Mag 25(4):46–53
46. Binder JR, Desai RH, Graves WW, Conant LL (2009) Where is the semantic system? A critical review and meta-analysis of 120 functional neuroimaging studies. Cereb Cortex 19(12):2767–2796
47. Nguyen VT, Cunnington R (2014) The superior temporal sulcus and the N170 during face processing: single trial analysis of concurrent EEG–fMRI. NeuroImage 86:492–502
48. Okamoto M, Dan K, Shimizu K, Takeo K et al (2004) Multi-modal assessment of cortical activation during apple peeling by NIRS and fMRI. NeuroImage 21(4):1275–1288
49. Ashburner J, Friston JK (2000) Voxel-based morphometry: the methods. NeuroImage 11(6):805–821
50. Tustison NJ, Johnson HJ, Rohlfing T, Klein A et al. (2013) Instrumentation bias in the use and evaluation of scientific software: recommendations for reproducible practices in the computational sciences. Front Neurosci 7(162)
51. Gross J, Baillet S, Barnes GR, Henson RN, Hillebrand A et al (2013) Good practice for conducting and reporting MEG research. NeuroImage 65:349–363
52. Gotte M, Russel I, de Roest G, Germans T, Veldkamp R et al (2010) Magnetic resonance imaging, pacemakers and implan-table cardioverter-defibrillators: current situation and clinical perspective. Neth Heart J 18(1):31–37
53. Bovenschulte H, Schluter-Brust K, Liebig T, Erdmann E, Eysel P, Zobel C (2012) MRI in patients with pacemakers: overview and procedural management. Deutsch Arztebl Int 109(15):270–275
54. Avants BB, Tustison NJ, Stauffer M, Song G, Wu B, Gee JC (2014) The insight toolkit image registration framework. Front Neuroinf 8(1):1–13
55. Yoo TS, Ackerman MJ, Lorensen WE, Schroeder W et al (2002) Engineering and algorithm design for an image processing API: a technical report on ITK: the Insight Toolkit. Stud Health Technol Inf 85:586–592
56. Tustison NJ, Avants BB, Cook PA, Zheng Y, Egan A, Yushkevich PA, Gee JC (2010) N4ITK: improved N3 bias correction. IEEE Trans Med Imaging 29(6):1310–1320 57. Power JD, Barnes KA, Snyder AZ, Schlaggar BL, Petersen SE
(2012) Spurious but systematic correlations in functional con-nectivity MRI networks arise from subject motion. NeuroImage 59(3):2142–2154
58. Pierpaoli C, Walker L, Irfanoglu M et al. (2010) TORTOISE: an integrated software package for processing of diffusion MRI data. In: The 18th ISMRM Annual Meeting, vol 1597 59. Behrens T, Woolrich M, Jenkinson M, Johansen-Berg H et al
(2003) Characterization and propagation of uncertainty in diffu-sion-weighted MR imaging. Magn Reson Med 50(5):1077–1088 60. Oguz I, Farzinfar M, Matsui J, Budin F, Liu Z, Gerig G et al (2014) DTIPrep: quality control of diffusion-weighted images. Front Neuroinf 8(4):1–11
61. Friston KJ, Williams S, Howard R, Frackwiak RSJ, Tumer R (1996) Movement-related effects in fMRI time-series. Magn Reson Med 35(3):346–355
62. Hricak H, Choi BI, Scott AM, Sugimura K et al (2010) Global trends in hybrid imaging. Radiology 257(2):498–506
63. Sureshbabu W, Mawlawi O (2005) PET/CT imaging artifacts. J Nucl Med Technol 33(3):156–161
65. Vigario R (1997) Extraction of ocular artifacts from EEG using independent component analysis. Electroencephalogr Clin Neurophysiol 103:295–404
66. Taulu S, Simola J (2006)Spatiotemporal signal separation method for rejecting nearby interference in MEG measurements. Phys Med Biol 51:1759–1768
67. Uusitalo M, Ilmoniemi R (1997) Signal-space projection method for separating MEG or EET into components. Med Biol Eng Comput 35:135–140
68. Geffroy D, Rivie`re D, Denghien I, Souedet N, Laguitton S, Cointepas Y (2011) BrainVISA: a complete software platform for neuroimaging. In: Python in neuroscience workshop 69. Fischl B, Dale AM (2000) Measuring the thickness of the human
cerebral cortex from magnetic resonance images. Proc Natl Acad Sci 97(20):11,050–11,055
70. Dale AM, Fischl B, Sereno MI (1999) Cortical surface-based analysis: I segmentation and surface reconstruction. NeuroI-mage 9(2):179–194
71. Talariach J, Tournoux P (1988) Co-planar stereotaxic atlas of the human brain 3-dimentional proportional system: an approach to cerebral imaging. Stuttgart, New York
72. Fonov V, Evans A, Botteron K, Almli C et al (2010) Unbiased average age-approapriate atlases for pediatric studies. NeuroI-mage 54(1):313–327
73. Mazziotta J, Toga A, Evans A, Fox P, Lancaster J, Zilles K et al (2001) A probabilistic atlas and reference system for the human brain: international consortium for brain mapping (ICBM). Philos Trans R Soc London Ser 356(1412):1293–1322 74. Tzourio-Mazoyer N, Landeau B, Papathanassiou D, Crivello F
et al (2002) Automated anatomical labelling of activations in SPM using a macroscopy anatomical pacellation of the MNI MRI single-subject brain. NeuroImage 15(1):273–289 75. Schaer M, Cuadra M, Tamarit L, Lazeyras F, Eliez S, Thiran J
(2008) AA surface-based approach to quantify local cortical gyrification. IEEE Trans Med Imaging 27(2):161–170 76. Awate SP, Yushkevich PA, Song Z, Licht DJ, Gee JC (2010)
Cerebral cortical folding analysis with multivariate modeling and testing: studies on gender differences and neonatal devel-opment. NeuroImage 53(2):450–459
77. Cash DM, Melbourne A, Modat M, Cardoso MJ, Clarkson MJ, Fox NC, Ourselin S (2012) Cortical folding analysis on patients with Alzheimer’s disease and mild cognitive impairment. In: Ayache N, Delingette H, Golland P, Mori K (eds) Medical image computing and computer-assisted intervention (MIC-CAI), LNCS, vol 7512. Springer, Berlin, pp 289–296
78. Liu S, Cai W, Song Y, Pujol S, Kikinis R, Wen L, Feng D (2013a) Localized sparse code gradient in Alzheimer’s disease staging. In: The 35th annual international conference of the IEEE engineering in medicine and biology society (EMBC), IEEE, pp 5398–5401
79. Liu S, Song Y, Cai W, Pujol S, Kikinis R, Wang X, Feng D (2013c) Multifold Bayesian kernelization in Alzheimer’s diag-nosis. In: Mori K, Sakuma I, Sato Y, Barillot C, Navab N (eds) The 16th international conference on medical image computing and computer-assisted intervention (MICCAI), LNCS, vol 8150. Springer, Berlin Heidelberg, pp 303–310
80. Liu S, Zhang L, Cai W, Song Y, Wang Z, Wen L, Feng D (2013d) A supervised multiview spectral embedding method for neuroimaging classification. In: The 20th IEEE international conference on image processing (ICIP), pp 601–605
81. Cai W, Liu S, Wen L, Eberl S, Fulham MJ, Feng D (2010) 3D neurological image retrieval with localized pathology-centric CMRGlc patterns. In: The 17th IEEE international conference on image processing (ICIP), pp 3201–3204
82. Liu S, Cai W, Wen L, Eberl S, Fulham M, Feng D (2011a) Localized functional neuroimaging retrieval using 3D discrete
curvelet transform. In: IEEE international symposium on biomedical imaging: from nano to macro (ISBI), pp 1877–1880 83. Liu S, Cai W, Wen L, Feng D (2012) Multiscale and multiori-entation feature extraction with degenerative patterns for 3D neuroimaging retrieval. In: The 19th IEEE international con-ference on image processing (ICIP), pp 1249–1252
84. Mangin J, Jouvent E, Cachia A (2010) In-vivo measurement of cortical morphology: means and meanings. Curr Opin Neurol 23(4):359–367
85. Winkler AM, Kochunov P, Blangero J et al (2010) Cortical thickness or grey matter volume? the importance of selecting the phenotype for imaging genetics studies. NeuroImage 53(3):1135–1146
86. Tournier JD, Calamante F, Connelly A (2007) Robust determi-nation of the fiber orientation distribution in diffusion MRI: non-negativity constrained super-resolved spherical deconvolution. NeuroImage 35(4):1459–1472
87. Tuch DS (2004) Q-ball imaging. Magn Reson Med 52:1358–1372
88. Wedeen V, Hagmann P, Tseng W, Reese T, Weisskoff R (2005) Mapping complex tissue architecture with diffusion spectrum magnetic resonance imaging. Magn Reson Med 54(6):1377–1386 89. Yeh F, Wedeen V, Tseng W (2010) Generalized Q-sampling
imaging (GQI). IEEE Trans Med Imaging 29:1626–1635 90. Haldar JP, Leahy RM (2013) Linear transforms for Fourier data
on the sphere: application to high angular resolution diffusion MRI of the brain. NeuroImage 71:233–247
91. Wilkins B, Lee N, Gajawelli N, Law M, Lepore N (2015) Fiber estimation and tractography in diffusion MRI: development of simulated brain images and comparison of multi-fiber analysis methods at clinical b-values. NeuroImage 109:341–356 92. Maier-Hein KH, Westin CF, Shenton ME, Weiner MW, Raj A,
Thomann P et al (2014) Widespread white matter degeneration preceding the onset of dementia. Alzheimer’s Dementia S1552–5260(14):1–9
93. Savadjiev P, Kindlemann G, Bouix S, Sheton M, Westin C (2010) Local white matter geometry from diffusion tensor gra-dients. NeuroImage 49:3175–3186
94. Mori S, van Ziji PC (2002) Fiber tracking: principles and strategies: a technical review. NMR Biomed 15(7–8):468–480 95. Durrieman S, Pennec X, Trouve A, Ayache N (2009) Statistical
models of sets of curves and surfaces based on currents. Med Image Anal 13(5):793–808
96. Zalesky A, Fornito A, Harding IH et al (2010) Whole-brain anatomical networks: does the choice of nodes matter? Neu-roImage 50(3):970–983
97. O’Donnell LJ, Golby AJ, Westin CF (2013) Fiber clustering versus the parcellation-based connectome. NeuroImage 80:283–289
98. Jones DK, Knosche TR, Turner R (2013) White matter integrity, fiber count, and other fallacies: the do’s and don’ts of diffusion MRI. NeuroImage 73:239–254
99. Friston KJ (2003) Introduction: experimental design and statis-tical parametric mapping. In: Frackowiak RS et al (eds) Human brain function, 2nd edn. Elsevier, New York
100. Davison EN, Schlesinger KJ, Bassett DS, Lynall MR et al (2015) Brain network adaptability across task states. PLoS Comput Biol 11(1):e1004,029
101. Turk-Browne NB (2013) Functional interactions as big data in the human brain. Science 342(6158):580–584
102. Biswal B, Yetkin F, Haughton V, Hyde J (1995) Functional connectivity in motor cortex of resting human brain using echo-planar MRI. Magn Reson Med 34:537–541
104. Buckner R, Andrews-Hanna J, Schacter D (2008) The brain’s default network: anatomy, function and relevance to disease. Ann N Y Acad Sci 1124:1–38
105. Jiang T, Liu Y, Shi F, Shu N, Liu B et al (2008) Multimodal magnetic resonance imaging for brain disorders: advances and perspectives. Brain Imaging Behav 2:249–257
106. Rubinov M, Sporns O (2010) Complex network measures of brain connectivity: uses and interpretations. NeuroImage 52:1059–1069
107. Carpenter AJ, Pontecorvo M, Hefti F, Skovronsky D (2009) The use of the exploratory IND in the evaluation and development of 18F-PET radiopharmaceuticals for amyloid imaging in the brain: a review of one company’s experience. Q J Nucl Med Mol Imaging 53(4):387–393
108. Ni R, Gillberg P, Bergfors A, Marutle A, Nordberg A (2013) Amyloid tracers detect multiple binding sites in Alzheimer’s disease brain tissue. Brain 136(7):2217–2227
109. Perrin RJ, Fagan AM, Holtzmann DM (2009) Multimodal techniques for diagnosis and prognosis of Alzheimer’s disease. Nature 461:916–922
110. Thompson PM, Ye L, Morgenstem JL, Sue L, Beach TG et al (2009) Interaction of the amyloid imaging tracer FDDNP with hallmark Alzheimer’s disease pathologies. J Neurochem 109(2):623–630
111. Clark CM, Pontecorvo MJ, Beach TG, Bedell BJ, Coleman RE, Doraiswamy PM et al (2012) Cerebral PET with florbetapir compared with neuropathology at autopsy for detection of neuritic amyloid- plaques: a prospective cohort study. Lancet Neurol 11(8):669–678
112. Landau SM, Lu M, Joshi AD, Pontecorvo M, Mintun MA, Trojanowski JQ, Shaw LM, Jagust WJ, Initiative Alzheimer’s Disease Neuroimaging (2013) Comparing positron emission tomography imaging and cerebrospinal fluid measurements of beta-amyloid. Ann Neurol 74(6):826–836
113. Sokoloff L, Reivich M, Kennedy C, Des-Rosiers M et al (1977) The [14C]deoxy-glucose method for the measurement of local cerebral glucose utilization: theory, procedure and normal values in the consicious and anesthetized albino Rat. J Neurochem 28:897–916 114. Batty S, Clark J, Fryer T, Gao X (2008) Prototype system for semantic retrieval of neurological PET images. In: Gao X, Mu¨ller H, Loomes M, Comley R, Luo S (eds) Medical imaging and informatics, LNCS, vol 4987. Springer, Berlin Heidelberg, pp 179–188
115. Minoshima S, Frey KA, Koeppe RA, Foster NL, Kuhl DE (1995) A diagnostic approach in Alzheimer’s disease using three-dimensional stereotactic surface projections of fluorine-18-FDG PET. J Nucl Med 36(7):1238–1248
116. Chen K, Ayutyanont N, Langbaum JB, Fleisher AS, Reschke C et al (2011) Characterizing Alzheimer’s disease using a hypo-metabolic convergence index. NeuroImage 56(1):52–60 117. Cai W, Feng D, Fulton R (2000) Content-based retrieval of
dynamic PET functional images. IEEE Trans Inf Technol Biomed 4(2):152–158
118. Cai W, Liu S, Song Y, Pujol S, Kikinis R, Feng D (2014) A 3D difference of Gaussian based lesion detector for brain PET. In: IEEE international symposium on biomedical imaging: from nano to macro (ISBI), pp 677–680
119. Klein S, Staring M, Murphy K, Viergever MA, Pluim JP (2010) elastix: a toolbox for intensity-based medical image registration. IEEE Trans Med Imaging 29(1):196–205
120. Jenkinson M, Bannister P, Brady M, Smith S (2002) Improved optimization for the robust and accurate linear registration and motion correction of brain images. NeuroImage 17(2):825–841 121. Rueckert D, Sonoda L, Hayes C et al (1999) Non-rigid regis-tration using free-form deformations: applications to breast MR images. IEEE Trans Med Imaging 18(8):712–721
122. Murphy K, van Ginneken B, Reinhardt J, Kabus S et al (2011) Evaluation of registration methods on thoracic CT: the EMPIRE10 challenge. IEEE Trans Med Imaging 30:1901–1920 123. Vercauteren T, Pennec X, Perchant A, Ayache N (2009) Dif-feomorphic demons: efficient non-parametric image registration. NeuroImage 45(Suppl. 1):S61–S72
124. Avants B, Epstein C, Grossman M, Gee J (2008) Symmetric diffeomorphic image registration with cross-correlation: evalu-ating automated labeling of elderly and neurodegenerative brain. Med Image Anal 12(1):26–41
125. Heckemann RA, Keihaninejad S, Aljabar P, Gray KR, Nielsen C, Rueckert D et al (2011) Automatic morphometry in Alzhei-mer’s disease and mild cognitive impairment. NeuroImage 56(4):2024–2037
126. Hammers A, Allom R, Koepp M et al (2003) Three-dimentional maximum probability atlas of the human brain, with particular reference to the temporal lobe. Hum Brain Map 19(4):224–247 127. Shattuck D, Mirza M, Adisetiyo V et al (2008) Construction of a 3D probabilistic atlas of human cortical structures. NeuroImage 39(3):1064–1080
128. Csernansky J, Wang L, Joshi S et al (2004) Computational anatomy and neuropsychiatric disease: probabilistic assessment of variation and statistical inference of group difference, hemi-spheric asymmetry and time-dependent change. NeuroImage Suppl 1(23):56–68
129. Rademacher J, Galaburda A, Kennedy D et al (1992)Human cerebral cortex: localization, parcellation, and morphometry with magnetic resonance imaging. J Cogn Neurosci 4(4):352–374 130. Yao Z, Hu B, Xie Y, Moore P, Zheng J (2015) A review of
structural and functional brain networks: small world and atlas. Brain Inf 2(1):45–52
131. Heckemann R, Hajnal J, Aljabar P, Rueckert D, Hammers A (2006) Automatic anatomical brain MRI segmentation combining label propagation and decision fusion. NeuroImage 33(1):115–126 132. Aljabar P, Heckemann R, Hammers A et al (2009) Multi-atlas
based segmentation of brain images: atlas selection and its effect on accuracy. NeuroImage 46:726–738
133. Heckemann R, Keihaninejad S, Aljabar P, Rueckert D et al (2010) Improving intersubject image registration using tissue-class information benefits robustness and accuracy of multi-atlas based anatomical segmentation. NeuroImage 51(1):221–227
134. Liu S, Cai W, Wen L, Eberl S, Fulham MJ, Feng D (2011b) Generalized regional disorder-sensitive-weighting scheme for 3D neuroimaging retrieval. In: The 33rd annual international conference of the IEEE engineering in medicine and biology society (EMBC), pp 7009–7012
135. Shen L, Kim S, Qi Y, Inlow M, Swaminathan S, Nho K, Wan J, Risacher S, Shaw L, Trojanowski J, Weiner M, Saykin A (2011) Identifying neuroimaging and proteomic biomarkers for MCI and AD via the elastic net. In: Liu T, Shen D, Ibanez L, Tao X (eds) Multimodal brain image analysis (MBIA), LNCS, vol 7012. Springer, Berlin Heidelberg, pp 27–34
136. Zhu X, Suk HI, Shen D (2014b) A novel matrix-similarity based loss function for joint regression and classification in AD diagnosis. NeuroImage 100:91–105
137. Liu S, Cai W, Wen L, Feng D (2013b) Multi-channel brain atrophy pattern analysis in neuroimaging retrieval. In: IEEE international symposium on biomedical imaging: from nano to macro (ISBI), pp 206–209
138. Liu S, Cai W, Wen L, Feng DD, Pujol S, Kikinis R, Fulham MJ, Eberl S (2014a) Multi-channel neurodegenerative pattern anal-ysis and its application in Alzheimer’s disease characterization. Comput Med Imaging Graph 38:436–444
140. Shen H, Tao D, Ma D (2013) Multiview locally linear embed-ding for effective medical image retrieval. PLoS ONE 8(12):e82,409
141. Bengio Y, Courville A, Vincent P (2013) Representation learning: a review and new perspectives. IEEE Trans Pattern Anal Mach Intell 35(8):1798–1828
142. Suk HI, Lee S, Shen D (2013) Latent feature representation with stacked auto-encoder for AD/MCI diagnosis. Brain Struct Funct 220(2):841–959
143. Suk H, Lee S, Shen D (2014) Hierarchical feature representation and multimodal fusion with deep learning for AD/MCI diag-nosis. NeuroImage 101:569–582
144. Hinrichs C, Singh V, Xu G, Johnson S (2009) MKL for robust multi-modality AD classification. In: Yang G (ed) Medical image computing and computer-assisted intervention (MIC-CAI), LNCS, vol 5762. Springer, New York, pp 786–794 145. Hinrichs C, Singh V, Xu G, Johnson S (2011) Predictive
markers for AD in a multi-modality framework: an analysis of MCI progression in the ADNI population. NeuroImage 55:574–589
146. Liu SQ, Liu S, Zhang F, Cai W, Pujol S, Kikinis R, Feng D (2015c) Longitudinal brain MR retrieval with diffeomorphic demons registration: what happened to those patients with similar changes? In: IEEE international symposium on biomedical imaging: from nano to macro (ISBI), IEEE 147. Modat M, Simpson I, Cardoso M, Cash D et al. (2014)
Simu-lating neurodegeneration through longitudinal population anal-ysis of structural and diffusion weighted MRI data. Medical image computing and computer-assisted intervention (MIC-CAI), LNCS, vol 8675. Springer, Berlin, pp 57–64
148. Rubin D, Mongkolwat P, Klepe