R E S E A R C H
Open Access
An assessment of routine primary care health
information system data quality in Sofala
Province, Mozambique
Sarah Gimbel
1,2,3*, Mark Micek
1,2, Barrot Lambdin
2, Joseph Lara
2, Marina Karagianis
4, Fatima Cuembelo
5,
Stephen S Gloyd
1,2, James Pfeiffer
1,2and Kenneth Sherr
1,2Abstract
Background:Primary health care is recognized as a main driver of equitable health service delivery. For it to function optimally, routine health information systems (HIS) are necessary to ensure adequate provision of health care and the development of appropriate health policies. Concerns about the quality of routine administrative data have undermined their use in resource-limited settings. This evaluation was designed to describe the availability, reliability, and validity of a sample of primary health care HIS data from nine health facilities across three districts in Sofala Province, Mozambique. HIS data were also compared with results from large community-based surveys. Methodology:We used a methodology similar to the Global Fund to Fight AIDS, Tuberculosis and Malaria data verification bottom-up audit to assess primary health care HIS data availability and reliability. The quality of HIS data was validated by comparing three key indicators (antenatal care, institutional birth, and third diptheria, pertussis, and tetanus [DPT] immunization) with population-level surveys over time.
Results and discussion:The data concordance from facility clinical registries to monthly facility reports on five key indicators–the number of first antenatal care visits, institutional births, third DPT immunization, HIV testing, and outpatient consults–was good (80%). When two sites were excluded from the analysis, the concordance was markedly better (92%). Of monthly facility reports for immunization and maternity services, 98% were available in paper form at district health departments and 98% of immunization and maternity services monthly facility reports matched the Ministry of Health electronic database. Population-level health survey and HIS data were strongly correlated (R = 0.73), for institutional birth, first antenatal care visit, and third DPT immunization.
Conclusions:Our results suggest that in this setting, HIS data are both reliable and consistent, supporting their use in primary health care program monitoring and evaluation. Simple, rapid tools can be used to evaluate routine data and facilitate the rapid identification of problem areas.
Introduction
The 2008 World Health Report issued a call for a renewed focus on primary health care (PHC). As set forth in the 1978 Alma Ata Declaration, the ultimate goal of PHC is better health for all through a reduction in exclusion and social disparities in health, the organi-zation of health services around people’s health needs and expectations, the integration of health into all
sectors through effective policy planning, and the pur-suit of collaborative models of policy dialogue through increasing stakeholder participation. [1] A key systems building block of PHC is an intact health information system (HIS), which generates information to enable decision-makers at all levels of the health system to identify problems and needs, make evidence-based deci-sions on health policy, and allocate scarce resources optimally. [2] Effective monitoring and supervision of health care programs depend on complete, accurate, and timely flow of data between primary health care facil-ities, hospitals, and a central information hub. * Correspondence: [email protected]
1
Department of Global Health, School of Public Health and Community Medicine, University of Washington. Seattle, WA 98195, USA
Full list of author information is available at the end of the article
Ultimately, effective use of information has been identi-fied as a key element in the success of large-scale efforts that have achieved major health improvements. [3]
There are six main types of recognized surveillance data, including census, vital events, disease-specific registries, administrative data, household surveys, and national health accounts. Within the framework of PHC, administrative data provide the best opportunity for public health systems to capture facility-level informa-tion to guide program planning and management. Administrative data are better suited to PHC than other forms of surveillance in this regard because they are universal in scope, inexpensive, and data are immedi-ately available at each level of the health system. This allows clinic-level managers, as well as provincial and national managers, to use the information in either aggregated or nonaggregated formats to guide decision-making and program implementation.
Concerns about the quality of routine administrative data in resource-limited settings such as Mozambique have undermined their use [4,5]. Earlier studies and reports have found that the data received by health managers from health facilities in resource-limited set-tings are chronically incomplete, inaccurate, and unti-mely [6,7]. One study, carried out in 2004 in selected districts in southern Mozambique to assess the quality of routine malaria data, found primary data to be of poor quality and that the multiplicity of reporting chan-nels of information (4) contributed to a duplication of efforts and ultimately to low validity, incorrectness, and incompleteness of data. In addition, there are typically limited human resources available to analyze and trans-late data into useful information for health managers. Acting on useful information can also be challenging when program staff have different data needs from sur-veillance experts. Sursur-veillance systems are often donor-driven and developed to monitor vertically-funded prior-ity initiatives, further undermining and directing resources away from the PHC system. [8,9] As the donor community recommits to the importance of PHC, the focus on strengthening routine HIS is crucial to ensure that information collection is funded systema-tically rather than categorically. The ultimate goal of a national HIS is the coordination of government and donor information needs and flows through one national HIS to decrease system fragmentation, mini-mize duplicative and burdensome reporting, and improve data quality and use. [2] In this context, our aim was to evaluate the strengths and weaknesses of HIS in three districts in central Mozambique, by evalu-ating the quality of HIS data prior to the initiation of a seven-year joint PHC strengthening project of the Mozambican Ministry of Health (MOH), the University of Eduardo Mondlane, and the University of
Washington (UW)/Health Alliance International (HAI), funded by the Doris Duke Charitable Foundation/Afri-can Health Initiative. The intention of this paper was not to assess other aspects of HIS data use, such as determinants of data quality or use in the aforemen-tioned three districts.
Methods
Ethics
This study was approved by the Institutional Review Board (IRB) of the Mozambique National Institute of Health. Co-investigators also discussed the study with the IRB at the UW, which determined that the UW IRB review was not necessary because the primary intent of the project was for program evaluation purposes, and therefore not considered human subjects research under United States federal regulations.
Study setting and sites
Sofala Province, with a population of approximately 1.6 million, is similar to Mozambique as a whole in terms of high disease burden (23% HIV prevalence) and lim-ited availability of health workers (three medical doctors and 21 nurses per 100,000 inhabitants) [10]. Sofala Pro-vince is traversed by major highways connecting its pro-vincial capital city, Beira, with Manica Province and Zimbabwe to the west and smaller roads connecting to Zambezia Province in the north and to Inhambane Pro-vince to the south. Sofala was heavily affected during the 20-year civil war, which decimated the health infra-structure. HAI, a nongovernmental organization (NGO), is a main external support organization for the health sector in the Province. HAI has over 20 years of experi-ence working with the Mozambican MOH and began working in Sofala Province in 1995.
In Sofala Province, there are a total of 137 primary-level health facilities (12 urban health centers, 10 rural health centers type I, 89 rural health centers type II, and 26 health posts), four secondary-level health facilities (rural hospitals), and one quaternary health facility (cen-tral hospital). There is only one notable private clinic in Sofala Province, located in the provincial capital (Beira), which provides a nonconsequential level of formal health services (estimated to be less than 1% of facility-assisted births and outpatient consults in the entire pro-vince, as reported by the HIS).
researchers. In Beira City, three large urban health cen-ters were selected as demonstrative of sites where most people receive PHC services. The largest hospital in the city (Beira Central Hospital) was excluded because it does not provide core PHC services, such as immuniza-tion and antenatal care services. The health facilities chosen from the other two districts were selected to represent a broad range of PHC facilities in those locales, and included from each district: 1) a large dis-trict hospital/health center, 2) a medium-sized health center outside the district capital, and 3) a small rural health center/health post.
Mozambique’s National Health Service (NHS) is the key organizational unit through which PHC services are managed, coordinated, and brought to scale. Since its inception in 1975, the NHS has been designed to provide integrated primary health care services through a widespread network of health facilities distributed across the country. Chronic resource shortages, vertical funding from donors, and management challenges all limit service coverage and quality. The Mozambique health system is currently undergoing a decentraliza-tion process, which will further devolve important management and planning tasks from the provincial to the district level. Unfortunately, most district health directorates remain under-resourced with limited tech-nical, managerial, and workforce capacity to assume these devolved responsibilities. District management is further hampered by a combination of relatively weak data collection systems and low district capacity to analyze data for district-level decision-making and planning.
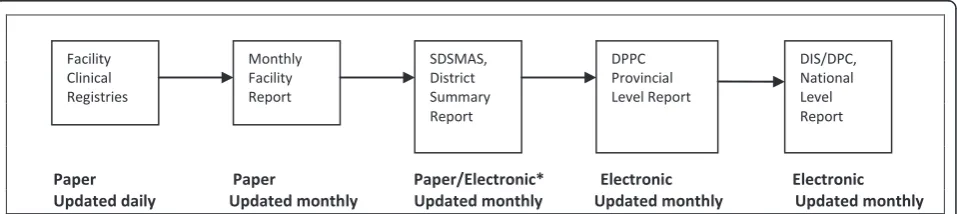
The Mozambique HIS is similar to the data systems of other countries in the region, incorporating both paper and electronic elements, depending on the health system level. Patient-level information is collected daily in facility paper-based clinical registries, typically by nurses within health facilities (Figure 1). On a monthly basis, key
indicators are culled from the facility clinical registries and aggregated into monthly facility reports, which are sent on to the district level. In most cases, the district planning and statistics department enters the monthly facility reports into the MOH electronic database, known as the
“Basic Module,” and the electronic files are sent to the provincial level, where they are aggregated and forwarded to the national level via email or on flash drives.
Data collection and statistics
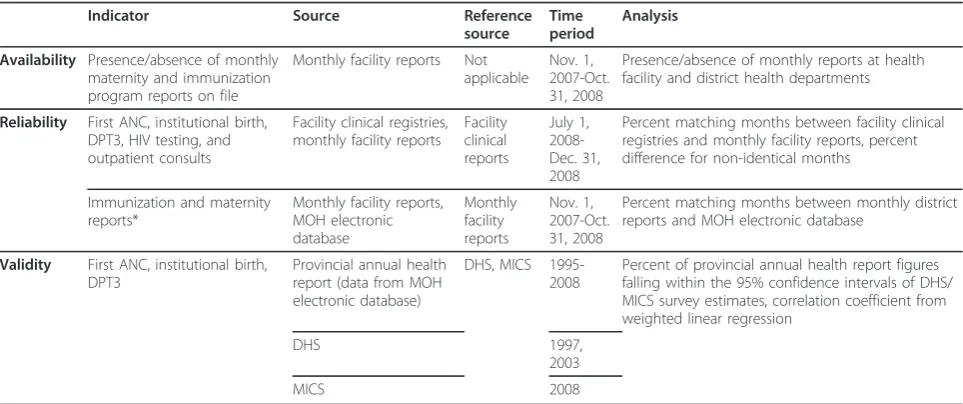
For the purposes of this activity, we used a methodology similar to the Global Fund to Fight AIDS, Tuberculosis and Malaria (GFATM) on-site data verification bottom-up audit tool [11] to assess the primary health care HIS, which included the following components (see Table 1):
1. Verification of theavailabilityof monthly facility reports at the health facility and district health departments
2. Evaluation of the reliability (concordance) of monthly statistics obtained from facility clinical registries, monthly facility reports, and the MOH electronic database
3. Examination of thevalidity of the HIS data by comparison with population-level surveys over time
The GFATM data verification tool includes the first and second components but not the third, which was added by the researchers as a means to assess the valid-ity of the routine HIS data compared to population-level surveys that are powered for provincial-level analysis.
Another important difference between the GFATM data verification tool and our methodology was the selection of indicators representative of PHC services, rather than indi-cators from the GFATM focus diseases (HIV, tuberculosis, and malaria). However, we used the GFATM data verifica-tion rating system to classify the concordance of the relia-bility indicators according to the following scale:
Paper Paper Paper/Electronic* Electronic Electronic Updated daily Updated monthly Updated monthly Updated monthly Updated monthly Key: SDSMAS-district health department, DPPC-provincial health planning department, DIS-national health information department, DPC-national planning and cooperation department
*Facility-level data is entered into the electronic database and can be aggregated as needed to the district, provincial or national levels Facility
Clinical Registries
Monthly Facility Report
SDSMAS, District Summary Report
DPPC Provincial Level Report
DIS/DPC, National Level Report
A - less than 10% error margin B1 - between 10% to 20% error margin B2 - above 20% error margin
C - no systems in place
All data were collected by provincial level health man-agers and NGO counterparts based at the MOH’s Beira Operations Research Center (BORC). This applied research center is in no way involved with the manage-ment of the health system, nor in the delivery of health services, and thus its employees are uniquely poised to evaluate how the health system operates. In addition, the training provided to the data collection staff also mitigated potential bias in data collection. It should be noted that district and facility staff did help in providing the data registries and monthly reports but were not involved in collecting data.
Data availability
To assess the availability of monthly health facility and district reports for immunization and maternity services, we noted the monthly presence or absence of these two reports over a 12-month period (November 1, 2007 through October 31, 2008) at both health facilities and district health departments (Table 1). Ideally, paper copies of the monthly facility reports should be orga-nized chronologically in binders at the health facility, and original reports should be sent to the district health department offices, where paper copies are kept and filed after they are entered into the MOH electronic database. Provincial-level health managers and NGO
counterparts from the BORC worked together to collect this information over a one-week period.
Data reliability
To assess data reliability, we recorded monthly figures from facility clinical registries and monthly facility reports for five key indicators (first antenatal care [ANC1], institutional birth, DPT3, HIV testing, and out-patient consults) for the six-month period from June through December 2008, which was deemed adequate to gain a sufficient picture of data reliability over time (Table 1). We then calculated the proportion of facility-months in which the data were not identical and calcu-lated the percentage difference for those months where data were not identical.
We also compared recorded monthly figures from aggregated district reports and the MOH electronic database (obtained at the provincial level) for immuniza-tion and maternity services for a 12-month period from November 2007 to October 2008. Seven indicators from the immunization report were included: target group, first tetanus dose, second to fifth tetanus dose, total tetanus doses, coverage rate/goal, doses administered, and wastage rate. Eight indicators from the maternity reports were included: institutional births, live births, low-weight births, stillbirths, stillbirths with heartbeat upon hospital admission, maternal deaths, discharges, and total inpatient days. We calculated the proportion of district months where data were not identical between the district reports and the MOH electronic database and the percentage difference for those months
Table 1 Population and patient data sources of information
Indicator Source Reference
source
Time period
Analysis
Availability Presence/absence of monthly maternity and immunization program reports on file
Monthly facility reports Not applicable
Nov. 1, 2007-Oct. 31, 2008
Presence/absence of monthly reports at health facility and district health departments
Reliability First ANC, institutional birth, DPT3, HIV testing, and outpatient consults
Facility clinical registries, monthly facility reports
Facility clinical reports
July 1, 2008-Dec. 31, 2008
Percent matching months between facility clinical registries and monthly facility reports, percent difference for non-identical months
Immunization and maternity reports*
Monthly facility reports, MOH electronic database
Monthly facility reports
Nov. 1, 2007-Oct. 31, 2008
Percent matching months between monthly district reports and MOH electronic database
Validity First ANC, institutional birth, DPT3
Provincial annual health report (data from MOH electronic database)
DHS, MICS 1995-2008
Percent of provincial annual health report figures falling within the 95% confidence intervals of DHS/ MICS survey estimates, correlation coefficient from weighted linear regression
DHS 1997,
2003
MICS 2008
*Indicators in immunization report include target group, tetanus first dose, tetanus second to fifth dose, total tetanus doses, coverage rate/goal, doses used, and wastage rate. Indicators in maternity reports include institutional birth, live births, low-weight births, stillbirths, stillbirths with heartbeat upon hospital admission, discharges, total inpatient days.
when data were not identical. Data collection for asses-sing data reliability was carried out by MOH provincial level health managers and NGO counterparts over a period of two weeks.
Data validity
To assess data validity, we compared statistics supplied from the provincial health department’s annual reports (which use data from the MOH electronic database) with those obtained from the 1997 and 2003 Mozambi-que Demographic Health Surveys (DHS) and the 2008 Multiple Indicator Cluster Survey (MICS). The DHS and MICS surveys were national-level community-based surveys, carried out in Mozambique following standar-dized and internationally-recognized methodology (Table 1). [12,13]
For this analysis, we focused on three provincial-level indicators that were representative of PHC and obtain-able from all three aforementioned sources: ANC cover-age, institutional birth covercover-age, and DPT3 coverage. For the surveys, ANC coverage was defined as births that received ANC from a trained health professional during pregnancy, institutional birth coverage was defined as births that occurred in a health facility, and DPT3 coverage as the proportion of children 12 to 23 months old who had received three DPT immunizations (from documentation on immunization cards or mothers’reports) at the time of the survey. Due to data constraints for the variable indicating site of delivery in the MICS dataset, we estimated institutional birth cover-age from this dataset using a different question ascer-taining whether births were attended by a doctor, nurse, or midwife. In the DHS, the concordance between these two items was very good (33.9% vs. 34.0% in the 1997 DHS and 57.4% vs. 56.1% in the 2003 DHS, for births in a health facility versus births attended by a doctor, nurse, or midwife, respectively), justifying its use in the 2007 MICS dataset.
For ANC and institutional birth coverage, we harmo-nized the DHS and MICS by including responses from women who had given birth in the previous two years before the survey (1995-1996 for the 1997 DHS, 2001-2002 for the 2003 DHS, and 2006-2007 for the 2008 MICS). We estimated DPT3 coverage up to two (1997 DHS) and four (2003 DHS and 2008 MICS) years prior to the survey. We utilized the responses recorded for children aged 12-23 months, 24-35 months, 36-47 months, and 48-59 months to estimate coverage for 1 year, 2 years, 3 years, and 4 years prior to the survey, respectively.
MOH statistics were collected from the Sofala provin-cial health department annual reports, which were derived from the MOH electronic database for the numerators, and census data for the denominators. DHS
and MICS metrics were obtained from the original DHS and MICS datasets from http://www.measuredhs.com and the Mozambican National Institute of Statistics, respectively. For all DHS and MICS analyses, we used only data from Sofala Province to obtain provincial-level estimates.
Secular trends of HIS data derived from the MOH electronic database and the community level surveys (DHS and MICS) with 95% confidence intervals were plotted. Note that HIS data do not have calculable con-fidence intervals, as they are not estimates derived from sampling but rather represent the entirety of provincial-level data. To evaluate the degree of correlation between the two data sources, we first determined the proportion of HIS annual estimates that were within the 95% confi-dence intervals of the corresponding DHS/MICS esti-mate. Next, we determined the degree of correlation between the annual HIS and corresponding DHS/MICS figures, using a weighted linear regression model with the survey estimate as the dependent variable and the HIS data as the independent variable. The weights were inversely proportional to the variance of the survey esti-mates. The correlation coefficient was determined by taking the square root of the R-squared estimate. For ANC coverage and institutional birth delivery, we com-pared the 1995-1996, 2001-2002, and 2006-2007 survey estimates to the mean of the administrative data over these two years, while the yearly DPT3 estimates were compared to the administrative estimate for the corre-sponding year.
All simple descriptive statistics were carried out using Stata version 11.1 (College Station, Texas, USA).
Results and discussion
Data availability
Over the 12-month study period included in analysis of data availability (November 1, 2007 through October 31, 2008), 97% (105/108) of immunization and 99% (107/ 108) of maternity monthly facility reports were properly on file at the health facility level. At the district health departments, 99% (35/36) of the monthly facility reports for immunization and 100% (36/36) of the maternity reports were properly filed and available. In some cases, health facilities did not make copies of the report to keep on file before sending it on to the district level.
Data reliability
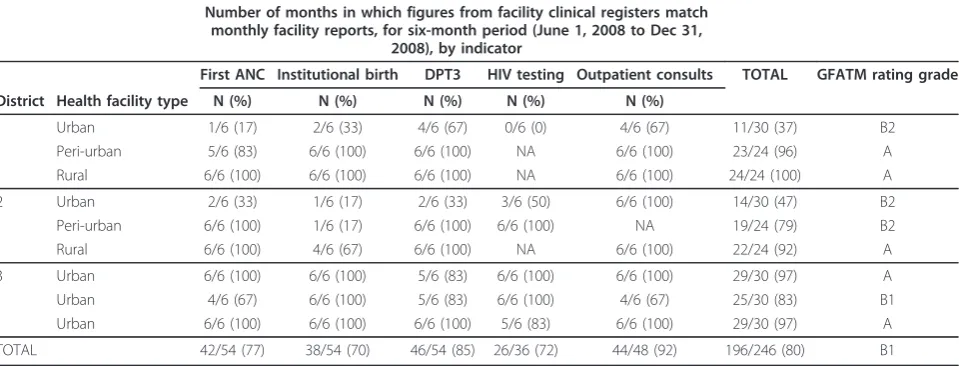
facility clinical registries and monthly facility reports matched exactly on the five key indicators (Table 2).
When two sites, both urban facilities, were excluded from the analysis, the concordance was markedly better (92%) and the GFATM data verification rating jumped from borderline B1/B2 to A (Table 2). Of the 50 monthly figures which did not match exactly, the med-ian percentage difference was 4% (range <.01%-59%) and the majority (86%) differed by 10% or less. Most of the monthly disagreements (35/50, 70%) were from the two larger-district urban health facilities, highlighting that the majority of problems were confined to a few sites. Among the various indicators, the weakest reliability was noted in institutional birth and ANC registration (28/50, 56%) (Table 3).
In addition, 96% (242/252) of the monthly aggregated district reports for immunization and 98% (287/288) of monthly aggregated district reports for maternity ser-vices matched the information available through the MOH electronic database over the 12-month period.
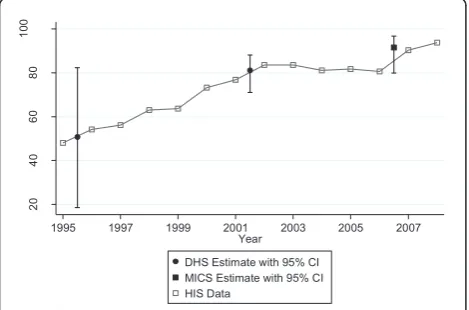
Data validity
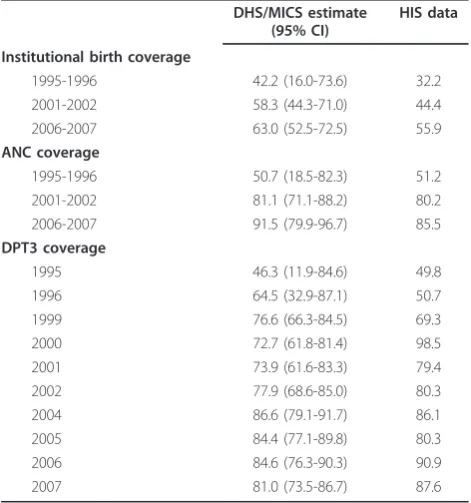
The comparisons of DHS and MICS with MOH electro-nic database information were similar in terms of abso-lute results for the three variables considered: ANC coverage, institutional birth coverage, and DPT3 cover-age (Figures 2, 3, and 4). Table 4 shows the survey esti-mates and HIS data for the corresponding time period. Overall, 81% (13/16) of the HIS data were within the 95% confidence interval of the corresponding survey estimate. Data for DPT3 coverage for 2000 (DHS: 72.7 [61.8-81.4] vs. HIS: 98.5), 2006 (DHS: 84.6 [76.3-90.3] vs. HIS: 90.9) and 2007 (DHS: 81.0 [73.5-86.7] vs. HIS:
87.6) were not located within the 95% confidence inter-val. In comparing the two data sources, the correlation coefficient was 0.73; however, the correlation was 0.88 when the DPT3 data points for both sources from the year 2000 (the point with the most discrepant results in the entire analysis) were excluded.
Limitations
This study was limited by the relatively small sample of health facilities included, as well as the limited geo-graphic area. In addition, the effect of the disaggregation of data and the use of a small number of sites may have contributed to the very good concordance demonstrated between facility level data and the MOH electronic data-base. Likewise, aggregation of data at the provincial level may have effectively hidden problematic sites when comparing validity with the findings of population level surveys.
An additional limitation of the study was the use of provincial MOH health managers and NGO counter-parts to carry out the data collection. Provincial MOH managers are technically responsible for data quality in the province and thus may have been biased in their collection. Although this may be deemed a limitation by some, the full involvement of MOH managers in this data quality audit was regarded as essential programma-tically in order to build local capacity and ownership over the process.
Conclusions
The results of this evaluation, which used relatively sim-ple, rapid tools, suggest that in this study setting, rou-tine administrative data are adequately available, reliable,
Table 2 Concordance between health facility clinical registries and monthly facility reports for five key indicators and GFATM data verification ratings
Number of months in which figures from facility clinical registers match monthly facility reports, for six-month period (June 1, 2008 to Dec 31,
2008), by indicator
First ANC Institutional birth DPT3 HIV testing Outpatient consults TOTAL GFATM rating grade
District Health facility type N (%) N (%) N (%) N (%) N (%)
1 Urban 1/6 (17) 2/6 (33) 4/6 (67) 0/6 (0) 4/6 (67) 11/30 (37) B2
Peri-urban 5/6 (83) 6/6 (100) 6/6 (100) NA 6/6 (100) 23/24 (96) A
Rural 6/6 (100) 6/6 (100) 6/6 (100) NA 6/6 (100) 24/24 (100) A
2 Urban 2/6 (33) 1/6 (17) 2/6 (33) 3/6 (50) 6/6 (100) 14/30 (47) B2
Peri-urban 6/6 (100) 1/6 (17) 6/6 (100) 6/6 (100) NA 19/24 (79) B2
Rural 6/6 (100) 4/6 (67) 6/6 (100) NA 6/6 (100) 22/24 (92) A
3 Urban 6/6 (100) 6/6 (100) 5/6 (83) 6/6 (100) 6/6 (100) 29/30 (97) A
Urban 4/6 (67) 6/6 (100) 5/6 (83) 6/6 (100) 4/6 (67) 25/30 (83) B1
Urban 6/6 (100) 6/6 (100) 6/6 (100) 5/6 (83) 6/6 (100) 29/30 (97) A
TOTAL 42/54 (77) 38/54 (70) 46/54 (85) 26/36 (72) 44/48 (92) 196/246 (80) B1
NA = not applicable because the service was either not provided at the site (HIV) or not available during the data collection period (outpatient) (Key for abbreviations–ANC: antenatal care, DPT3: third diptheria, pertussis, and tetanus immunization)
and consistent from the health facility to the provincial health department levels. The exercise was also helpful in pointing out discrepancies between clinic registers and monthly facility reports at two district urban health facilities and within the maternity and antenatal care settings. The DHS/MICS and HIS data comparisons confirm that over time at the provincial level, the data are valid and useful for program monitoring, evaluation, and planning. Notably, at the data points where the HIS and DHS/MICS data were the most discrepant (the comparison of DPT3 coverage in 2000), our findings were consistent with previous studies. These studies identified increases in multiple countries in reported coverage of DPT3 based on HIS data in the year follow-ing the implementation of a global initiative to expand vaccination coverage, and for which fund distribution was dependent on the coverage rate in the second year (which was 2000 for Mozambique) [5].
Of the many past reports and studies that have found administrative data in developing countries to be of poor quality and unreliable for disease or program
surveillance, most have suggested that the root cause of the problem is the lack of significant value assigned by clinic-level health workers to the quality of administra-tive data collection [6,14]. Indeed, it is widely recognized that health systems rarely use routinely-collected data to improve functioning [15,16]. In order for this to improve, district- and health facility-level managers need expanded skills to allow for full involvement in the pro-cess of evaluating their data.
Though this research project was not designed to determine the cause of variation in data reliability, other similar studies carried out in resource-constrained envir-onments have described the importance of human resource levels, management and planning capacity, infrastructure capacity, and the like in determining data quality. The Mozambique health system is faced with significant constraints in these areas, which may explain variation in data reliability across different services.
PHC service-strengthening in Sofala Province should enhance the design, testing, and subsequent use of simi-lar operational research tools to further expand the
Table 3 Distribution of discordant monthly figures from health facility clinical registries versus monthly facility reports
District Health facility type First ANC Institutional birth DPT3 HIV testing Outpatient consults TOTAL
1 Urban 5 4 2 5 2 18
Peri-urban 1 0 0 0 0 1
Rural 0 0 0 0 1 1
2 Urban 4 5 4 3 1 17
Peri-urban 0 5 0 0 0 5
Rural 0 2 0 0 0 2
3 Urban 0 0 1 0 0 1
Urban 2 0 1 0 1 4
Urban 0 0 0 1 0 1
TOTAL 12 16 8 9 5 50
(Key for Abbreviations–ANC: antenatal care, DPT3: third diptheria, pertussis, and tetanus immunization)
20
40
60
80
10
0
1995 1997 1999 2001 2003 2005 2007
Year
DHS Estimate with 95% CI MICS Estimate with 95% CI HIS Data
*Survey estimates plotted at the mid-point of the two years they represent
Figure 2ANC coverage, Sofala Province, 1995-2007: HIS versus DHS/MICS.
20
40
60
80
10
0
1995 1997 1999 2001 2003 2005 2007
Year
DHS Estimate with 95% CI MICS Estimate with 95% CI HIS Data
*Survey estimates plotted at the mid-point of the two years they represent
quality and use of routine data by health managers and policymakers alike. Health managers accustomed to using health systems data and ensuring their quality through bottom-up audits will be invaluable to the ongoing decentralization process and will provide valu-able lessons for other areas of Mozambique and possibly sub-Saharan Africa.
Acknowledgements
The authors wish to thank Jim Hughes for his contributions during the data analysis phase and to Eva Duarte, Francisco Macuacua, Laurinda Matunha, Fernando Baloi, and the members of the Sofala Province health department for their contributions during the data collection process.
Author details
1
Department of Global Health, School of Public Health and Community Medicine, University of Washington. Seattle, WA 98195, USA.2Health Alliance International, 4534 11th Ave NE, Seattle, WA 98105, USA.3Health Alliance International-Beira, Rua Aires de Ornela Nr. 458 R/C, Beira, Mozambique. 4
Provincial Department of Health-Sofala Province, Rua Mayor Serpa Pinto 294, 4 Andar, Sector Reparticao de Saude da Communidade, Beira, Mozambique.5Eduardo Mondlane University, Community Health Department, Maputo, Mozambique.
Authors’contributions
SG was responsible for the initial conception and design of the data, participated in the data analysis and drafted the original text. MM participated in the data analysis and made significant comments on progressive drafts. BL provided input on the design of the study, provided critical input in the data analysis, and commented on progressive drafts. JL supported data collection and provided input on progressive drafts. MK provided critical input in design of the data and supported the data collection process. FC gave input on the development of the discussion section and gave input on progressive drafts. SSG participated in the initial design of the study and provided input on progressive drafts. JP gave input on the development of the discussion section and helped in revisions of the final draft. KS provided critical input into the initial design of the study and made significant comments on progressive drafts, All authors read and approved the final manuscript.
Competing Interests
The authors declare that they have no competing interests.
Received: 26 January 2011 Accepted: 13 May 2011 Published: 13 May 2011
References
1. Fendall NR:Declaration of Alma-Ata.Lancet1978,2:1308. 2. World Health Organization:Health Metrics Network Framework and
Standards for Country Health Information Systems.World Health Organization, Geneva; 2008.
3. Peersman G, Rugg D, Erkkola T, Kiwango E, Yang J:Are the investments in national HIV monitoring and evaluation systems paying off?J Acquir Immune Defic Syndr2009,52(Suppl 2):S87-96.
4. Ronveaux O, Rickert D, Hadler S, Groom H, Lloyd J, Bchir A, Birmingham M: The immunization data quality audit: verifying the quality and consistency of immunization monitoring systems.Bull World Health Organ 2005,83:503-510.
5. Lim SS, Stein DB, Charrow A, Murray CJ:Tracking progress towards universal childhood immunisation and the impact of global initiatives: a systematic analysis of three-dose diphtheria, tetanus, and pertussis immunisation coverage.Lancet2008,372:2031-2046.
6. Mate KS, Bennett B, Mphatswe W, Barker P, Rollins N:Challenges for routine health system data management in a large public programme to prevent mother-to-child HIV transmission in South Africa.PLoS One 2009,4:e5483.
7. Garrib A, Stoops N, McKenzie A, Dlamini L, Govender T, Rohde J, Herbst K: An evaluation of the District Health Information System in rural South Africa.S Afr Med J2008,98:549-552.
8. Pfeiffer J, Montoya P, Baptista AJ, Karagianis M, Pugas Mde M, Micek M, Johnson W, Sherr K, Gimbel S, Baird S, Lambdin B, Gloyd S:Integration of HIV/AIDS services into African primary health care: lessons learned for health system strengthening in Mozambique - a case study.J Int AIDS Soc13:3.
9. Marchal B, Cavalli A, Kegels G:Global health actors claim to support health system strengthening: is this reality or rhetoric?PLoS Med2009,6: e1000059.
10. Instituto Nacional de Estatistica:Censo Mocambique 2007.Maputo2008.
20
40
60
80
10
0
1995 1997 1999 2001 2003 2005 2007
Year
DHS Estimate with 95% CI MICS Estimate with 95% CI HIS Data
Figure 4 DPT3 coverage, Sofala Province, 1995-2007: HIS versus DHS/MICS.
Table 4 DHS/MICS estimates versus HIS data for the corresponding time period
DHS/MICS estimate (95% CI)
HIS data
Institutional birth coverage
1995-1996 42.2 (16.0-73.6) 32.2
2001-2002 58.3 (44.3-71.0) 44.4
2006-2007 63.0 (52.5-72.5) 55.9
ANC coverage
1995-1996 50.7 (18.5-82.3) 51.2
2001-2002 81.1 (71.1-88.2) 80.2
2006-2007 91.5 (79.9-96.7) 85.5
DPT3 coverage
1995 46.3 (11.9-84.6) 49.8
1996 64.5 (32.9-87.1) 50.7
1999 76.6 (66.3-84.5) 69.3
2000 72.7 (61.8-81.4) 98.5
2001 73.9 (61.6-83.3) 79.4
2002 77.9 (68.6-85.0) 80.3
2004 86.6 (79.1-91.7) 86.1
2005 84.4 (77.1-89.8) 80.3
2006 84.6 (76.3-90.3) 90.9
2007 81.0 (73.5-86.7) 87.6
11. The Global Fund to Fight HIV/AIDS Tuberculosis and Malaria Data Quality Audit Tool.[http://www.theglobalfund.org/documents/me/ Guidelines_LFA_DQ_Verifications.pdf].
12. UNICEF.[http://www.unicef.org/statistics/index_24302.html]. 13. ORC Macro.[http://www.measuredhs.com].
14. Forster M, Bailey C, Brinkhof MW, Graber C, Boulle A, Spohr M, Balestre E, May M, Keiser O, Jahn A, Egger M:Electronic medical record systems, data quality and loss to follow-up: survey of antiretroviral therapy programmes in resource-limited settings.Bull World Health Organ2008, 86:939-947.
15. Doherty T, Chopra M, Nsibande D, Mngoma D:Improving the coverage of the PMTCT programme through a participatory quality improvement intervention in South Africa.BMC Public Health2009,9:406. 16. Nash D, Elul B, Rabkin M, Tun M, Saito S, Becker M,
Nuwagaba-Biribonwoha H:Strategies for more effective monitoring and evaluation systems in HIV programmatic scale-up in resource-limited settings: Implications for health systems strengthening.J Acquir Immune Defic Syndr2009,52(Suppl 1):S58-62.
doi:10.1186/1478-7954-9-12
Cite this article as:Gimbelet al.:An assessment of routine primary care health information system data quality in Sofala Province, Mozambique. Population Health Metrics20119:12.
Submit your next manuscript to BioMed Central and take full advantage of:
• Convenient online submission
• Thorough peer review
• No space constraints or color figure charges
• Immediate publication on acceptance
• Inclusion in PubMed, CAS, Scopus and Google Scholar
• Research which is freely available for redistribution