R E S E A R C H
Open Access
Evaluation and design of highly reliable and
highly utilized cloud computing systems
Brett Snyder
1, Jordan Ringenberg
3, Robert Green
2*, Vijay Devabhaktuni
1and Mansoor Alam
1Abstract
Cloud computing paradigm has ushered in the need to provide resources to users in a scalable, flexible, and transparent fashion much like any other utility. This has led to a need for developing evaluation techniques that can provide quantitative measures of reliability of a cloud computing system (CCS) for efficient planning and expansion. This paper presents a new, scalable algorithm based on non-sequential Monte Carlo Simulation (MCS) to evaluate large scale cloud computing system (CCS) reliability, and it develops appropriate performance measures. Also, a new iterative algorithm is proposed and developed that leverages the MCS method for the design of highly reliable and highly utilized CCSs. The combination of these two algorithms allows CCSs to be evaluated by providers and users alike, providing a new method for estimating the parameters of service level agreements (SLAs) and designing CCSs to match those contractual requirements posed in SLAs. Results demonstrate that the proposed methods are
effective and applicable to systems at a large scale. Multiple insights are also provided into the nature of CCS reliability and CCS design.
Keywords: Cloud computing; Reliability; System design; Monte Carlo simulation
Introduction
Cloud computing provides a cost-effective means of trans-parently providing scalable computing resources to match the needs of individual and corporate consumers. Despite the heavy reliance of society on this new technological paradigm, failure and inaccessibility are quickly becom-ing a major issue. Current reports state that up to $ 285 million yearly have been lost due to such failures with an average of 7.74 hours of unavailability per service per year (about 99.91 % availability) [1–3]. Despite these out-ages, rapid adoption of cloud computing has continued for the mission-critical aspects of the private and public sec-tors, particularly due to the fact that industrial partners are unaware of this issue [2, 3]. This is particularly discon-certing considering President Obama’s $ 20 billion dollar Federal Cloud Computing Strategy and the rapid migra-tion of government organizamigra-tions like NASA, the Army, the Federal Treasury, Alcohol, Tobacco, and Firearms, the Government Service agency, the Department of Defense, and the Federal Risk and Authorization Management
*Correspondence: [email protected]
2Department of Computer Science, Bowling Green State University, 1001 E. Wooster St., 43403 Bowling Green, OH, USA
Full list of author information is available at the end of the article
Program to cloud based IT services [4, 5]. Furthermore, companies such as Netflix, IBM, Google, and Yahoo are heavily investing in cloud computing research and infras-tructure to enhance the reliability, availability, and security of their own cloud based services [6–8].
Thus, from the user’s perspective, there is a great need to build a highly available and highly reliable cloud. While cloud providers feel the necessity to provide not only high levels of availability and reliability to meet quality-of-service (QoS) requirements and quality-of-service level agreements (SLAs), but also desire to build a highly utilized sys-tem, with hopes of leading to higher profitability. Under these considerations, the balance between maximal uti-lization of a cloud computing system’s (CCS’s) resources is in direct conflict with the cloud user’s interest of high reliability and availability. In other words, the provider is willing to allow a degradation in reliability as long as their profitability continues as, in reality, it is the user, not the provider, that pays the economic consequences of cloud failures. Note that from a user-based, SLA driven perspec-tive, reliability refers to the ability of the cloud to serve the user’s need over some time period and does not refer to simple failures within a CCS that do not hinder user service.
This need to provide a highly reliable, uninterrupted cloud service while effectively utilizing all available resources is highly desired by cloud providers/users and clearly demonstrates a gap in current CCS research, call-ing for the establishment of efficient methods which can quantitatively evaluate and design CCSs based on the competing needs of users (reliability) and providers (uti-lization). As such, the goal of this study is the design and evaluation of CCSs considering stochastic failures in the CCS as well as stochastic virtual machine (VM) requests.
In order to achieve this goal, this study makes mul-tiple contributions including 1) Developing a compu-tationally efficient method for evaluating the reliability of CCSs using non-sequential Monte Carlo simulation (MCS) considering stochastic hardware failures and VM requests, 2) Extending this new model in order to design highly reliable and utilized CCSs based on potential work-loads, and 3) Discussing the practical implications of the proposed technique. As opposed to most previous work, the proposed method 1) Focuses on simulation-based analysis, 2) Is highly scalable due to the use of MCS, and 3) Uses a newly developed, intuitive system representation.
The remainder of this paper is organized as fol-lows: Section “Related works” reviews background lit-erature that is pertinent to the proposed methodology; Section “Proposed methodologies” presents the the newly proposed application of non-sequential MCS, its formu-lation for assessing the reliability of a CCS, and its use in a new, iterative algorithm for designing highly reli-able and highly utilized CCSs; Section “Experimental results” details the experimental results achieved includ-ing CCS test systems designed and evaluated usinclud-ing the proposed methods; Section “Discussion” presents a dis-cussion and comments on using non-sequential MCS as a tool for CCS reliability assessment and the role of this technology in SLAs. Insights gathered during CCS reliability assessments and CCS design are also given in Section “Practical implications”; and, finally, Section “Conclusion” concludes the paper with a summary as well as directions for future work.
Related works
Cloud computing reliability
Many works reference the terms reliability and avail-ability when focused on CCSs. Though, in most cases, the terms refer to increasing system stability through active management [9] or redundancy [10, 11]. While these works begin to lay a strong foundation in this area, they also expose certain gaps in knowledge. Most of these works tend to evaluate either some aspect of QoS or the impact of hardware failures. Many of the ini-tial works focus on the use of Markov chains [12–16],
as a CCS is effectively a complex network availabil-ity problem. Other works focus on conceptual issues [17–19], hierarchical graphs [20], the use of grid com-puting for dynamic scalability in the cloud [21], and priority graphs [22], or the development of performance indices [23].
When considering QoS, one of the largest bodies of work has been completed by Lin and Chang [24–29]. These works develop a sequential and systematic method-ology based on capacitive flow networks for maintaining the QoS of a CCS with an integrated maintenance budget. The main focus of the model is maintaining acceptable transmission times between clients and providers given a certain budget. The work developed in [30] presents a hierarchical method for evaluating availability of a CCS that is focused on the response time of user requests for resources. The majority of the work deals with VM failure rates, bandwidth bottlenecks, response time, and latency issues. The demonstrated solutions to these issues are the use of their newly developed architecture along with request redirection. A similar, though only concep-tual approach, is developed in [31, 32] where a Fault Tolerance Manager (FTM) is developed and inserted between System and Application layers of the CCS. Another approach to this issue is an optimal checkpoint-ing strategy that is used to ensure the availability of a given system [33, 34]. Other methods of approaching fault tolerance from a middleware perspective can be found in [20, 35].
While the previous works have dealt mainly with the modeling of user requests and data transmission, another important aspect of system failure in a CCS is the failure of hardware. The state-of-the-art in this area is embod-ied in five main works that focus on evaluating data logs from multiple data centers and/or consumer PCs. The evaluation of these logs begins in [36] where hard-ware failures of multiple data centers are examined to determine explicit rates of failure for different compo-nents — namely disks, CPUs, memory, and RAID con-trollers. The most important finding of this paper is that the largest source of failure in such data centers is disk failure. Intermittent hardware errors are evaluated in [37].
This work continues in [38] where failures in CPU, DRAM, and disks in consumer PCs are evaluated. Spe-cial attention is paid to recurring faults as the work suggests that once a PC component fails, it is much more likely to fail again. The paper also examines fail-ures that are not always noticeable to an end-user, such as 1-bit failures in DRAM. A thorough evaluation of failures and reliability at all levels of the CCS is found in [39].
These studies conclude that 1) Data center networks are highly reliable, 2) Switches are highly reliable, 3) Load balancers most often experience faults due to software failures, 4) Network failures typically cause small failures that lose a large number of smaller pack-ets, and 5) Redundancy is useful, but not a perfect solution.
An interesting companion to the study of hardware fail-ures is the large scale performance study performed in [42]. While this study does not explicitly focus on fail-ures or reliability, it does provide a thorough analysis of resource utilization and general workloads in data centers. The work evaluates the utilization of various hardware pieces including CPUs, memory, disks, and entire file systems.
Monte Carlo simulation
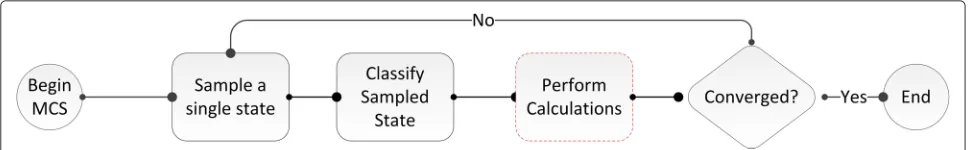
MCS is a stochastic simulation tool which is often used to evaluate complex systems as it remains tractable regard-less of dimensionality. The MCS algorithm comes in two varieties: non-sequential and sequential. Sequential MCS is typically used to evaluate complex systems that require some aspect of time dependence. Because of this, this variant of the algorithm requires more computational overhead and takes longer to converge. Non-sequential-MCS (referred to as Non-sequential-MCS for the remainder of this study) exhibits a higher computational efficiency than sequential MCS. The downside of the non-sequential MCS algo-rithm is that the rate at which convergence time typically increases with problem dimensionality or system size. Also note that the rate of convergence for MCS is 1/√N where N is the number of samples drawn. This means that convergence does not depend upon dimensional-ity, allowing MCS to handle problems with a large state space. While this can become an issue, it is easily han-dled as the MCS algorithm is highly parallel and, in the case of long running simulation requirements, may be easily parallelized in order to quickly simulate complex systems.
The general non-sequential MCS algorithm used for evaluating a CCS in this study is shown in Fig. 1. As the
general operation of the MCS requires the repeated sam-pling of a state space and the evaluation of those states sampled, all four steps of the MCS algorithm (sampling, classification, calculation, and convergence) are depen-dent on an efficient representation of individual states. This representation as well as further details regarding the implementation of MCS in this study are detailed in the following section.
Proposed methodologies
This section presents a review of the non-sequential MCS algorithm in a formulation applicable to CCS reliability evaluation. While this formulation is focused on evaluat-ing the reliability of a CCS, this same algorithm can be used to 1) Evaluate the reliability of an already existing CCS under various loads (or, potentially in real-time) and 2) Design a CCS with a high level of reliability that is also highly utilized. As such, this section also presents an itera-tive algorithm for the design of a highly reliable and highly utilized CCS.
Such a simulation-based technique is required because, when hardware resources are considered, it is impor-tant to look beyond a simple calculations that determine whether or not enough resources are available. A more complex issue is calculating the amount of resources required in light of the stochastic failure rates of hard-ware resources in the system as coupled with varying user requests for VMs. In such a case, one must look at the state of the system across multiple “snapshots” of existence in order to ensure that enough resources will be available to handle the workload, even when some portion of hard-ware fails or general usage increases. Non-sequential MCS allows for such an analysis.
System evaluation using MCS
As described in the previous section, the MCS algorithm is highly dependent on an efficient method for state rep-resentation in order to achieve convergence through the iterative process of sampling a state, classifying a state, performing any necessary calculations, and then checking
convergence. Each of these algorithmic steps are dis-cussed in the subsections below. As the study is focused on evaluating and designing systems with a high level of reliability (the probability of the system functioning dur-ing some time period, t) from a user-based perspective, throughout this work the assumption is maintained that the system is measured and evaluated while in use. In other words, unallocated resources and their failures are not considered.
The following sections describe the state representa-tion used in the MCS algorithms as well as each stage of the MCS algorithm used in this study (sampling, classi-fication, and determining convergence). According to the process defined in Fig. 1, the MCS algorithm will use the state representation to repeatedly sample the state space, classify each sampled state, and then determine convergence based on these details.
State representation
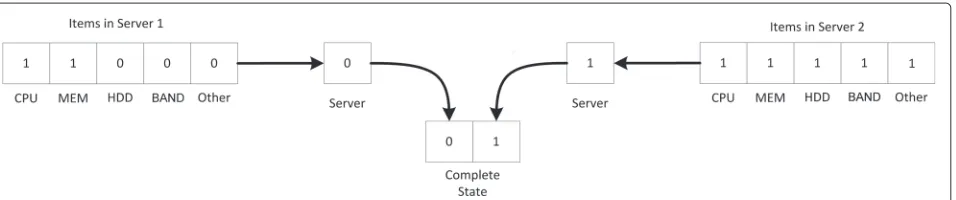
In this study, we consider the modeling of a single server that exists inside of a CCS. Such a server can be repre-sented as anY-bit bit field,X, whereY is the number of resource types being considered. Using a bit field repre-sentation is not a new concept as it is commonly used in a variety of disciplines and problem formulations, but the authors are unaware of any use of this methodology to represent CCSs. In the proposed representation, each bit represents the state of a resource; a “1” denotes an up/functioning state and a “0” a down/failed state. This type of state is depicted in Fig. 2. Furthering this rep-resentation, the state of a single server can be distilled to a single bit according to (1) whereS is a single state with I resources each represented asXi. This
method-ology results in an entire CCS may be represented as a binary vector with each bit representing the state of a single server, either failed — 0 — or functioning — 1. Since each server can take on 2 possible states, the entire state space will consist of 2N states, where N is the total number of servers. Again, this provides a highly expandable framework for representing and evaluating
very large CCSs (i.e. adding a single bit to the binary CCS vector for each additional server). This state repre-sentation scheme is highly advantageous, allowing for a high level of customization and extensibility, leading to an array of variations that should be able to model all available cloud computing service types (i.e. IaaS, SaaS, PaaS, etc.). The only change for considering an addi-tional resource type is appending an extra bit to each server’s binary state string as represented by a binary number. For example, if there was a need to extend this model to include a network interface card (NIC) on each server, the bit representation could simply be extended by a single digit. This could be done for any variety of resources.
One objection that may be raised to this methodol-ogy is the lack of inclusion regarding partially failed, de-rated, or grey states. Such states do play an impor-tant role, particularly when considering specific resources. For example, portions of a hard drive may be marked as damaged or unusable and, thus, excluded from total resources available. Though, as the state model is highly malleable, de-rated states may be included through the inclusion of a three-or-more state model where the 0/1 model currently suggested is replaced by a 0/1/2 model where zero represents a completely failed resource, one represents a derated resource, and two rep-resents a fully functioning resource. For the purposes of this research, such an extension is left for future work.
For the simulations performed in this study, servers are considered as consisting of CPU, memory, hard disk drive (HDD), and bandwidth resources orP,M, H, and B respectively. Thus, the state of a single server is rep-resented as a 4-bit, bit field (e.g. a state of 1101 repre-sents a server with CPU, memory, and bandwidth in up states and the HDD in a failed state). This state clearly represents the IaaS model of cloud computing (provid-ing requested infrastructure resources) and is chosen as IaaS is the foundation for other types of services (i.e. SaaS is built upon PaaS which is, in turn, built upon IaaS). Accordingly, this state space representation may be
expanded to encompass resources specific to each of these models.
S=
I
i=1
Xi (1)
Sampling
In order to effectively sample a state from a given state space, a uniform distribution,u, is used. Since the relia-bility of a device is exponentially distributed according to its annual failure rate (AFR), each uniformly distributed number is transformed into an exponentially distributed number. Thus,uiis transformed into an exponentially
dis-tributed random number,ri, using the well-known
inver-sion method, according to (2). An AFR represents the estimated probability that a device will fail during a full year of use. In this study, allAFRvalues are derived from the work found in [36–42].
The binary state string,X, is constructed by generat-ing a series of random values that are compared to each resource’sAFR. Specifically, the value of any given loca-tion in the state string will be determined by comparingri
to theAFRof resourceiaccording to (3).
ri= −ln(1−ui)/AFRi (2)
Xi=
0 ri≤AFRi
1 otherwise (3)
Note that AFR is a simplistic measure of system avail-ability in contrast to a more robust measure like forced outage rate (FOR). This is because AFR does not take into account the combination of failure and repair rates that a measure like FOR encompasses. As this is an exploratory study, the authors chose AFR rather than the FOR due to the lack of accurate repair and failure rates for CPUs, HDDs, memory, etc.
State classification
The state classification step of MCS relies on a straight-forward comparison of the resources requested and resources available as a measure of system adequacy. Thus, a state will be sampled and the provided resources are compared to those available. For the system to ade-quately supply the needed resources the relation in (4) must hold for each individual CCS resource as defined below.
Yrequested≤Yavailable (4)
When a CCS supplies more resources than are requested the system will be in a functioning state. In any
other case the system will have failed. The mathematics of this method are shown in (5)–(8). Note that this method-ology may easily be extended to any number or resources including databases, software packages, etc.
Yrequested= V
v=0
Yv (5)
Yavailable= S
s=0
Ys (6)
Ycurtailed=
0 Yrequested≤Yavailable
1 otherwise (7)
Sx=
0 YYcurtailed>0
1 otherwise (8)
It should be noted that this is an approximation of a real-world scenario. In reality, the assignment and usage of resources is more accurately calculated using a bin pack-ing formulation — an extension that is currently slated for future work.
Determining convergence
In order to evaluate system level performance using MCS, some measure must be calculated in order to determine convergence of the algorithm. As the goal of this study is the evaluation of reliability and utilization, the metric for convergence is defined asR.Ris defined as the probabil-ity that a CCS will be encountered in a functional state and is defined in (9) and (10) as the ratio of failed states sampled to total states sampled (K). WhileRis the metric of interest in this study, convergence is determined by the metricF, or the probability that the CCS will be found in a failed state. In order to determine convergence, variance (σ2) and standard deviation (σ) of theF value are calcu-lated as defined in (11)–(12). Note that it is well known that MCS converges at a rate of 1/√N and that a more detailed derivation of (9)-(12) for MCS can be found in [43].
F= 1 K
K
x=1
Sx (9)
R=1−F=1− 1 K
K
x=1
Sx (10)
σ2(F)= 1 K(F−F
2) (11)
σ(F)= √
V(F)
F (12)
Convergence criteria
reliable CCS systems will exhibit few such states and will take longer to converge than a system with a state space containing an abundance of failure states. The sampling of failed states drivesσ(R)towards 0, to provide an accu-rate estimate of R. In this study, there are two rules for determining whether the non-sequential MCS algorithm has converged:
(iterations>10 andσ(R) <0.080) (13) or
(iterations>20, 000 andR>0.999999). (14) The first convergence criterion provides early termina-tion for simulatermina-tions that have an extremely lowRafter the first 10 samples (Generally, a highly unreliable system). The second convergence criterion keeps highly reliable (R > 0.999999) CCSs from running for long periods of time due to the very sparse distribution of failed states in the state space.
System design using MCS
While the proposed implementation of MCS is focused on evaluating the reliability of complex CCSs, the same algo-rithm also has applications in designing highly reliable, highly utilized CCSs. In this study an iterative algorithm for designing such a system (and, potentially expand-ing that system) is developed. Though this algorithm is used in this study for the design of test systems (i.e. model systems that are used for testing the proposed MCS algorithm), the algorithm may also be used for the planning and design of highly reliable, highly uti-lized CCSs under predicted loads. The algorithm itself relies on the prospect of increasing the amount of avail-able resources that currently cause resource inadequacies. The additional resources yield simultaneous increases in CCS reliability as well as overall resource utilization. The novel algorithmic process of enhancing CCS reliability and resource utilization when the addition of resources is possible is summarized in Algorithm 1 whereRdesired
and UTILdesired are the desired level of system reliabil-ity and system utilization,Ractual andUTILactual are the measured levels of system reliability and utilization, and VMcountis the number of VMs currently allocated. While
this algorithm may appear to be deterministic, the MCS algorithm embedded inside of the algorithm is stochastic and considers the probabilistic failure of available system resources. This means that the amount of resources avail-able are not increased simply to accommodate the amount of resources requested (which is a simple calculation). Instead, the algorithm increases the amount of resources available in order to handle resource requests while also considering stochastic failures of system resources, thus solving a much more difficult problem and leading to a more robust system design.
Algorithm 1Basic algorithm for iteratively developing a highly reliable, highly utilized cloud computing system
Choose 0≤Rdesired≤1 Choose 0≤UTILdesired≤1
ChooseVMcount≥0
Ractual,UTILactual ← MCS Algorithm (Considers
stochastic resource failures)
while (Ractual < Rdesired) and (UTILactual <
UTILdesired) do
forEach Resource,Y ∈ {P,M,H,B}do if Resourcerequested>Resourceavailable then
IncreaseResourceavailable
end if end for
Ractual,UTILactual ← MCS Algorithm (Considers
stochastic resource failures)
//If necessary, change number of VMs to achieve result
ChooseVMcount≥0 to achieve desired CCS load
end while
If the addition of resources to the CCS is infeasi-ble, one way to control the reliability is to perturb the number of VM allocations as opposed to adjusting the amount of resources. The optimal number of maximum VM allocations to satisfy a pre-specified reliability thresh-old can be easily calculated by repeatedly applying the non-sequential MCS algorithm. After each MCS iteration, the number of VMs allocated is adjusted up or down if the reliability is higher or lower than the threshold respec-tively. Conversely, if the reliability is at a desired level and resources cannot be added to improve resource utilization (and the number of maximum VM allocations is satis-factory), excess, under-utilized resources can be removed from the CCS and re-purposed.
Experimental results
This section will present the implementation details of the simulation software as well as an overview of test system design and the different VM allocation schemes that are used. Actual results from CCS reliability simulations are also introduced and analyzed.
Implementation notes
and 8GB RAM. All of the results are stored in a MySQL database for future analysis.
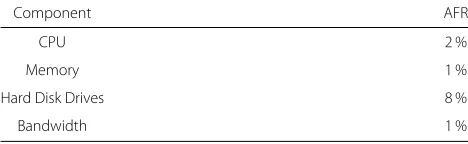
In each simulation, a CCS is abstracted to consist of a finite pool of available and requested resources. The avail-able resources correspond to the servers that compose a cloud. The requested resources consist of the VMs allo-cated on the cloud. The specific resources focused on within this study include CPUs, memory, hard disk drives (HDD), and bandwidth. Each simulation resource is tied to a pre-specified AFR. The specific AFRs used in this study are shown in Table 1. The AFRs used were gathered and estimated from practical and theoretical research in the current literature that analyzed hardware failures of CCSs [12, 36, 38, 40–42].
In order to provide for composition of more complex CCSs as well as reusable resource definitions, the soft-ware is built around a hierarchy of components. The most basic component is a single server consisting of a finite pool of CPU, memory, HDD, and bandwidth resources. From here, clusters are constructed as groups of servers and clouds are built from a collection of clusters. Likewise, the requested resources are constructed from a hierarchi-cal abstraction. The most basic unit is a VM consisting of a finite pool of CPU, memory, HDD, and bandwidth resources. Individual VMs are combined into groups to represent the total requested resources. In conjunction with grouping individual VMs together, a probability dis-tribution is assigned in accordance with how each type of VM in that group is to be allocated.
The simulations are setup by specifying a particular set of available resources in the form of a cloud, and a set of requested resources in the form of a VM grouping. The non-sequential Monte-Carlo algorithm is run to conver-gence for each simulation. It is important to note that individual component failures are not tracked by the MCS algorithm. In reality, a specific component that fails once has been shown to fail more often than its peers. This simplification of the state space allows the non-sequential MCS algorithm to converge more efficiently than one that keeps track of this additional information. Thus, the AFRs used in each simulation apply to all resources, and are never modified based on past inadequacies.
There were two types of simulations performed over the course of this study which differ in the way VMs are allo-cated. The first scheme allocates VMs in a static manner,
Table 1Annual Failure Rates (AFR) used in the simulations
Component AFR
CPU 2 %
Memory 1 %
Hard Disk Drives 8 %
Bandwidth 1 %
in which all trials of a single simulation have identical VM allocations. This scheme results in a tight bound on the variance of the reliability of repeated simulations due to the only stochastic behavior arising within the MCS algo-rithm. The process for performing a static allocation is shown in Algorithm 2 whereVMinstancesrefers to the
cur-rent set of VMs being allocated on the CCS,VMinstanceis
a single VM instance,PROBiis the probability of a single
type ofVMinstanceoccurring, andirefers to a singular VM
type.
Algorithm 2Algorithm for static VM allocation Choose SET(VMinstances)
for eachVMinstanceido
Choose 0≤PROBi≤1
end for
Require: PROBi=1
ChooseVMcount≥0
for eachVMinstancei do
AllocateVMcount*PROBiinstances ofi
end for
The second allocation scheme adds a second source of stochastic behavior to the reliability simulation. In this scheme, the allocation of VMs is based on a user specified probability distribution over a discrete set of VM types. Multiple simulations set up identically under this arrangement will have varying VM allocations. This scheme provides a view of highly dynamic VM allocation policies, and provides insight on how to better control the overall reliability in these rapidly changing environments. Algorithm 3 details the process of dynamic VM allocation.
Algorithm 3Algorithm for dynamic VM allocation Choose SET(VMinstances)
for eachVMinstanceido Choose 0≤PROBi≤1 end for
Require: PROBi=1
ChooseVMcount≥0 for 1 toVMcount do
sum=0
Generate random number 0≤r≤1 for probiinPROB do
sum=sum+probi if r≤sumthen
Allocate VM of typei end if
Test systems
Due to a lack of standardized test CCSs within literature, the authors needed to develop test-bed systems for simu-lation. In order to accomplish this goal, this study began with the small CCS depicted in Table 2. The table depicts the total available server resources as well as the resources consumed by the allocation of one VM. This CCS for-mulation provided insights into 1) What caused different types of hardware failures, 2) The ways in which conver-gence of the MCS is reached (from above or below), and 3) The number of iterations required for convergence. Based on this initial system, further and more complex systems were designed in order to test the proposed methodology.
Static VM allocation
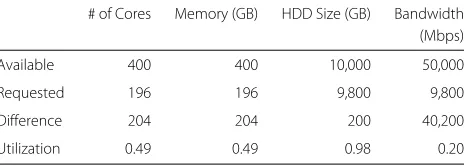
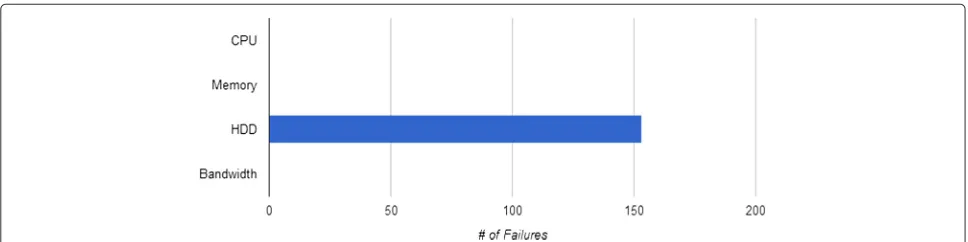
An overview of a test-bed simulation with an allocation of 98 VMs is shown in Table 3 and the reliability aver-aged over 20 trials is 0.98±0.0025. The results from a typical trial are shown in Figs. 3 and 4. It is evident that the HDD resource is the cause of all 153 failures dur-ing the simulation. This is due to the high utilization of the HDD resource (98 %) and comparatively low utiliza-tion of all other resources (49 % for CPU and memory and 20 % utilization for bandwidth). This shows that the cloud provider could serve many more VMs if they were to add more HDD to this particular cloud. The extra HDD resource would allow for more VM’s to be allocated on the cloud and in effect allow for a much larger utilization percentage of the other resources.
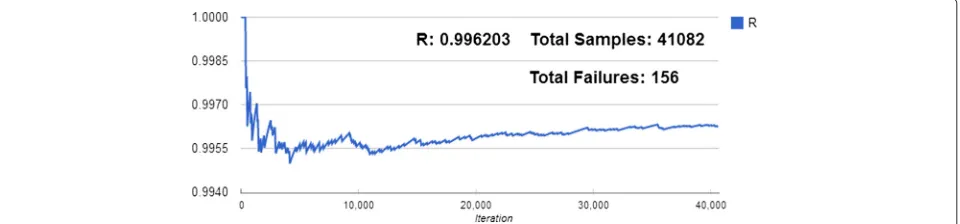
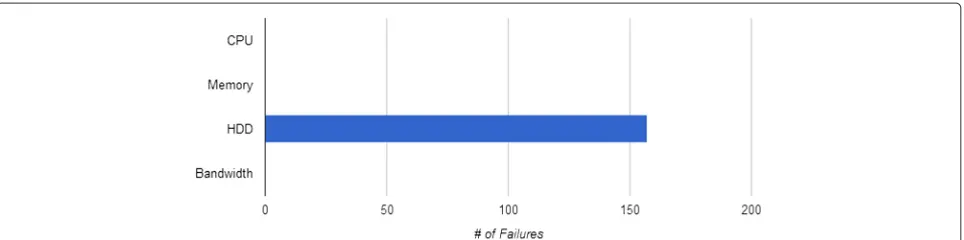
As such, another simulation is performed with an extra 10,000 GB of HDD resources to the test-bed CCS (Table 4). The results of this simulation with an alloca-tion of 194 VMs is shown in Figs. 5 and 6. The overview table shows that the utilization of the CPU, memory, and bandwidth resources have almost doubled while the HDD utilization has been decreased slightly. The result-ing reliability averaged over 20 trials is 0.9960±0.0003. The additional HDD resources have yielded a substan-tial increase in total cloud utilization while simultaneously increasing the reliability by around 2.22 %. Consequently, the cloud provider was able to supply an additional 96 VMs to consumers with a much higher reliability than in the previous example. Also noteworthy is that the main resource inadequacy is still HDD. This behavior is due to the significantly higher AFR of HDD versus the other resources. The ability to quickly modify CCS resources
Table 2Small test-bed CCS used in initial simulations
# of Cores Memory (GB) HDD Size (GB) Bandwidth (Mbps)
Available 400 400 10,000 50,000
Each VM 2 2 100 100
Table 3Test-Bed CCS - 98 VM’s
# of Cores Memory (GB) HDD Size (GB) Bandwidth (Mbps)
Available 400 400 10,000 50,000
Requested 196 196 9,800 9,800
Difference 204 204 200 40,200
Utilization 0.49 0.49 0.98 0.20
in conjunction with the efficiency of the MCS algorithm’s convergence allows for quick and easy design of highly reliable and highly utilized CCSs.
The design of highly reliable and highly utilized clouds strikes a balance between resource utilization that is high enough to use a majority of cloud resources yet is safely below the threshold in which many concurrent failures are likely. Since the reliability of a resource is exponen-tially distributed in accordance with its AFR, resources with high AFRs must be carefully considered, especially at high utilization percentages. In the previous examples the HDD resource was highly utilized, yet it also has an AFR much higher than any of the other resources con-sidered. This over-utilization of a failure prone resource provides an opportunity to greatly improve CCS relia-bility. Using the iterative algorithm from section 4.3, the test-bed CCS from Table 4 is optimized to obtain a much higher reliability by allocating only 190 VM’s (rather than the 194 that were previously requested). The resulting R value averaged over 20 trials is 0.999970±0.000031, which is around a 0.4 % improvement. All resource inadequacies are due to HDD again, reinforcing the detrimental effects of high AFRs on a CCS’s reliability. More iterations of Algorithm 1 can be performed in order to further increase CCS reliability, yet resource utilization will be reduced.
Subsequently, more complex CCSs are designed with the insights gained from the test-bed system in mind. After qualifying the impacts of various resource alloca-tions, the authors simulate a real world virtual CCS run by the Extreme Science and Engineering Discovery Envi-ronment (XSEDE) partnership [44]. The XSEDE partner-ship is composed of numerous United States universities. XSEDE is an advanced, powerful, and robust collection of integrated advanced digital resources and services that supports a CCS composed of 16 supercomputers as well as high-end data visualization and data analysis resources. The hardware resources provided by the XSEDE CCS are depicted in Table 5.
Fig. 3Pattern of reliability convergence — initial simulation. Pattern of reliability convergence for the initial test-bed CCS simulation as defined in Table 3
EC2 VMs allows for the exploration of complex CCSs with much more complex allocation configurations, especially when the distribution of VMs is assigned in accordance with a probability distribution.
Simulation of the XSEDE CCS
The XSEDE cloud which has many more resources avail-able than the original test-bed system, proves much more difficult in balancing high reliability with high utiliza-tion. Initially, allocation of each type of Amazon EC2 VM instance is varied based on the amount of resources provided. Achieving high CCS reliability is quite straight-forward in this manner. Yet, finding a balance of EC2 instances that also yielded a high utilization of each resource is highly difficult. This makes sense as the XSEDE cloud is primarily aimed at scientific computing and data visualization which requires allocations that are quite different than the normal EC2 instances. For exam-ple, an M1 Small or M1 Medium instance would rarely be allocated on the XSEDE CCS as it would be insuffi-cient for performing large scale sinsuffi-cientific calculations. A more likely scenario would be the allocation of VMs which utilize much higher quantities of each resource, such as the Cluster Compute Eight Extra Large EC2 instance. Yet, even when allocation is performed using only the most intensive EC2 VMs there is still an overreliance on CPU
and HDD. The EC2 VMs also have bandwidth requests that are minimal compared to the jobs that are most likely performed on the XSEDE supercomputers.
Many configurations can be achieved using all of the EC2 instances which provide high reliability and high resource utilization of 2 out of the 4 resources (almost exclusively CPU and HDD). Bandwidth is always under-utilized at around 7–10 %. The main conclusion that can be drawn is that in order to effectively serve VM alloca-tions likened to the EC2 instances, the XSEDE CCS would greatly benefit from additional CPU and HDD resources. The addition of these resources would allow the XSEDE CCS to serve many more VMs under the conditions of this study at an even higher reliability level. Another important observation is that VM instances that are light on resources are very good at increasing utilization to a desired level without sacrificing reliability. This behavior is very similar to the way in which a bucket can be filled to the brim with coarse rocks yet there is always room to add in finer particles to fill in the empty voids.
Results of a simulation performed with the XSEDE CCS are shown in Figs. 7 and 8 with the VM allocation per-centages shown in Fig. 9. There are a total of 13,000 VM instances allocated yielding CPU, memory, HDD, and bandwidth utilizations of 0.95, 0.25, 0.98, and 0.08 respec-tively. Of note is the 5,015,055 sampled states that are
Table 4Test-bed CCS (with extra HDD) - 194 VM’s
# of Cores Memory (GB) HDD Size (GB) Bandwidth (Mbps)
Available 400 400 20,000 50,000
Requested 388 388 19,400 19,400
Difference 12 12 600 30,600
Utilization 0.97 0.97 0.97 0.39
required for convergence compared with the simulation displayed in Figs. 5 and 6 in which only 41,082 sam-ples are needed. This increase in sampling illustrates the importance of developing more sophisticated failure-state sampling schemes to speed up MCS convergence for large CCS systems.
Probability based VM allocation
Simulations are also performed in which multiple, dif-ferent VM instances are allocated on the CCS in corre-spondence with a specified probability distribution. This enables the evaluation of a more realistic set of simula-tions that showcase how allocation variability affects the overall reliability of a CCS. The most important observa-tion from these simulaobserva-tions is that the reliability of a CCS can vary wildly when a fixed number of VMs are allocated using a specified probability distribution. In the event that a multitude of resource intensive VMs are allocated on the cloud the CCS would be very likely to fail. Con-versely, if a majority of the VM allocations are very light on resource requirements the CCS would exhibit 100 % reliability.
For example, a simulation is performed using three of the Amazon EC2 VM instances: M1 Small, M1 Medium, and M1 Large with respective allocation probabilities of 50 %, 30 %, and 20 %, sampled from a uniform distribu-tion. The XSEDE cloud is used as the available resources (Fig. 5) and 31,050 VMs are allocated using the specified distribution. The CCS’s reliability varies from 0.0 to 1.0 over the course of 500 simulations. The average R value is
0.89±0.1912. Fig. 10 shows a histogram of the R values for the 500 simulations with a bin size of 0.01. Although the resulting distribution of CCS reliability is heavily skewed to the highly reliable side, it is very important to note that there are a total of 9 simulations that resulted in immedi-ate, total failures (R value of 0.0). A specific allocation that results in a R of 1.0 was characterized by allocation per-centages of 50.8 %, 29.7 %, and 19.4 % for the M1 Small, M1 Medium, and M1 Large VMs. Likewise, an allocation that results in a R of 0.0 consisted of 49.4 %, 30.2 %, and 20.4 % of M1 Small, M1 Medium, and M1 Large VMs. These numbers illustrate how a slight difference in VM allocation can result in a large change in the reliability of a CCS.
For comparison, 500 simulations are performed using the exact setup described above except that the VM types are statically allocated. Hence, M1 Small, M1 Medium, and M1 Large occupy 50 %, 30 %, and 20 % of the 31,050 VM allocations respectively for all 500 simulations. This simulation results in a R value of 0.9917±0.0006. The min-imum and maxmin-imum R values are 0.989304 and 0.993757, respectively. These simulations illustrate that even a sim-ple CCS under a dynamic allocation policy can exhibit highly deceptive reliability characteristics when too few simulations are performed.
This highly erratic reliability behavior is a direct result of the combined use of probabilistic methods of VM alloca-tion and the design of a test system that is highly utilized. In any highly utilized system, a slight variance in workload can easily move a system from highly utilized and stable to over-utilized and unstable. This also showcases the value of the novel application of non-sequential MCS in order to efficiently simulate a CCS numerous times. This behavior becomes even more variable when more than three VM types are used in the probability distribution. The abil-ity to assess the distribution of reliabilabil-ity across a broad range of allocation schemes greatly aids in designing a CCS that maintains high reliability. Without an abundance of simulations, the design of highly reliable CCSs is a futile exercise within such a dynamic environment.
Fig. 6Component failures — initial simulation plus 10,000 GB HDD. Component failures by resource type for initial test-bed CCS simulation with 10,000 GB extra HDD resource as defined in Table 4
Discussion
A recurring observation throughout the empirical sim-ulations is the importance of matching VM allocations to hardware that is specifically suited to the type of job at hand. For instance, naively allocating 116,000 small test-bed VM’s on the XSEDE cloud results in a reliabil-ity of 98.7 % due to shortage of hard disk resources. In addition, this setup does not efficiently utilize the avail-able CPU (68 %), memory (34 %), or bandwidth (5 %) resources.
Yet, when a hand crafted group of VM’s that are much more CPU and memory intensive are allocated on the XSEDE cloud the total pool of resources are much more efficiently utilized; all while retaining a very high degree of reliability (≥ 99.9999 %). It is quickly evident that groups of VMs can be engineered to cause any particu-lar type of resource inadequacy. Furthermore, it is very likely that users requesting resources that do not require
Table 5XSEDE Cloud Resources (Est. Bandwidth)
Cluster # of Cores Memory HDD Size Bandwidth
(GB) (GB) (Mbps)
Ranger 62,976 125,952 1,810,560 3,936,000
Wispy 128 512 8,000 32,000
GordonION 768 3,072 256,000 640,000
KrakenXT75 112,896 150,528 2,455,488 9,408,000
Lonestar 4 22,656 45,312 275,648 18,880,000
Steele 7,144 28,576 446,500 893,000
Gordon Compute Cluster
16,384 65,536 4,096,000 102,400,000
Trestles 10,368 20,736 143,208 3,240,000
Quarry 896 3,584 2,128 112,000
Stampede 102,400 204,800 320,000 87,296,000
Blacklight 1,024 32,768 150,000 15,000
Keeneland 4,224 8,448 1,761,144 3,600,960
Totals 341,864 689,824 11,724,676 236,212,960
a large amount of storage space would typically see fail-ures in other components — CPUs, RAM, etc. Yet, this same functionality can be leveraged to craft probability distributions over VM instances that allow for highly reli-able clouds with each individual resource being highly utilized. By intelligently allocating the proper types of VM instances, overall cloud reliability can be controlled with a fine degree of precision while efficiently using the available resource pool. In fact, if the probability distribution over VM instances and AFRs are known, limits on CCS reliability can be readily established via simulation.
For instance, Fig. 11 depicts repeated simulations of the XSEDE CCS with varying numbers of VMs allocated.
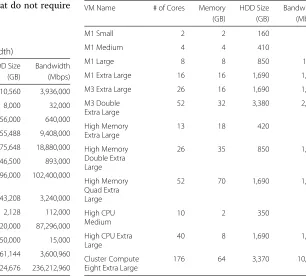
Table 6Amazon EC2 VM instances (Est. Bandwidth)
VM Name # of Cores Memory HDD Size Bandwidth
(GB) (GB) (Mbps)
M1 Small 2 2 160 100
M1 Medium 4 4 410 500
M1 Large 8 8 850 1000
M1 Extra Large 16 16 1,690 1,000
M3 Extra Large 26 16 1,690 1,000
M3 Double Extra Large
52 32 3,380 2,000
High Memory Extra Large
13 18 420 500
High Memory Double Extra Large
26 35 850 1,000
High Memory Quad Extra Large
52 70 1,690 1,000
High CPU Medium
10 2 350 500
High CPU Extra Large
40 8 1,690 1,000
Cluster Compute Eight Extra Large
Fig. 7Pattern of reliability convergence — XSEDE CCS. Pattern of reliability convergence for the XSEDE CCS (Table 5) simulation using the VM allocation shown in Fig. 9
The VM instances used in this simulation were the EC2 instances: M1 Small, M1 Medium, and M1 Large, at distribution percentages of 20 %, 40 %, and 40 %, respec-tively. The figure shows that the XSEDE CCS can ade-quately supply resources for 21,567 VMs, while retaining a reliabilty greater than 99.9104 %. If the number of VM allocations is decreased to 21,447, the minimum relia-bility over 10 trials increases to 99.9992 %. Of course, these results are highly dependent on the accuracy of the AFRs specified at simulation time, as well as the num-ber of trials performed. This method can be extended to establish accurate CCS reliability curves that illustrate CCS reliability characteristics across a wide range of VM allocations.
Limitations
It is important to note that this methodology consid-ers a worst case scenario in which all VM allocations consume full resources at all times. In reality, a server hypervisor manages the resources requested by each VM, allowing more VM guests to be allocated without detri-mental impacts on overall cloud reliability. For instance, one physical CPU core may be mapped to four virtual CPU cores and each guest VM will wait for its share of virtual cores to be available from the hypervisor to run their compute tasks. Similarly, a storage hypervisor can be
used to manage virtualized storage resources to increase utilization rates of disk while maintaining high reliability.
Further, this study only considers the availability of the servers hosting the VMs and does not consider other sub-systems like external storage, storage area network (SAN), or failures in other systems such as software bugs or human error. There are also other features of the cloud that cannot be modeled by this approach which affect the overall reliability such as live migration of VMs, or spe-cific CCS network topologies such as DCell which have nodes with varying importance to overall CCS reliabil-ity. Live migration of VMs can increase the reliability of the cloud by allowing VMs to be seamlessly transferred between servers for load balancing or server repair. The CCS network topology can have large consequences on overall reliability as server centric architectures like DCell have relay nodes that are more important than individ-ual compute nodes for CCS reliability. Further, oversub-scription has further implications that may also impact reliability.
Practical implications
The importance of cloud availability and reliability extend beyond academic interest as they also have monetary consequences when considering cloud SLAs. For exam-ple, the Amazon EC2 SLA states that Amazon will use
Fig. 9Distribution of EC2 VM instances (Table 6) used in the XSEDE CCS simulation
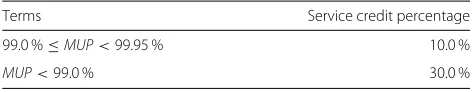
commercially reasonable efforts to make Amazon EC2 and Amazon ABS each available with a MUP of at least 99.95 % [46]. Amazon calculates MUP by subtracting the percentage of minutes during the month in which the Amazon service is in a state of “Region Unavailable.” This leaves a mere 21.6 minutes of downtime that Amazon is allotted to meet a MUP of 99.95 % in a 30 day month. In the event that Amazon cannot meet the terms of this SLA, a credit is issued to the consumer in accordance with Table 7. Rackspace, on the other hand, guarantees that their infrastructure will be available 100 % of the time and will issue account credits up to the full monthly fee for affected servers based on the number of hours the server is down [47].
The cloud resource providers are not the only parties that experience detrimental economic effects from CCS
downtime. CCS resource consumers lose money each minute that their website or IT infrastructure is down. According to InformationWeek, IT downtime costs $ 26.5 billion in lost revenue per year [48]. Thus, there is a mutual interest in making CCS availability and resilience approach 100 %. This is in addition to other cloud com-puting consequences that could arise including data loss and data security. In order to retain its customer base, CCS providers must be highly aware of the consequences of downtime as well as pro-actively pursuing increased reliability by continually re-evaluating their infrastructure to provide highly available and reliable service. This is especially important in light of the sheer number of CCS failures and issues showcased on the IWGCR website [1]. In order to uphold such stringent uptime requirements efficient, effective ways of evaluating and improving cloud
Fig. 11Minimum CCS reliability based on number of VM Allocations (10 trials)
reliability and availability are extremely important. In fact, when dealing with such high MUPs, availability, and lost revenue requirements, every minute of uptime is cru-cial. The methods developed in this study for the design and evaluation of CCSs provides one set of tools for effi-ciently pursuing this goal. CCS providers can leverage the proposed algorithms to assess their infrastructure from a vantage point of both reliability and utilization. Non-sequential MCS and its derivatives may also be used to validate and assess their SLAs in order to ensure that they are effortlessly meeting the required MUPs. The resource expansion and planning algorithms can be iter-atively applied to maximize revenue and minimize costs associated with providing CCS resources to consumers. The decision to add resources to a CCS no longer would be necessitated by a failure, but could be justified by quantitative metrics provided via the proposed methods. These methods can also save time by simulating new CCS designs prior to actually building physical systems to ensure that the resources will be sufficient for the expected VM allocation load.
Conclusion
This study has presented and analyzed a novel approach to assessing the reliability of CCSs using non-sequential
Table 7SLA service commitments and credits
Terms Service credit percentage
99.0 %≤MUP<99.95 % 10.0 %
MUP<99.0 % 30.0 %
MCS. It was shown that non-sequential MCS provides an efficient and flexible way to determine the reliability of a CCS based on a set of discrete resources. A novel algorithm for CCS expansion planning was also intro-duced which facilitates the design of highly reliable and highly utilized CCSs. Finally, new test-bed CCS systems were developed that can be used for future CCS reliability and availability analyses. Based on the insights garnered during this study, future work may include the following:
• An extension of the CCS expansion planning
algorithm developed in this study to incorporate economic factors to simultaneously maximize CCS reliability and the cloud providers return on investment (ROI);
• As this study considered a CCS to have only CPU,
memory, HDD, and bandwidth resources, a future extension may include graphics processing units (GPUs), databases, software packages, etc. This extension would provide for highly realistic simulations that take into account many more variables than were considered in this preliminary study.
• An extension of the proposed algorithm to consider
partially failed or derated states. For instance, a multiple core CPU may still function at a reduced level if only a subset of the available cores fail;
• Evaluating implications of server and storage
hypervisors on the reliability of a CCS instead of using a simple resources requested vs. available scheme; and
• This study has made an important approximation —
additive manner. In the future, this will be improved to formulate the resource assignments via a bin packing problem formulation for more realistic results.
Competing interests
The authors declare that they have no competing interests.
Authors’ contributions
BS developed the simulation software, carried out the simulations, analyzed results, and drafted the manuscript. JR aided in simulation analysis and helped to draft the manuscript. RG participated in the conception, design, and implementation of the study and helped to draft the manuscript. VD helped to conceive of and plan the study while also contributing to the manuscript. MA conceived of the study and helped draft the manuscript. All authors read and approved the final manuscript.
Authors’ information
BS received his B.S. in Computer Science and Engineering, B.S. in Electrical Engineering, and M.S. in Computer Science and Engineering from the University of Toledo (UT) in Toledo, OH in 2010 and 2013, respectively. His research interests include the application of computer science to cloud computing, machine learning, artificial intelligence, and signal processing. In 2009, he received the UT Electrical Engineering Student of the Year Award. JR received his B.S. degree in Computer Science in 2009 and his M.S. degree in Computer Science in 2011 from Bowling Green State University (BGSU). He was awarded his Ph.D. from the University of Toledo in 2014, where his research focused on biomedical imaging and virtual reality-based modeling applications. He is now an Assistant Professor of Computer Science at The University of Findlay, where he is performing research in Human-Computer Interaction (HCI) and usability engineering, in addition to his interests in computer vision and virtual reality.
RG received his B.S. in Computer Science from Geneva College in 2005, his M.S. from Bowling Green State University in 2007, and his Ph.D. from the University of Toledo in 2012. He currently serves as an Assistant Professor at Bowling Green State University. His research is driven by a love for code and covers a variety of areas including High Performance Computing, Population-based Metaheuristics, Software Development, and the application of these interests to the evaluation and analysis of complex networks including the power grid and cloud computing systems.
VD received the B.Eng. degree in EEE and the M.Sc. degree in physics from BITS, Pilani, in 1996, and the Ph.D. in electronics from Carleton University, Canada, in 2003. Since 2008, he is an Associate Professor in the EECS Department at the University of Toledo. Dr. Devabhaktuni’s R&D interests include applied electromagnetics, biomedical applications of wireless sensor networks, computer aided design, device modeling, image processing, infrastructure monitoring, neural networks, optimization methods, power theft modeling and education, RF/microwave devices, and virtual reality. MA received the B.S. degree in Electrical Engineering with honors from AMU Aligarh, India in 1969. He received the M.E. with distinction and Ph.D. degrees from IISc. Bangalore, in 1971 and 1974 respectively. He served as the Graduate Director of the EECS Department from 1996 - 1998 and the Undergraduate Director of the CSE program from 1998 - 2001. He received 2008 EECS Teacher of the year award, 2008 College of Engineering Outstanding Teacher award and 2006 IEEE Engineer of the year award of the Toledo Section of the IEEE.
Author details
1Department of Electrical Engineering & Computer Science, University of Toledo, 2801 W. Bancroft St., 43406 Toledo, OH, USA.2Department of Computer Science, Bowling Green State University, 1001 E. Wooster St., 43403 Bowling Green, OH, USA.3Department of Computer Science, The University of Findlay, 1000 North Main St., 45840 Findlay, OH, USA.
Received: 9 June 2014 Accepted: 11 May 2015
References
1. IWGCR: International Working Group on Cloud Computing Resiliency. http://iwgcr.org/ (2013)
2. Gagnaire M, Diaz F, Coti C, Cerin C, Shiozaki K, Xu Y, Delort P, Smets JP, Lous JL, Lubiarz S, Leclerc P (2011) Downtime statistics of current cloud solutions. Technical report, International Working Group on Cloud Computing Resiliency (June 2012) https://iwgcr.files.wordpress.com/ 2012/06/iwgcr-paris-ranking-001-en1.pdf
3. Cerin C, Coti C, Delort P, Diaz F, Gagnaire M, Gaumer Q, Guillaume N, Lous J, Lubiarz S, Raffaelli J, Shiozaki K, Schauer H, Smets J, Seguin L. Downtime statistics of current cloud solutions. Technical report, International Working Group on Cloud Computing Resiliency (June 2013) http://iwgcr. org/wp-content/uploads/2013/06/IWGCR-Paris.Ranking-003.2-en.pdf 4. Kundra V. Federal cloud computing strategy. Technical report, The United
States Government https://www.dhs.gov/sites/default/files/publications/ digital-strategy/federal-cloud-computingstrategy.pdf
5. Rosenberg J, Mateos A (2011) The Cloud at Your Service: The When, How, and Why of Enterprise Cloud Computing. 1st edn. Manning Publications, Greenwich, Connecticut
6. Izrailevsky Y, Tseitlin A (2011) The Netflix Simian Army. http://techblog. netflix.com/2011/07/netflix-simian-army.html
7. IBM/Google Academic Cloud Computing Initiative. http://www. cloudbook.net/directories/research-clouds/ibm-google-academic-cloud-computing-initiative (2012)
8. Cloud Computing. http://labs.yahoo.com/nnComputing (2011) 9. Chang CS, Bostjancic D, Williams M (2010) Availability management in a
virtualized world. In: Boursas L, Carlson M, Jin H, Sibilla M, Wold K (eds). Systems and Virtualization Management. Standards and the Cloud. Communications in Computer and Information Science, vol 71. Springer, Berlin Heidelberg Vol. 71. pp 87–93
10. Bauer E, Adams R (2012) Reliability and Availability of Cloud Computing. 1st edn. Wiley-IEEE Press, Piscataway, New Jersey
11. Oner KB, Scheller-Wolf A, van Houtum G-J (2013) Redundancy optimization for critical components in high-availability technical systems. Oper Res 61(1):224–264
12. Kim DS, Machida F, Trivedi KS (2009) Availability modeling and analysis of a virtualized system. In: 15th IEEE Pacific Rim International Symposium on Dependable Computing, Shanghai, China. pp 365–371
13. Ghosh R, Trevedi K, Naik V, Kim D (2012) Interacting markov chain based hierarchical approach for cloud services. Technical report, IBM (April 2010) http://domino.research.ibm.com/library/cyberdig.nsf/papers/
AABCE247ECDECE0F8525771A005D42B6
14. Che J, Zhang T, Lin W, Xi H (2011) A markov chain-based availability model of virtual cluster nodes. In: International Conference on Computational Intelligence and Security, Hainan, China. pp 507–511 15. Zheng J, Okamura H, Dohi T (2012) Component importance analysis of
virtualized system. In: International Conference on Ubiquitous Intelligence and Computing, Fukuoka, Japan. pp 462–469
16. Longo F, Trivedi K, Russo S, Ghosh R, Frattini F (2014) Scalable Analytics for IaaS Cloud Availability. IEEE Trans Cloud Comput 99(PrePrints):1 17. Zissis D, Lekkas D (2012) Addressing cloud computing security issues.
Future Generation Comput Syst 28(3):583–592
18. Page S Cloud computing-availability. Technical report, ISA/BIT Learning Centre http://uwcisa.uwaterloo.ca/Biblio2/Topic/ACC626
19. Ahuja SP, Mani S (2012) Availability of services in the era of cloud computing. Netw Commun Technol 1(1):2–6
20. Wang W, Chen H, Chen X (2012) An availability-aware approach to resource placement of dynamic scaling in cloud. In: IEEE Fifth International Conference on Cloud Computing, Honolulu, Hawaii. pp 930–931 21. Jeong YS, Park JH (2013) High availability and efficient energy
consumption for cloud computing service with grid infrastructure. Comput Electrical Eng 39(1):15-23. http://www.sciencedirect.com/ science/article/pii/S0045790612000456
22. Manesh RE, Jamshidi M, Zareie A, Abdi S, Parseh F, Parandin F (2012) Presentation an approach for useful availability servers cloud computing in schedule list algorithm. Int J Comput Sci Issues 9(4):465–470 23. Ferrari A, Puccinelli D, Giordano S (2012) Characterization of the impact of
resource availability on opportunistic computing. In: MCC Workshop on Mobile Cloud Computing. ACM, Helsinki, Finland. pp 35–40
24. Lin YK, Chang PC (2010) Estimation of maintenance reliability for a cloud computing network. Int J Oper Res 7(1):53–60
25. Lin YK, Chang PC (2011) Maintenance reliability estimation for a cloud computing network with nodes failure. Expert Syst Appl
26. Lin YK, Chang PC (2011) Performance indicator evaluation for a cloud computing system from qos viewpoint. Quality & Quantity 47(3):1–12 27. Lin YK, Chang PC (2012) Evaluation of system reliability for a cloud
computing system with imperfect nodes. Syst Eng 15(1):83–94 28. Lin YK, Chang PC (2012) Approximate and accurate maintenance
reliabilities of a cloud computing network with nodes failure subject to budget. Int J Prod Econ 139(2):543–550
29. Lin YK, Chang PC (2012) Estimation Method to Evaluate a System Reliability of a Cloud Computing Network. United States Patent Application. http://www.google.com/patents/US20120023372 30. Qian H, Medhi D, Trivedi K (2011) A hierarchical model to evaluate quality
of experience of online services hosted by cloud computing. In: IFIP/IEEE International Symposium on Integrated Network Management, Dublin, Ireland. pp 105–112
31. Jhawar R, Piuri V, Santambrogio M (2012) A comprehensive conceptual system-level approach to fault tolerance in cloud computing. In: IEEE International Systems Conference (SysCon), Vancouver, BC. pp 1–5 32. Jhawar R, Piuri V (2013). Chapter 7 - Fault Tolerance and Resilience in
Cloud Computing Environments, In Computer and Information Security Handbook (Second Edition), edited by John R. Vacca, Morgan Kaufmann, Boston, 2013, Pages 125-141, ISBN: 9780123943972, http://dx.doi.org/10. 1016/B978-0-12-394397-2.00007-6. (http://www.sciencedirect.com/ science/article/pii/B9780123943972000076)
33. Limrungsi N, Zhao J, Xiang Y, Lan T, Huang HH, Subramaniam S (2013) Providing reliability as an elastic service in cloud computing. Technical report, George Washington University (February 2012) ISBN: 978-1-4577-2052-9
34. Singh D, Singh J, Chhabra A (2012) Failures in cloud computing data centers in 3-tier cloud architecture. Int J Inform Eng Electron Business 4(3):1–8
35. Zhao W, Melliar-Smith PM, Moser LE (2010) Fault tolerance middleware for cloud computing. In: International Conference on Cloud Computing, Miami, Florida. pp 1–8
36. Vishwanath KV, Nagappan N (2010) Characterizing cloud computing hardware reliability. In: Proceedings of the 1st ACM Symposium on Cloud Computing. SoCC ’10. ACM, New York, NY, USA. pp 193–204
37. Rashid L, Pattabiraman K, Gopalakrishnan S (2012) Intermittent hardware errors recovery: Modeling and evaluation. In: 9th International Conference on Quantitative Evaluation of SysTems. QEST 2012. pp 1–10 38. Nightingale EB, Douceur JR, Orgovan V (2011) Cycles, cells and platters: an
empirical analysisof hardware failures on a million consumer pcs. In: Proceedings of the Sixth Conference on Computer Systems. EuroSys ’11. ACM, New York, NY, USA. pp 343–356
39. Pham C, Cao P, Kalbarczyk Z, Iyer RK (2012) Toward a high availability cloud: Techniques and challenges. In: Second International Workshop on Dependability of Clouds, Data Centers and Virtual Machine Technology, Boston, Massachusetts. pp 1–6
40. Gill P, Jain N, Nagappan N (2011) Understanding network failures in data centers: measurement, analysis, and implications. In: Proceedings of the ACM SIGCOMM 2011 Conference. SIGCOMM ’11. ACM, New York, NY, USA. pp 350–361
41. Gill P, Jain N, Nagappan N (2011) Understanding network failures in data centers: measurement, analysis, and implications. SIGCOMM Comput Commun Rev 41(4):350–361
42. Birke R, Chen LY, Smirni E Data centers in the wild: A large performance study. Technical report, IBM (April 2012) http://domino.research.ibm. com/library/cyberdig.nsf/papers/0C306B31CF0D3861852579E40045F17F 43. Zio E (2013) Monte carlo simulation: The method. In: The Monte Carlo
Simulation Method for System Reliability and Risk Analysiss. Springer Series in Reliability Engineering. Springer, London
44. Extreme Science and Engineering Discovery Environment. https://www. xsede.org/home
45. Amazon EC2 Instance Types. http://aws.amazon.com/ec2/instance-types/ 46. Services AW (2013) Amazon EC2 Service Level Agreement. http://aws.
amazon.com/ec2-sla
47. Rackspace: Managed Service Level Agreement. http://www.rackspace. com/managed_hosting/support/servicelevels/managedsla/ (2013) 48. Harris C (2011) IT Downtime Costs $ 26.5 Billion In Lost Revenue. http://
www.informationweek.com/storage/disaster-recovery/it-downtime-costs-265-billion-in-lost-re/229625441
Submit your manuscript to a
journal and benefi t from:
7Convenient online submission 7Rigorous peer review
7Immediate publication on acceptance 7Open access: articles freely available online 7High visibility within the fi eld
7Retaining the copyright to your article