Abstract
Background:The subject’s inherent growth pattern can be an effective factor in characteristics of smile. More
vertical growth in the posterior maxilla than in the anterior maxilla could result in a changed relationship between the occlusal plane and the curvature of the lower lip upon smile. In order to broaden the understanding of how smile gets affected by growth pattern and the underlying hard tissues, the present study was undertaken to compare smile in various growth patterns, to determine sexual dimorphism, if any; as well as to correlate smile with underlying hard tissues.
Methods:One hundred and fifty subjects were selected amongst the students in the Dental Institute and from the
outpatient department of Department Orthodontics and Dentofacial Orthopedics. Sample selected for the study ranged in the age group of 17 to 25 years. Selected individuals were subjected to lateral head cephalometric radiography in the Department of Oral Medicine and Radiology and videography. Cephalograms were traced and the subjects were divided into horizontal, average, and vertical growth pattern on the basis of GoGn-SN, lower anterior facial height, and Jaraback’s ratio. The video clip was downloaded to obtain frame of posed smile. Cephalometric and photographic measurements were recorded and subjected to statistical analysis.
Results:The mean values of smile parameters were significantly higher in males as compared to females irrespective
of the growth pattern. The mean incisal display, interlabial gap, lower lip to incisal edge distance, upper vertical lip length, and occlusal plane angle was highest in both males and females of vertical facial growth pattern group; whereas, the smile index, posterior corridor (left and right) were less in vertical facial growth pattern group in both males and females. Thus, the parameters in vertical dimension were increased in vertical growers whereas, the parameters in transverse dimension decreased.
Conclusions:The facial growth pattern has significant influence on the parameters of smile along with definite sexual
dimorphism. The angular and linear parameters, except saddle angle and lower incisor to NB (linear and angular), influenced smile.
Background
The smile is one of the most important facial expres-sions and is essential in expressing friendliness, agree-ment, and appreciation. A smile when pleasing and attractive to observers enriches not only the one who smiles but also those who view it. An attractive or pleas-ing smile clearly enhances the acceptance of an individ-ual in the society by improving the initial impression in interpersonal relationships [1]. The esthetic consider-ations are paramount in treatment planning; however,
rigid rules cannot be applied to this process because al-most an infinite variety of faces could be esthetic [2].
There are two forms of smiles—the enjoyment or Duchenne smile and the posed or social smile. The posed smile is voluntary and not elicited by an emotion. In other words, it is reliably reproducible and can be sustained [3]. Posed smiles, therefore have importance in orthodontic diagnosis and treatment planning. The un-posed or social smile, however, is involuntary and is in-duced by joy or mirth. It is a natural response as it expresses authentic human emotion. Unlike the posed smiles, these smiles are not sustained.
The vertical aspects of smile anatomy are the degree of maxillary anterior tooth display (Morley ratio), upper lip * Correspondence:[email protected]
1
Nora Medical Polyclinics, Tower 4. Marks and Spencer Building, No. 106, Abu Dhabi, United Arab Emirates
Full list of author information is available at the end of the article
drape, and gingival display. In a youthful smile, 75–100 % of the maxillary central incisors should be positioned below an imaginary line drawn between the commis-sures [4]. Both skeletal and dental relationships contrib-ute to these smile components. The present study was undertaken to compare smile in various growth pat-terns, to determine sexual dimorphism, if any; as well as to correlate smile with underlying hard tissues.
Methods
In this cross-sectional study, a total of 150 subjects were selected amongst the students studying in Dental Col-lege and the outpatient department of the ColCol-lege. Se-lected individuals ranged in age of 17–25 years had class I molar relation, well aligned anterior teeth, presence of all permanent teeth except third molars, no gross facial asymmetry, with no previous orthodontic treatment, and no history of facial trauma, plastic surgery, or orthog-nathic surgery.
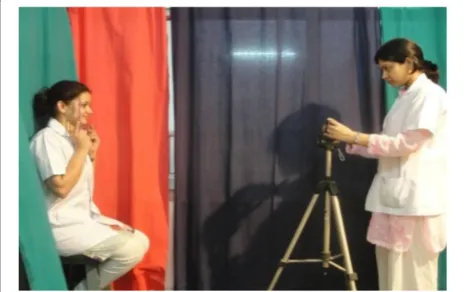
Selected subjects were first taken for videography using Sony digital camera (DSC-H20, Sony Corp. Japan). Signed consent of the subjects was taken on using video for research purpose. The method used for videography here was as described by Sarver and Ackerman [2, 5, 6]. The subjects were instructed to hold their head in nat-ural head position by looking straight into an imaginary mirror [7]. The camera lens was adjusted parallel to the apparent occlusal plane and focussed only on the dento-facial complex (corresponding to the area from the nose to the chin) (Fig. 1). Included in the captured area were two rulers with millimeter markings. These two rulers were made to fit perpendicular to each other in order to help minimize any error. If the subject was unable to hold the ruler perpendicular in one dimension to the angle in which the dynamic record was taken, the sec-ond ruler would still be perpendicular to the camera.
Recording was started about 1 s before the subject began to smile and continued till the end of the smile.
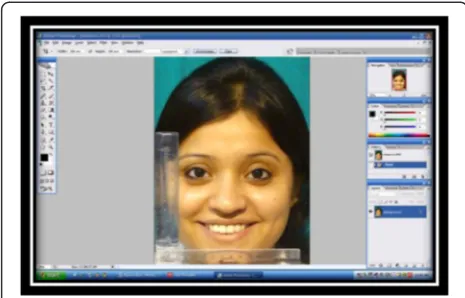
The video clip was downloaded to laptop (Dell, Inspiron) and uploaded to video-editing software program (DVD VideoSoft Studio) (Figs. 3 and 4) to obtain frames of smile. Each frame was analyzed and the frame showing the subjects’ widest commissure to commissure was chosen as posed smile. These frames were converted into a JPEG file using the same video-editing software program (DVD VideoSoft Studio) (Fig. 2). The approval was taken from Institute Ethics Committee whose students were involved in the study.
The lateral head cephalogram of the selected subjects were taken with radiograph machine Villa (Italy, Strato 2000) using a standardized technique.
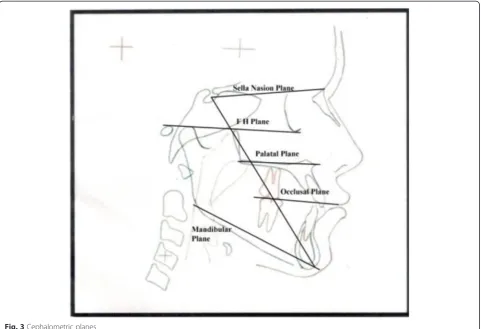
The cephalometric tracings were carried out, and the following cephalometric landmarks and planes were used in the study (Figs. 3 and 4). The parameters used to clas-sify subjects in different groups are shown in Table 1.
Based on these three parameters, the subjects were di-vided into six groups:
A. Group 1: Males with average growth pattern B. Group 2: Females with average growth pattern C. Group 3: Males with horizontal growth pattern D. Group 4: Females with horizontal growth pattern E. Group 5: Males with vertical growth pattern F. Group 6: Females with vertical growth pattern
Standardization of image
Each JPEG file of the selected subjects were opened in Adobe Photoshop CS2 (Adobe Systems, San Jose, California) and was adjusted by using the ruler option in the frame. The method used to standardize the image was as described by Desai et al [8]. First, the resolution was changed to 300 pixels per inch by going to“image > image size.”Then, the ruler function was chosen and set to milli-meter which can measure a minimum of 0.1 mm length. On the parallel end of the ruler, a 10-mm area, close to the smile, was measured. That number was divided into 10 (10/measurement on JPEG file) and multiplied by the width value found in image size screen (image > image
Fig. 1Video camera set on a tripod at 4 ft distance from the subject
size). The resulting number was copied and pasted in place of the width reading, and the changes were applied to the JPEG file (Fig. 5).
In Adobe Photoshop, the following parameters of the selected subjects were measured and entered into Micro-soft Excel to evaluate smile:
1. Maximum incisor exposure [9]: the amount of vertical display of the maxillary right central incisor (Fig.6).
2. Lower lip to maxillary incisor [9]: vertical distance from the deepest midline point on the superior margin of the lower lip to the maxillary right central incisor edge (Fig.7).
3. Interlabial gap [9]: the distance between the most inferior portion of the tubercle of the upper lip and the deepest midline point on the superior margin of the lower lip (Fig.8).
4. Maxillary intercanine width [9]: the distance from the distal aspect of the right canine to the distal aspect of the left canine (Fig.9).
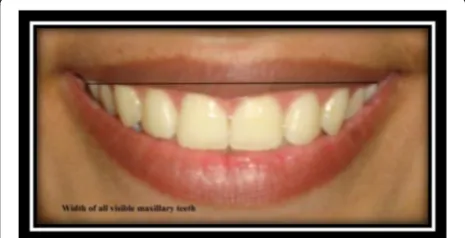
5. Width of all visible maxillary teeth [9]: the distance from the distal aspect of the most posterior visible tooth on the right to the most posterior visible tooth on the left side of the maxilla (Fig.10).
6. Smile width [9]: the distance from outer commissure to outer commissure on smile (Fig.11).
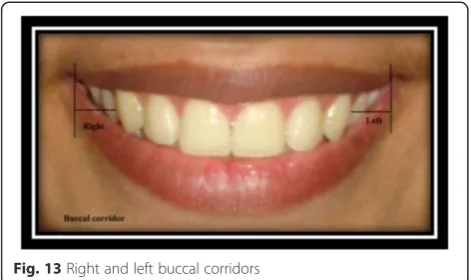
7. Smile index [9]: smile width/interlabial gap (Fig.12). 8. Right and left buccal corridors [9]: the horizontal
distance from the distal aspect of the canine to the respective outer commissure (Fig.13).
9. Right and left posterior corridors [9]: the horizontal distance from the distal aspect of the most posterior tooth visible on smile to the respective outer commissure (Fig.14).
10. Buccal corridor ratio [9]: intercanine width/smile width (Fig.15).
11. Posterior corridor ratio [9]: visible maxillary teeth width/smile width (Fig.16).
12. Upper vertical lip thickness [9]: the vertical distance from the most superior peak of the lip to the most inferior portion of the tubercle of the upper lip (Fig.17).
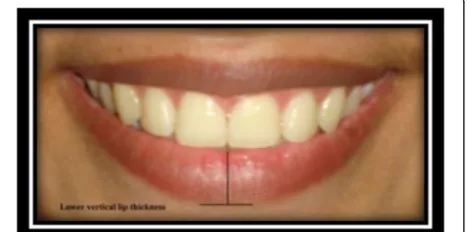
13. Lower vertical lip thickness [9]: the vertical distance from the deepest midline point on the superior margin of the lower lip to the most inferior portion of the lower lip (Fig.18).
and cephalometric measurements. The variability was found to be statistically insignificant.
Results
The smile parameters of male and female were com-pared in all three growth patterns as shown in Tables 2, 3, and 4.
As seen in Table 2, lower lip to maxillary incisor dis-tance, interlabial gap, total width of visible teeth, poster-ior corridor ratio, and lower vertical lip thickness were significantly higher in males as compared to females in average growth pattern group.
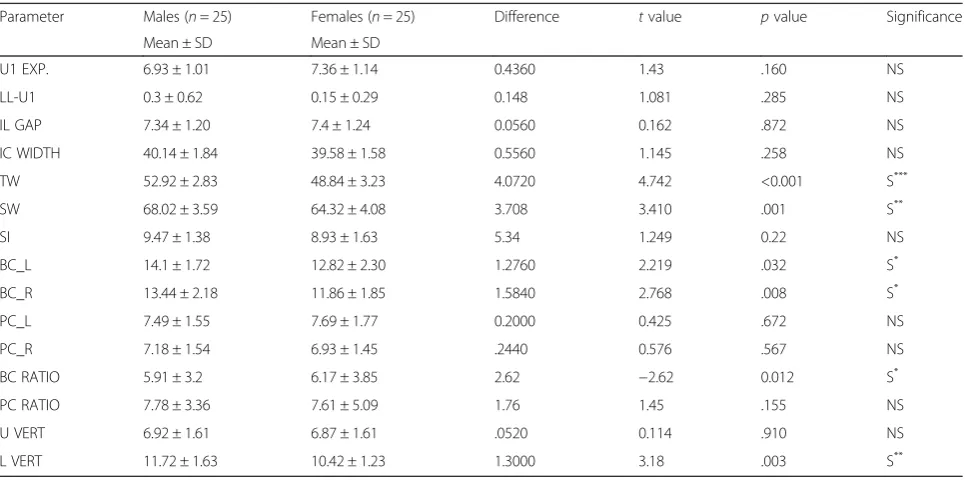
According to Table 3, total width of visible teeth, smile width, buccal corridors left and right and lower vertical lip thickness were significantly higher in males as com-pared to females in horizontal growth pattern group.
Table 4 shows upper incisor exposure, interlabial gap, inter canine width, total width of visible teeth, posterior corridors left and right, and lower vertical lip thickness were significantly higher in males as compared to fe-males in vertical growth pattern group.
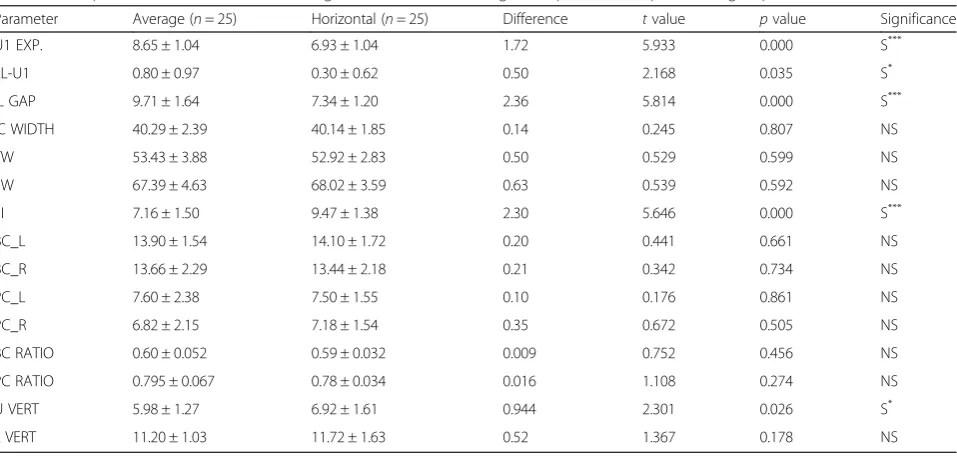
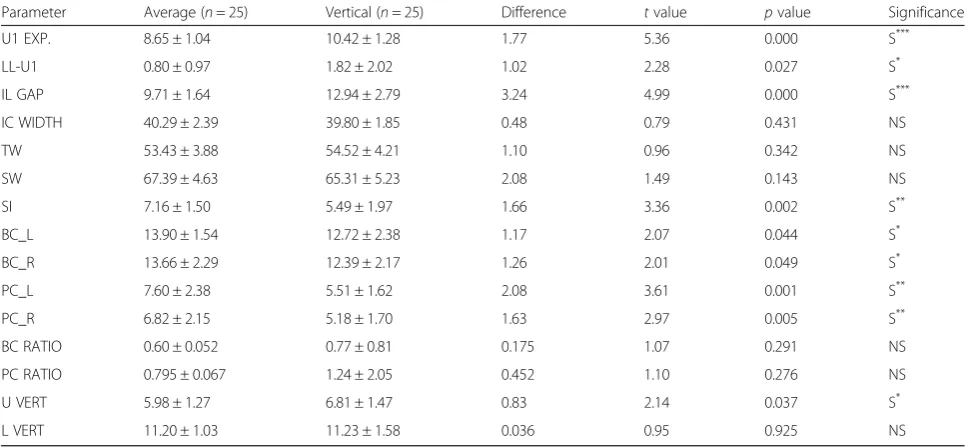
Comparison of males in average group with horizontal growth pattern group and vertical growth pattern group was done separately as shown in Tables 5 and 6, respect-ively. Also comparison of females in average growth pat-tern group with horizontal growth patpat-tern group and vertical growth pattern group was done separately as shown in Tables 7 and 8, respectively.
According to Table 5, upper incisor exposure and interlabial gap were significantly higher in males of aver-age growth pattern group as compared to males of hori-zontal growth pattern group. Upper vertical lip thickness Fig. 4Cephalometric parameters (angular and linear)
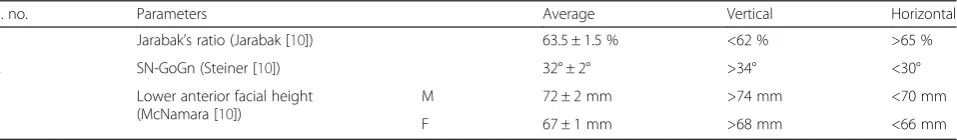
Table 1Parameters used for classification of growth pattern
S. no. Parameters Average Vertical Horizontal
1 Jarabak’s ratio (Jarabak [10]) 63.5 ± 1.5 % <62 % >65 %
2 SN-GoGn (Steiner [10]) 32° ± 2° >34° <30°
3 Lower anterior facial height (McNamara [10])
M 72 ± 2 mm >74 mm <70 mm
was significantly higher in males of horizontal growth pattern group.
As seen in Table 6, upper incisor exposure, upper inci-sor to lower lip distance, interlabial gap, and upper verti-cal lip thickness were significantly higher in males of vertical growth pattern group as compared to males of average growth pattern group. Buccal corridors left and right and posterior corridors left and right were higher in average growth pattern group.
Table 7 shows upper incisor exposure and interlabial gap were significantly higher in females of average growth pattern group as compared to females of hori-zontal growth pattern group. Upper vertical lip thickness was significantly higher in females of horizontal growth pattern group.
As shown in Table 8, upper incisor exposure, upper in-cisor to lower lip distance, and interlabial gap were sig-nificantly higher in females of vertical growth pattern group as compared to females of average growth pattern group. Posterior corridors left and right were higher in average growth pattern group.
These results clearly show that the vertical parameters of smile were highest in vertical growth pattern group and least in horizontal growth pattern group in both males and females.
Correlation between smile parameters and skeletal pa-rameters of males in average facial growth pattern group, females in average facial growth pattern group, males in horizontal group, females in horizontal growth pattern group, males in vertical growth pattern group, and fe-males in vertical growth pattern group is in Additional file 1.
Interlabial gap, when correlated with cephalometric parameters, was found to be positively correlated with overjet in average facial growth pattern group of males and was positively correlated with posterior facial height in average facial growth pattern group of females. The interlabial gap was positively correlated with lower an-terior facial height in males having horizontal facial growth pattern and no correlations with other cephalo-metric measurements in females having horizontal facial growth pattern. In the vertical facial growth pattern group, interlabial gap was positively correlated with Y-axis and lower vertical lip length in males but insignifi-cant correlations amongst females.
The incisal edge of the maxillary incisor to lower lip distance was found to be positively correlated with man-dibular plane angle in average facial growth pattern group of males and was positively correlated with overjet in average facial growth pattern group of females. It was also positively correlated with palatal plane angle of fe-males in horizontal facial growth pattern group.
Fig. 5Standardized photograph in Adobe Photoshop
Fig. 6Maximum incisor exposure
Fig. 7Lower lip to maxillary incisor
Based on these tables, it can be inferred that saddle angle and lower incisor to NB (angular and linear) was not found to be related to smile parameters and also upper incisor to NA (angular) was found to be positively correlated with upper lip vertical in females of all the three groups.
Discussion
To study a smile beyond static pictures, capturing a dynamic smile [2, 7, 10] was used, thus avoiding the in-herent error of a single snapshot. The variables of smile were significantly affected by the facial growth pattern in this study.
Upper incisor exposure
The upper incisor exposure was less in females when compared with males in all three groups and this differ-ence was significant in vertical facial growth pattern group. This is contrary to the findings of Vig and Brundo [11], Peck et al. [12, 13], and Balani et al [14], whereas the above finding is supported by a study done by Weeden et al. [15], where the results demonstrated that males ex-hibited greater amount of facial movements than females thus increasing the incisal display on smiling.
Incisal display
The incisal display significantly increased from horizon-tal to average to vertical facial growth pattern, with least
incisal display in horizontal facial growth pattern jects and maximum in vertical facial growth pattern sub-jects for both males and females. Contrary to this, Mc Namara et al. [16] found that the vertical display on smile of the maxillary right central incisor could not be correlated with the skeletal vertical dimension, as mea-sured from nasion to menton and from anterior nasal spine to menton.
On correlating upper incisor exposure with cephalo-metric parameters, it was found that the upper incisor display was negatively correlated with posterior facial height and Jaraback’s ratio of males in horizontal facial growth pattern group but not in females and it was posi-tively correlated with overjet, Y-axis, and palatal plane angle of males in vertical facial growth pattern group.
Incisal edge to lower lip distance
The incisal edge to lower lip distance was less in females when compared with males in all three groups and this difference was significant in average facial growth pat-tern group. This is supported by the findings of Vig and Brundo [11] and Peck et al. [12, 13] who found less mandibular tooth exposure in females than males at all ages.
The distance between incisal edge of the maxillary in-cisor and lower lip was least in horizontal growers and the maximum in vertical growers in both male and female.
Fig. 9Maxillary intercanine width
Fig. 10Width of all visible maxillary teeth
Fig. 11Smile width
No correlations of distance between incisal edge of the maxillary incisor and lower lip were found with cepha-lomteric measurements in the vertical facial growth pat-tern group.
Interlabial gap
The interlabial gap was significantly more in males when compared to that in females in average and vertical facial growth pattern group. This was contrary to Rigsbee et al. [17], Tjan et al. [1], and Jensen et al [18] and is sup-ported by a study done by Weeden et al. [15], where the results demonstrated that males exhibited greater amount of facial movements than females thus increas-ing the interlabial gap on smilincreas-ing.
Interlabial gap was significantly found to be maximum in vertical growers, followed by average and least in horizontal growers in both male and female.
Intercanine width
The intercanine width was more in males when com-pared to that in females in all groups but this difference was statistically significant only in the vertical facial growth pattern group.
Intercanine width was positively correlated with total width of visible maxillary teeth on smile of males in aver-age and vertical facial growth pattern groups but not of males in horizontal growth pattern group. In males and fe-males of vertical growth pattern group, the intercanine
width was positively correlated with smile width and total width of visible maxillary teeth on smile.
The intercanine width was found to be least in vertical growers when compared with horizontal and average growers in both male a females. Similar results were found in a study done by Grippaudo et al. [19], in skel-etal class II subjects. Changes in upper arch shape with intercanine diameter were proportionately smaller in pa-tients with high angles and larger in low-angle papa-tients.
Total width of all visible maxillary teeth
The total width of all visible maxillary teeth was signifi-cantly more in males when compared to that in females in all groups.
The total width of all visible maxillary teeth was nega-tively correlated with posterior corridor (left and right side) in all the groups indicating that in case of increased visible teeth during smile, the posterior corridor de-creased. Due to the same reason, the total width of all visible maxillary teeth was negatively correlated with posterior corridor ratio in all the groups.
Smile width
The smile width was more in males when compared to that in females in all groups, but this difference was statis-tically significant only in the horizontal facial growth pat-tern group. This was contrary to the results of Rigsbee et al. [17] and Chetan et al. [20] who found that females Fig. 13Right and left buccal corridors
Fig. 14Right and left posterior corridors
Fig. 15Buccal corridor ratio
exhibited more animation as compared to men resulting from a greater degree of upper lip elevation and increased width resulting in an increased display of teeth.
On comparing smile width separately in horizontal and vertical facial growth pattern group with average facial growth pattern group, statistically insignificant dif-ference was found in both males and females in both the facial growth pattern groups.
Buccal corridor
With regard to the buccal corridor of males when com-pared with females, the mean value was found to be more in case of males in all groups but was significantly more only in males in horizontal facial growth pattern group. A similar finding was reported by Maulik and Nanda [21]who found that females had less buccal corri-dor space than males.
As regards buccal corridor of the left side when com-pared with the right side, statistically significant differ-ence was found which demonstrates that the buccal corridor was greater on the left side than on the right side. This finding is supported by the study done by Okamoto et al. [22] where it was found that the dis-placements of the right and left corners of the mouth during voluntary smile were asymmetric and the left-sided laterality was found.
Buccal corridor of the left side when compared with the right side, in vertical facial growth pattern group
with average facial growth pattern group, was found to be significantly less in vertical facial growth pattern group in males but not in females. The above findings are supported by the results of Yang et al. [23] who found that FMA and LAFH were negatively correlated with buccal corridor.
The buccal corridors (left and right) were positively correlated to each other indicating that if the buccal cor-ridor was increased on the left side, it would increase on the right side as well, in all the groups irrespective of the age. A similar finding was observed by Krishnan et al. [6] showing a high correlation between the right and left buccal corridor spaces in both men and women. It was also positively correlated with posterior corridor (left and right) indicating that in case of increased buccal cor-ridor, the posterior corridor also increased. No correl-ation was found between the total anterior facial height and the buccal corridor space similar to the findings of Yang et al [23].
Posterior corridor
Posterior corridor of males, when compared with fe-males, was found to be less in case of males in horizon-tal and average facial growth pattern groups but was statistically significantly less in males in vertical facial growth pattern group. On comparing posterior corridor of the left and right sides, statistically significant differ-ence was found which indicate that the posterior corri-dor was greater on the left side than on the right side. This finding is supported by the study done by Okamoto et al. [22] where it was found that the displacements of the right and left corners of the mouth during voluntary smile were asymmetric, and the left-sided laterality was found.
Posterior corridor in vertical facial growth pattern group, when compared with average facial growth pat-tern group, was found to be significantly less in vertical facial growth pattern group in both males and females. On comparing buccal corridor of left and right sides in horizontal facial growth pattern group with average fa-cial growth pattern group, it was found to be insignifi-cantly different in both males and females.
The posterior corridors (left and right) were positively correlated to each other indicating that if the posterior corridor was increased on the left side, it would increase on the right side as well, in all the groups irrespective of the age.
Upper lip vertical
Upper lip vertical length in males and females demon-strated an insignificant difference in all the groups.
Upper lip vertical length of horizontal facial growth pat-tern group, when compared with average facial growth pattern group, indicated that upper lip vertical length was Fig. 17Upper vertical lip thickness
more in horizontal and vertical growth pattern group in both males and females and least in average growers.
Lower lip vertical
For lower lip vertical length in males when compared with females, statistically significant difference was found showing increased lower vertical lip length in males in all the three groups.
With regard to the lower lip vertical length in horizon-tal and vertical facial growth pattern group when com-pared with average facial growth pattern group, no significant difference was found between the two groups in both males and females. In a study done by Joshi et al. [24], the lip position in relation to various maloc-clusions was studied which showed a significant differ-ence in the sagittal lip positions in different skeletal
SI 7.16 ± 1.50 7.87 ± 8.87 7.056 −2.02 .049 S*
BC_L 13.89 ± 1.542 13.21 ± 1.97 .68 1.358 .181 NS
BC_R 13.66 ± 2.29 12.68 ± 2.01 .98 1.610 .114 NS
PC_L 7.60 ± 2.38 7.99 ± 2.24 −.392 0.60 .552 NS
PC_R 6.82 ± 2.15 7.42 ± 1.95 −.596 1.03 .310 NS
BC RATIO 6.00 ± 5.16 5.99 ± 4.11 6.49 0.049 .961 NS
PC RATIO 7.95 ± 6.71 7.57 ± 6.07 3.832 2.116 .040 S*
U VERT 5.98 ± 1.27 5.97 ± 1.49 0.012 0.031 .976 NS
L VERT 11.20 ± 1.03 10.33 ± 1.09 .864 2.884 .006 S**
NS p> 0.05: insignificant
*
p< 0.05, significant at 5 % significance level;**
p< 0.01, significant at 1 % significance level;***
p< 0.001, highly significant
Table 3Comparison of male and female in horizontal growth pattern (comparison of groups 3 and 4)
Parameter Males (n= 25) Females (n= 25) Difference tvalue pvalue Significance
Mean ± SD Mean ± SD
U1 EXP. 6.93 ± 1.01 7.36 ± 1.14 0.4360 1.43 .160 NS
LL-U1 0.3 ± 0.62 0.15 ± 0.29 0.148 1.081 .285 NS
IL GAP 7.34 ± 1.20 7.4 ± 1.24 0.0560 0.162 .872 NS
IC WIDTH 40.14 ± 1.84 39.58 ± 1.58 0.5560 1.145 .258 NS
TW 52.92 ± 2.83 48.84 ± 3.23 4.0720 4.742 <0.001 S***
SW 68.02 ± 3.59 64.32 ± 4.08 3.708 3.410 .001 S**
SI 9.47 ± 1.38 8.93 ± 1.63 5.34 1.249 0.22 NS
BC_L 14.1 ± 1.72 12.82 ± 2.30 1.2760 2.219 .032 S*
BC_R 13.44 ± 2.18 11.86 ± 1.85 1.5840 2.768 .008 S*
PC_L 7.49 ± 1.55 7.69 ± 1.77 0.2000 0.425 .672 NS
PC_R 7.18 ± 1.54 6.93 ± 1.45 .2440 0.576 .567 NS
BC RATIO 5.91 ± 3.2 6.17 ± 3.85 2.62 −2.62 0.012 S*
PC RATIO 7.78 ± 3.36 7.61 ± 5.09 1.76 1.45 .155 NS
U VERT 6.92 ± 1.61 6.87 ± 1.61 .0520 0.114 .910 NS
L VERT 11.72 ± 1.63 10.42 ± 1.23 1.3000 3.18 .003 S**
NS p> 0.05: insignificant
*
malocclusions. Thus, it can be inferred vertical as well as the sagittal skeletal features influence the overall soft tis-sue drape.
To homogenize the sample, only class I subjects were selected. Increasing the sample size randomly followed by categorizing them based on Angle’s classification and using regression model to compute additional vari-ables could further improve the study. The use of a
three-dimensional methodology [25] can be used for analyzing anthropometric characteristics of soft tissue of face.
Conclusions
From the analysis and obtained results, the following conclusions can be drawn:
Table 4Comparison of male and female in vertical growth pattern (comparison of groups 5 and 6)
Parameter Males Females Difference tvalue pvalue Significance
Mean ± SD Mean ± SD
U1 EXP. 10.42 ± 1.28 9.54 ± .93 0.88 2.78 .008 S**
LL-U1 1.82 ± 2.02 1.23 ± 1.25 0.59 1.25 .219 NS
IL GAP 12.95 ± 2.79 11.25 ± 2.03 1.70 2.46 .017 S*
IC WIDTH 39.81 ± 1.85 38.52 ± 2.32 1.29 2.17 .035 S*
TW 54.53 ± 4.22 50.55 ± 3.87 3.98 3.47 .001 S**
SW 65.31 ± 5.24 64.94 ± 5.58 3.72 .24 .809 NS
SI 5.49 ± 1.98 5.91 ± 9.19 4.16 0.96 0.344 NS
BC_L 12.72 ± 2.39 13.04 ± 2.28 0.320 −.49 .63 NS
BC_R 12.39 ± 2.17 12.39 ± 2.23 0.000 .00 1.00 NS
PC_L 5.51 ± 1.63 6.44 ± 1.22 0.924 −2.27 .028 S*
PC_R 5.19 ± 1.70 6.24 ± 1.42 1.05 −2.37 .022 S*
BC RATIO 7.75 ± 8.19 5.96 ± 3.9 1.798 1.09 .278 NS
PC RATIO 1.25 ± 2.05 7.80 ± 4.38 4.678 1.14 .260 NS
U VERT 6.81 ± 1.47 6.32 ± 1.34 0.488 1.23 .226 NS
L VERT 11.23 ± 1.59 9.89 ± 2.05 1.34 2.59 .013 S*
NS p> 0.05: insignificant
*
p< 0.05, significant at 5 % significance level;**
p< 0.01, significant at 1 % significance level
Table 5Comparison of males between average and horizontal facial growth pattern (comparison of groups 1 and 3)
Parameter Average (n= 25) Horizontal (n= 25) Difference tvalue pvalue Significance
U1 EXP. 8.65 ± 1.04 6.93 ± 1.04 1.72 5.933 0.000 S***
LL-U1 0.80 ± 0.97 0.30 ± 0.62 0.50 2.168 0.035 S*
IL GAP 9.71 ± 1.64 7.34 ± 1.20 2.36 5.814 0.000 S***
IC WIDTH 40.29 ± 2.39 40.14 ± 1.85 0.14 0.245 0.807 NS
TW 53.43 ± 3.88 52.92 ± 2.83 0.50 0.529 0.599 NS
SW 67.39 ± 4.63 68.02 ± 3.59 0.63 0.539 0.592 NS
SI 7.16 ± 1.50 9.47 ± 1.38 2.30 5.646 0.000 S***
BC_L 13.90 ± 1.54 14.10 ± 1.72 0.20 0.441 0.661 NS
BC_R 13.66 ± 2.29 13.44 ± 2.18 0.21 0.342 0.734 NS
PC_L 7.60 ± 2.38 7.50 ± 1.55 0.10 0.176 0.861 NS
PC_R 6.82 ± 2.15 7.18 ± 1.54 0.35 0.672 0.505 NS
BC RATIO 0.60 ± 0.052 0.59 ± 0.032 0.009 0.752 0.456 NS
PC RATIO 0.795 ± 0.067 0.78 ± 0.034 0.016 1.108 0.274 NS
U VERT 5.98 ± 1.27 6.92 ± 1.61 0.944 2.301 0.026 S*
L VERT 11.20 ± 1.03 11.72 ± 1.63 0.52 1.367 0.178 NS
NS p> 0.05: insignificant
*
1. Smile parameters in males and females were statistically significantly different, with higher mean values for upper incisor exposure, incisal edge to lower lip distance, interlabial gap, intercanine width, total width, smile width, and lower lip vertical length in males than in females.
2. For the horizontal facial growth pattern group when compared to average facial growth pattern group, statistically significant higher mean differences were
observed in average growth pattern in upper incisor exposure, incisal edge to lower lip distance,
interlabial gap, and upper vertical lip length, irrespective of the sex. The smile index was more and difference was statistically significant in horizontal facial growth pattern group, in both males and females.
3. Vertical facial growth pattern group exhibited statistically significant higher mean difference in
BC_L 13.90 ± 1.54 12.72 ± 2.38 1.17 2.07 0.044 S*
BC_R 13.66 ± 2.29 12.39 ± 2.17 1.26 2.01 0.049 S*
PC_L 7.60 ± 2.38 5.51 ± 1.62 2.08 3.61 0.001 S**
PC_R 6.82 ± 2.15 5.18 ± 1.70 1.63 2.97 0.005 S**
BC RATIO 0.60 ± 0.052 0.77 ± 0.81 0.175 1.07 0.291 NS
PC RATIO 0.795 ± 0.067 1.24 ± 2.05 0.452 1.10 0.276 NS
U VERT 5.98 ± 1.27 6.81 ± 1.47 0.83 2.14 0.037 S*
L VERT 11.20 ± 1.03 11.23 ± 1.58 0.036 0.95 0.925 NS
NS p> 0.05: insignificant
*
p< 0.05, significant at 5 % significance level;**
p< 0.01, significant at 1 % significance level;***
p< 0.001, highly significant
Table 7Comparison of females between average and horizontal facial growth patterns (comparison of groups 2 and 4)
Parameter Average (n= 25) Horizontal (n= 25) Difference tvalue pvalue Significance
U1 EXP. 8.45 ± 0.84 7.36 ± 1.14 1.09 3.84 0.000 S***
LL-U1 0.14 ± 0.22 0.15 ± 0.29 0.012 0.16 0.870 NS
IL GAP 8.43 ± 0.82 7.40 ± 1.24 1.04 3.47 0.001 S**
IC WIDTH 39.33 ± 1.94 39.58 ± 1.57 0.24 0.49 0.623 NS
TW 49.66 ± 3.22 48.84 ± 3.22 0.81 0.89 0.378 NS
SW 65.76 ± 3.41 64.32 ± 4.08 1.44 1.36 0.181 NS
SI 7.86 ± 0.88 8.93 ± 1.62 1.07 2.88 0.006 S**
BC_L 13.21 ± 1.97 12.82 ± 2.30 0.39 6.46 0.521 NS
BC_R 12.68 ± 2.01 11.86 ± 1.85 0.82 1.50 0.140 NS
PC_L 7.98 ± 2.24 7.69 ± 1.76 0.29 0.51 0.611 NS
PC_R 7.41 1.96 6.93 ± 1.45 0.48 0.99 0.325 NS
BC RATIO 0.59 ± 0.04 0.61 ± 0.038 0.017 1.57 0.122 NS
PC RATIO 0.76 ± 0.06 0.76 ± 0.050 0.004 0.257 0.798 NS
U VERT 5.96 ± 1.50 6.87 ± 1.62 0.90 2.05 0.046 S*
L VERT 10.33 ± 1.08 10.42 ± 1.22 0.092 0.28 0.780 NS
NS p> 0.05: insignificant
*
upper incisor exposure, incisal edge to lower lip distance, interlabial gap, upper vertical lip length, and occlusal plane angle, than average facial growth pattern group in both males and females; whereas, the smile index and posterior corridor (left and right) were statistically significantly less in vertical facial growth pattern group in both males and females.
4. Intercanine width exhibited positive correlation with total width of all visible teeth during smile in average facial growth pattern group of males and in vertical facial growth pattern group of both males and females.
5. Smile width was positively correlated with posterior corridor (left and right) and buccal corridor (left and right) in all the groups in both males and females. 6. Buccal corridor of the left side was positively
correlated with buccal corridor of the right side and posterior corridor of both sides in all the groups in both males and females.
7. Posterior corridor of the left side was positively correlated with posterior corridor of the right side in all the groups in both males and females.
8. Posterior corridor ratio was positively correlated with buccal corridor ratio in all the groups in both males and females.
9. Saddle angle and lower incisor to NB (angular and linear) were not found to be related to smile. 10. Upper incisor to NA (angular) was found to be
positively correlated with upper lip vertical in females of all the three groups.
Additional file
Additional file 1:Correlation between smile parameters and skeletal parameters of males and females in different groups. Correlation between smile parameters and skeletal parameters of males in average facial growth pattern group, females in average facial growth pattern group, males in horizontal group, females in horizontal growth pattern group, males in vertical growth pattern group, and females in vertical growth pattern group.
Competing interests
The authors declare that they have no competing interests.
Authors’contributions
NG carried out the entire study and concluded the results. DNK guided the entire approach of the study. SV & PB participated in the sequence alignment and review of the study. All authors read and approved the final manuscript.
Author details
1Nora Medical Polyclinics, Tower 4. Marks and Spencer Building, No. 106, Abu Dhabi, United Arab Emirates.2Department of Orthodontics, Kothiwal Dental College & Former Dean of Dental Faculty, KGMU, Lucknow, UP, India. 3Department of Orthodontics, Kothiwal Dental College & Research Centre, Moradabad, UP, India.4Department of Orthodontics & Dentofacial Orthopedics, KD Dental College & Hospital, Mathura, UP, India.
Received: 19 April 2015 Accepted: 14 August 2015
References
1. Tjan AHL, Miller GD. Some esthetic factors in a smile. J Prosthet Dent. 1984;51:24–8.
2. Sarver DM, Ackerman MB. Dynamic smile visualization and quantification: part 1. Evolution of the concept and dynamic records for smile capture. Am J Orthod Dentofacial Orthop. 2003;124:4–12.
3. Sarver DM. The importance of incisor positioning in the esthetic smile: the smile arc. Am J Orthod Dentofal Orthop. 2001;120:98–111.
Table 8Comparison of females having average and vertical facial growth pattern (comparison of groups 2 and 6)
Parameter Average (n= 25) Vertical (n= 25) Difference tvalue pvalue Significance
U1 EXP. 8.45 ± 0.84 9.53 ± 0.93 1.08 4.28 0.000 S***
LL-U1 0.14 ± 0.22 1.23 ± 1.24 1.09 4.31 0.000 S***
IL GAP 8.43 ± 0.82 11.24 ± 2.02 2.81 6.42 0.000 S***
IC WIDTH 39.33 ± 1.94 38.52 ± 2.32 0.82 1.35 0.185 NS
TW 49.66 ± 3.22 50.55 ± 3.87 0.89 0.88 0.381 NS
SW 65.76 ± 3.41 64.94 ± 5.58 0.82 0.63 0.534 NS
SI 7.86 ± 0.88 5.90 ± 0.92 1.96 7.66 0.000 S***
BC_L 13.21 ± 1.97 13.04 ± 2.27 0.177 0.29 0.772 NS
BC_R 12.68 ± 2.01 12.39 ± 2.22 0.288 0.48 0.634 NS
PC_L 7.98 ± 2.24 6.43 ± 1.21 1.55 3.04 0.004 S**
PC_R 7.41 1.96 6.23 ± 1.41 1.18 2.45 0.018 S*
BC RATIO 0.59 ± 0.04 0.59 ± 0.03 0.004 0.36 0.723 NS
PC RATIO 0.76 ± 0.06 0.78 ± 0.04 0.023 1.55 0.127 NS
U VERT 5.96 ± 1.50 6.32 ± 1.33 0.356 0.89 0.380 NS
L VERT 10.33 ± 1.08 9.88 ± 2.04 0.444 0.96 0.343 NS
NS p> 0.05: insignificant
*
p< 0.05, significant at 5 % significance level;**
p< 0.01, significant at 1 % significance level;***
using visual analog scale, smile arc, buccal corridor measures, and modified smile index. Am J Orthod Dentofac Orthop. 2008;133:515–23.
10. Alexander Jacobson: Radiographic Cephalometry; From Basics to Video-imaging. 1st ed.Quintessence Publishing Co, Inc.1995: 60–62.
11. Vig RG, Brundo GC. The kinetics of anterior tooth display. J Prosthet Dent. 1978;39:502–4.
12. Peck S, Peck L, Kataja M. The gingival line. Angle Orthod. 1992;62(2):91–100. 13. Peck S, Peck L, Kataja M. Vertical lineaments of lip position. Am J Orthod
Dentofac Orthop. 1992;101:519–24.
14. Balani R, Jain U, Kallury A, Singh G. Evaluation of smile esthetics in central India. APOS Trends Orthod. 2014;4:162–8.
15. Weeden JC, Trotman CA, Faraway JJ. Three dimensional analysis of facial movement in normal adults: influence of sex and facial shape. Angle Orthod. 2001;71:132–40.
16. McNamara L, McNamara Jr JA, Ackerman MB, Baccetti T. Hard- and soft-tissue contributions to the esthetics of the posed smile in growing patients seeking orthodontic treatment. Am J Orthod Dentofac Orthop.
2008;133:491–9.
17. Rigsbee OH, Sperry TP, BeGole EA. The influence of facial animation on smile characteristics. Int J Adult Orthod Orthognath Surg. 1988;3:233–9. 18. Jensen J, Joss A, Lang NP. The smile line of different Ethnic groups in
relation to age and gender. Acta Med Dent Helv. 1999;2(l4):38–46. 19. Grippaudo C, Oliva B, Greco AL, Sferra S, Deli R. Relationship between
vertical facial patterns and dental arch form in class II malocclusion. Prog Orthod. 2013;14:43.
20. Chetan P, Tandon P, Singh GK, Nagar A, Prasad V, Chugh VK. Dynamics of a smile in different age groups. Angle Orthod. 2013;83(1):90–6.
21. Maulik C, Nanda R. Dynamic smile analysis in young adults. Am J Orthod Dentofac Orthop. 2007;132:307–15.
22. Okamoto H, Haraguchi S, Takada K. Laterality of asymmetry in movements of the corners of the mouth during voluntary smile. Angle Orthod. 2010;80(2):223–9.
23. Yang H, Nahm DS, Baek SH. Which hard and soft tissue factors relate with the amount of buccal corridor space during smiling? The Angle Orthod. 2007;78(1):5–11.
24. Joshi M, Wu LP, Maharjan S, Raj M. Sagittal lip positions in different skeletal malocclusions: a cephalometric analysis. Prog Orthod. 2015;16:8. 25. Deli R, Galantucci L, Liano A, Gioia E. Three-dimensional methodology for
photogrammetric acquisition of the soft tissues of the face: a new clinical-instrumental protocol. Prog Orthod. 2013;14:32.
Submit your manuscript to a
journal and benefi t from:
7Convenient online submission
7Rigorous peer review
7Immediate publication on acceptance
7Open access: articles freely available online
7High visibility within the fi eld
7Retaining the copyright to your article