R E S E A R C H P A P E R
Open Access
Optical tomography based on
shortest-path model for diffuse surface object
Takafumi Iwaguchi
1*, Takuya Funatomi
1,2, Takahito Aoto
1, Hiroyuki Kubo
1and Yasuhiro Mukaigawa
1Abstract
We tackle an optical measurement of the internal structure of a diffuse surface object—we define as an object that has a diffuse surface and its interior is transparent, like grapes or hollow plastic bottles. Our approach is based on optical tomography that reconstructs the interior from observations of absorption of light rays from various views, under the projection of the light. The difficulty lies in the fact that a light ray that enters changes its direction at the interaction of the surface, unlike X-ray that travels straight through the object. We introduce a model of light path in the object calledshortest-path model. We acquire the absorption of light rays through the object by the measurement upon the assumption of the model. Since this measurement acquires insufficient observation to reconstruct the interior by conventional reconstruction algorithms, we also introduce a reconstruction method based on a numerical optimization that a physical requirement of the absorption is taken into account. Our method is confirmed successful to measure the interior in a real-world experiment.
Keywords: Optical measurement, Computed tomography, Radon transform, Optimized reconstruction
1 Introduction
The measurement of an object’s interior is important in various applications, such as the detection of foreign objects in food and the inspection of the human body in a medical examination. An optical measurement is a safe inspection technology that does not use X-rays and has no risk posed by a radiation dose. Furthermore, optical measurement provides functional information on opti-cal properties, e.g., blood flow is estimated from spectral absorption.
The difficulty in making an optical measurement results from a light ray readily changing path at a point of interac-tion with an object. We aim to measure the internal struc-ture of an object that has a diffuse surface and an interior that is assumed transparent, where light is absorbed but not scattered. Fruits like grapes, light bulbs with white glass, and hollow plastic bottles are examples of such objects. For such an object, light diffuses at the surface and rays advance in various directions.
Optical tomography is a technique of optical measure-ment used to reconstruct the interior of an object. Optical
*Correspondence:[email protected] 1Nara Institute of Science and Technology, Ikoma, Japan
Full list of author information is available at the end of the article
projection tomography (OPT) [1] is a simple technique that is the same as X-ray computed tomography (CT) except that it uses visible or infrared light instead of X-rays. It is assumed that light travels in a straight direction in the object, as for X-rays. OPT provides a clear three-dimensional reconstruction of a small specimen and has contributed to many biological studies; however, it cannot deal with a diffuse surface.
One difficulty is the scattering of light in the internal medium. Techniques have been proposed to cope with scattering, e.g., techniques for single scattering [2] and multiple scattering [3–5]. Scattering in the human body is approximated as an isotropic diffusion in diffuse optical tomography; applications of the approximation are mam-mography [6] and functional imaging of the brain [7,8]. A major disadvantage of the techniques is that the radia-tion and probing require contact with the target. As the number of contacts is limited physically, the resolution is limited.
We propose an optical tomography method based on
the shortest-path modelthat assumes that a ray scatters
only at the surface and travels straight in the interior medium. Light rays in the object are measured without contact by an optical system that consists of a camera, light source, and rotary stage. After paths of light rays
reconstruction of the internal structure of a diffuse sur-face object by an inverse Radon transform. Second, we clarify the problem that measurement with a general per-spective camera results in insufficient observations for reconstruction. Third, we introduce the limitation of the physically correct value range on the distribution and the smoothness constraint with total variation (TV) semi-norm regularization to reconstruct the full interior from the insufficient observations. Fourth, we clarify the rela-tionship between the placement of the light source in the measurement configuration and evaluate the effect of scattering.
This paper extends our previous work [9] as follows. (1) The measurement is made more practical using a more widely used perspective model rather than the less used orthogonal projection model. (2) We introduce a contour estimation into the framework that breaks the limitation of the shape of the target, previously limited to a cylinder. (3) A reconstruction method, which is peculiar to the shortest-path model, is introduced to deal with the insuf-ficient observations. (4) We discuss the appropriate setup of the measurement and the robustness against scattering. The remainder of the paper is organized as follows. Section 2 describes the process of acquiring light rays while Section 3 describes the reconstruction method. Section 4 presents the results of a real-world experi-ment and evaluations made using our method, while we conclude the paper in Section5.
2 Acquisition of light rays
2.1 Distribution of the absorbance coefficient and total absorption
We reconstruct a distribution of the absorption coeffi-cientσ of the target’s interior. The absorption coefficient represents how much light is absorbed as light travels a unit distance. We now define the total absorption A by following the Lambert-Beer law, as the logarithm of Io
(the intensity of light after light travels through the tar-get) divided byIi(the intensity of light before entering the
target):
A=logIo−logIi. (1)
2.1.1 Radon transform
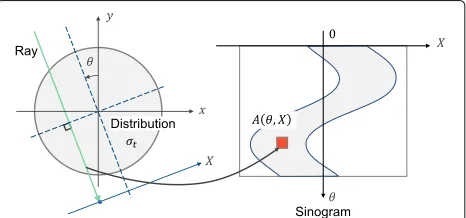
The relationship between the total absorption and absorp-tion coefficient is described by theRadon transform. For a simplicity, we consider the problem in two dimen-sions. When a ray propagates through an area , the
x,y∈
The path of a ray is generally assumed straight in the Radon transform. Let us describe a straight ray in polar coordinates fixed on the object as illustrated in Fig.1. A radon transform about a ray(X,θ)is written as
A(θ,X)=
∞
−∞σ(zsinθ+Xcosθ,−zcosθ+Xsinθ)dz.
(3)
We reconstruct a distribution of the absorption coeffi-cient using the inverse Radon transform that is derived from Eq. (3). The reconstruction of the interior requires the total absorption of rays passing through the interior (i.e., A(θ,X)) for all possibleθ andX. Ideally, these rays are acquired by measuring the transmitted rays when par-allel rays are cast toward the target from various angles. This method works well when the paths of rays are not disturbed by the target as in the case of X-rays. However, as illustrated in Fig.2, each ray entering the object spreads when the target has a diffuse surface. The transmitted rays are no longer parallel, and it is difficult to determine paths of the measured rays.
2.2 Shortest-path model
We model light paths in a diffuse surface object as a first step to determining the paths of rays. When a single ray of light enters an object with a diffuse surface, the ray branches into many paths having various directions. The basis of the shortest-path model is the assumption that a ray diffuses at a point on the surface but travels in a straight direction inside the object. Paths in the object are therefore regarded as a set of straight rays spreading from the incident point as illustrated in Fig.3.
Fig. 2Transmission of rays when parallel rays are cast
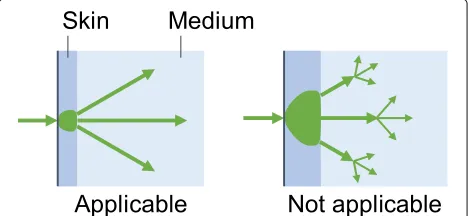
2.3 Model validity in the real situation
In the real situation, the paths in the object do not always follow the shortest path. The path in the real situation is illustrated in Fig.4.
One of the difficult targets could be the object with thick skin. Because the incident point of the path is determined as the first point where the light from the source hit the surface, an actual incident point of the path should lie on the inner boundary between the skin and the body;
Fig. 3Shortest-path model assuming a ray scatters only at the surface but travels straight in the medium
Fig. 4Applicable and non-applicable material of our model
therefore, these two points do not match when the skin is thick and the light is spread by the diffusion in the skin. Our model is applicable when the skin is thin enough.
Another factor that could affect the reconstruction is the scattering in the medium. When scattering occurs, the path in the medium is no longer straight. The effect of the scattering is evaluated in Section4.4.
2.4 Measurement and light path alignment
This section describes the measurement based on our model, called the shortest-path measurement. After rays passing through the object are measured, their paths are determined in a process calledlight path alignment.
2.4.1 Setup of the measurement
Because the light path is modeled as a straight line, a path in the object is uniquely determined if both ends of the path are specified. If there is light in a large area, which means many rays are cast as illustrated in Fig.2, the exact point that a ray enters is difficult to determine. Incident light should fall in a small area to avoid this problem. Meanwhile, rays exiting the object are measured by shoot-ing the surface of the target. The shootshoot-ing is repeated while the object is rotated to collect rays entering at and exiting from various points.
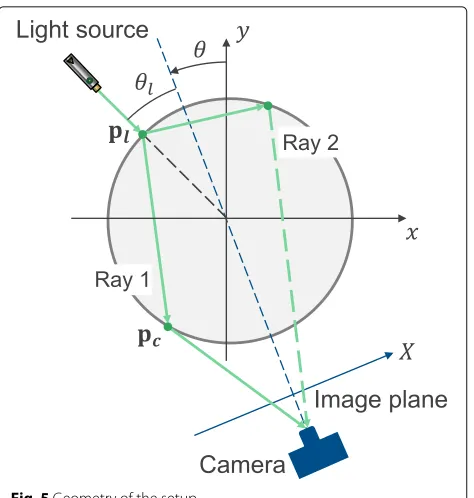
Accordingly, a setup will consist of a narrow light source, camera, and rotary stage on which the target is placed, as shown in Fig.5.
We employ an off-the-shelf perspective camera that provides a wide field of view (FOV). We must consider the FOV because it affects the measurement of a ray. In the case of a perspective projection, a ray from the light source is determined from the relationship between the focal point and the image plane of the camera.
2.4.2 Light path alignment
Fig. 5Geometry of the setup
of the target. Similarly, the point at which a ray exits is determined by calculating the intersection of the ray from the camera and a contour of the target. To uniquely deter-mine these intersections of the ray and the contour of the target, all the contours of the target must not be occluded from the light source or the camera. Therefore, the shape of the object need to be convex in our measurement.
To obtain a target contour, we compute a visual hull [10] as the shape of the target in the following steps. The target is first captured from various views under ambient light-ing. A silhouette is then extracted by binarization after subtracting the background from the captured image. A visual hull is finally computed by taking an intersection of the perspective projection of the silhouette on the object space. Since our measurement needs the shape of the tar-get to be convex, it is reasonable to utilize a visual hull that is only applicable for convex shapes.
We employ a sinogram for the representation of acquired rays (Fig.6). Once again, we consider polar coor-dinates (X,θ) fixed on the target. The origin is at the center of rotation in the measurement setup. In a sino-gram, horizontal and vertical axes respectively correspond to(X,θ), and an attenuation of the ray is stored, as illus-trated in Fig. 1. For each ray, we define an intersection of the ray and a contour of the object in Cartesian coor-dinates (x,y) that share the same origin as the polar coordinates. By denoting the intersection of a ray from the camera and a target bypland the intersection of a ray from
the camera and a contour bypc, the angle of a pathθ is
calculated as
Fig. 6The coverage is represented by the filled area in the sinogram. The area of both at the center and at the sides cannot be filled with respect to the setup of measurement and the projection model of the camera
θ =arg(pl−pc), (4)
where arg(·)denotes the angle between a vector and the
x-axis. A displacement of pathXis calculated according to
X=pl·
sinθ cosθ
. (5)
This sinogram is identical to that used in conventional CT, and the same reconstruction technique can therefore be employed.
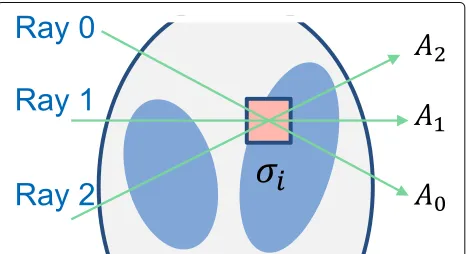
2.5 Observation rate of the light path
When the surface of the object is measured using a single camera, not all rays in the object are measured depending on the object’s shape and the optical setup. We now look at Fig.5to understand the unobserved rays. Rays 1 and 2 cast from the light source enter the object at the same point but exit from different points, before being measured by the camera on the opposite side of the object. While ray 1 is observable because it reaches the surface visible from the camera, ray 2 is unobservable because it reaches the surface unobservable from the camera.
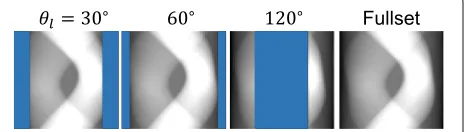
Let us assess the effect of unobserved rays. We simulate the measurement for the case that the target is a cylinder and generate sinograms for differentθlin Fig.5. Figure7
shows generated sinograms and the “fullset” sinogram that contains sufficient rays with which to reconstruct the full interior. There are missing areas in the sinograms owing to the unobserved rays. In the case of θl = 30◦,
Fig. 7Missing area of a sinogram representing the insufficient observations of rays
We next evaluate the observation rate of rays. Here, we measure the observation rate using coverage—a ratio of the observed number of rays to the number of rays in the fullset sinogram. To describe the missing part, we use the distancessminandsmax as shown in Fig.6. LetθFOV
denotes FOV. These distances change as follows: for the case of 0≤θl≤ π−θ2FOV,
smin=0 (6)
smax=cos
π
4 − θl
2 + θFOV
4
, (7)
for the case ofπ−θFOV
2 θl≤ π+θ2FOV,
smin=cos
3π
4 −
θl
2 − θFOV
4
(8)
smax=cos
π
4 − θl
2 + θFOV
4
, (9)
and for the case ofπ+θFOV
2 ≤θl≤π,
smin=cos
3π
4 −
θl
2 − θFOV
4
(10)
smax=1. (11)
From the definition ofsmaxandsminin Fig.6, the coverage
is calculated assmax−smin. In addition, the coverage takes
its maximum at
θl= π−θFOV
2 . (12)
Figure8 shows the relationship between the coverage and θl for the perspective projection when the FOV is
30◦and 60◦. It is found that the coverage of FOV= 60◦ is lower than that of FOV= 30◦for anyθl. In addition,
we show coverage in the cases of the orthogonal projec-tion that were considered in a previous paper [9]. In the case of orthogonal projection, the coverage is satisfied at θl = 90◦; hence, a lack of observations can be avoided
using this angle. In contrast, the coverage is never satis-fied in the case of perspective projection. The problem of insufficient observations is inevitable unless a single perspective camera is used.
3 Reconstruction
When there are insufficient observations, a possible solu-tion is to modify the setup by adding another light source
Fig. 8Coverage of the measurement
or camera to complete the observation. When it is pos-sible to observe all the paths, the interior should be reconstructed most accurately. One of the difficulties of this approach is that an additional light source or cam-era must be precisely aligned because the reconstruction is sensitive to misalignment. Another difficulty is that the number and the placement of the light source and the camera depend on the shape of the object. Although the optimal configuration is difficult to find, it is not usable for other objects. Moreover, there is no guaran-tee of the existence of the configuration that makes the observation complete.
In this paper, we employ numerical optimization to deal with the problem of incomplete observations. The numer-ical optimization can be used with the multiple light sources and camera.
3.1 Formulation as an optimization problem
a reprojection of an estimated distribution by the Radon transform should be close to a sinogram Aobserved. The
second term is the PC on the distribution, and the third term represents TV semi-norm regularization. Because the objective function of Eq. (13) is convex, we employ the alternating direction method of multipliers to solve the problem.
3.1.1 Reprojection error of the Radon transform
To derive the reprojection error, we rewrite the Radon transform (Eq. (3)) in matrix form. Letidenote an index of a cell of a discrete distribution after serialization. A Radon transform of a ray having indexjis written as
Aj=
i
rijσi, (14)
where
rij=
1 (if rayjhitsσi)
0 (otherwise). (15)
By combining Eq. (14) for all rays as a linear system,
A=Rσ (16)
is derived. In the optimization problem, reprojection error is computed by taking the difference betweenAand the projection of estimated σ obtained using matrix R. We consider reprojection error only for available observa-tions and measure it using theL−2 norm. LetRobserved
denote the Radon transform for available observations andAobserveddenote a sinogram of available observations.
Finally, the data-fidelity term is derived as
E(σ)= Aobserved−Robservedσ22. (17)
3.1.2 Physical conditions of light absorption
The constraint is determined by the existing observations considering a physical condition of the coefficient of light absorbance. Because light does not increase in intensity as it travels through an object, the absorbance coeffi-cient cannot be less than zero. The lower bound of the absorption coefficientσiis written as
σi≥0. (18)
The upper bound of the absorbance coefficient can be determined by considering the relationship between the total absorption and the distribution of the absorbance coefficient.
As Eq. (14) implies, the total absorption of a ray is the integral of the absorbance coefficient along the path. The absorbance coefficient of each cell is therefore no more
higher than the minimum of all the projections that travel through the pixel. In the general case, the upper bound is written as
σj≤min i∈χj(
Ai), (19)
whereχiis a set of rays that hitσj.
The lower and upper bounds form the box constraint of the solution. Let a setCdenote the range of absorption:
C=[0,σmax] , (20)
where
σmax=
min
i∈χ1( Ai), min
i∈χ2(
Ai),· · ·min i∈χN(
Ai)
. (21)
The constraint is then represented by the indicator functionιC(σ):
ιC(σ)=
0 (ifσ ∈C)
∞ (otherwise). (22)
3.1.3 TV minimization
We define the TV semi-norm · TVas
σTV :=
i,j
|(∇1σ)|2+ |(∇2σ)|2, (23)
where∇1and∇2are the discrete horizontal and vertical
differential operators. The minimization of the semi-norm forces the distribution to vary gradually while pre-serving the edges. This is preferable in most cases, and we can adjust the effect of the term by choosing a smallλ whenever it is not suitable.
4 Experiment
4.1 Appropriate setup of the measurement
We determine the appropriate setup before performing an experiment in a real environment.
We first investigate the characteristics of our recon-struction method based on the optimization by com-paring with the filtered back projection (FBP) that was employed in [9]. We compare the reconstructed interi-ors obtained under different setups of the measurement to evaluate the effect of the setup on the accuracy of the reconstruction. Synthetic sinograms are generated by solving the forward Radon transformation (Eq. (16)) for different θl in Fig. 5. We also evaluate the interiors
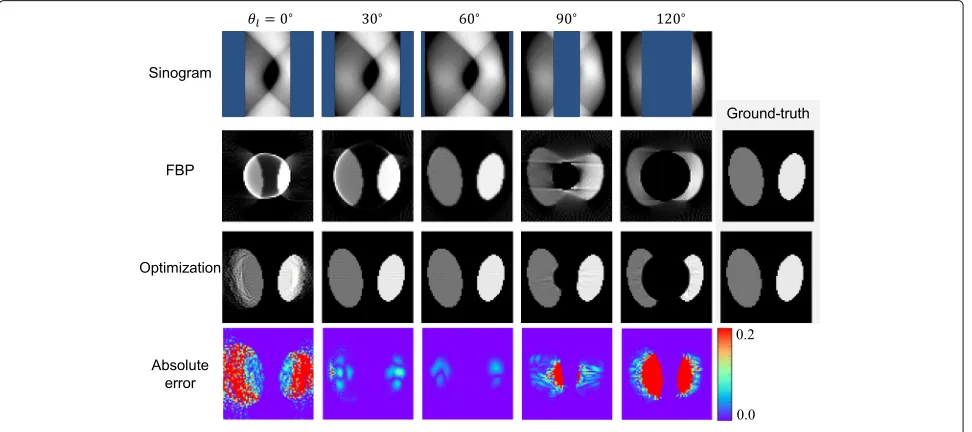
reconstructed by the FBP and our reconstruction method. Figure10shows the reconstructed interiors forθl = 0◦,
30◦, 60◦, 90◦, and 120◦. In the cases ofθl = 0◦, 30◦, and
60◦, there are missing areas on both sides of the sino-gram. The outer parts are not correctly estimated owing to the large missing areas atθl =0◦, but the central part is estimated correctly. There are similar tendencies in the results forθl = 30◦ and 60◦, but the errors are smaller
because of the better observation.
In contrast, the center of the sinogram is missing in the cases ofθl = 90◦and 120◦. It is found that our
recon-struction method failed to reconstruct the center of the interior as for reconstruction by the FBP. This is because of the absence of observations of the center; no rays pass-ing through the central area are observed, whereas more than one ray is observed in the previous cases. The whole interior needs to be reconstructed such that the center of the sinogram is not missing. In terms of quality, our method provides a better reconstruction than the FBP. Whereas the result of the FBP has line artifacts and blur-ring, a clear shape is reconstructed without artifacts using our method.
For quantitative evaluation, the root mean squared error (RSME) and the maximum of the absolute error
are shown in Table 1. Note that the original distribu-tion is varied in the range between 0 to 0.2. The RSME reflects the correctness of the reconstruction, which is discussed above. They are small at θl = 30◦ and 60◦
and increase as the number of failure pixels increases. The maximum of the absolute error reflects how the worst pixel is reconstructed. Referring to an absolute error in Fig. 10, the worst pixels are reconstructed from the missing area of the sinogram. It is confirmed that the abso-lute error is bounded by the physical constraint of the reconstruction.
We now look for an appropriate setup such that the cov-erage of the observation is high, while the center of the sinogram remains filled. Let us review the coverage of the observation in Fig.8. The coverage takes its maximum at θl = π−θ2FOV; see Section2.5for details. It is noteworthy
that the center of the sinogram is missing in the case that θl > π−θ2FOV. For these reasons, the appropriate setup is
θl = π−θ2FOV; however, care needs to be taken thatθldoes
not exceed the angle.
4.2 Experiment on a real object
In this section, we perform an experiment in a real envi-ronment to confirm the validity of the shortest-path mea-surement by comparing the result with a meamea-surement made under a parallel lighting setting.
The target of the experiment is a bin filled with gelatin and blue transparent plastic struck at some distance from the center of the bin.
The setup is shown in Fig.11for the shortest-path mea-surement; the target on the rotary stage is illuminated by the light source and captured by the camera from various angles. The light is collimated with a lens and is narrowed
90 2.31×10⁻³ 2.00×10⁻¹
120 7.55×10⁻³ 2.00×10⁻¹
by an aperture.θl, the angle between the light and camera
direction, is fixed to 45◦. We chose the angle such that the center of the sinogram is filled while the observed intensity is high enough for a quick measurement.
To calculate the total absorption, a reference object without a plastic stick is measured in addition to the tar-get; the total absorption is then calculated by Eq. (1). Note that this calculation also cancels out the angular nonuni-formity of diffusion. Generally, the intensity distribution through the surface is described by the bidirectional trans-mission distribution function fT(ωi,ωo), whereωi is the
incidence angle andωo is the outgoing angle of the light.
Becausestandsrhaveωiandωoin common, the
bidirec-tional transmission distribution functionfT of the surface
of the target is cancelled out.
The next step is alignment of the light path. After a con-tour of the target is estimated considering the visual hull of silhouettes from various views, the light path is aligned with the contour estimated and a sinogram is generated. The interior is reconstructed from the sinogram.
Similarly, we measure the same target under a parallel light setting. The same setup is used except that a parallel light source is cast directly andθl is set to 0◦. The
sino-gram is generated directly from captured images under the assumption that rays travel straight in the target and measured transmitted rays remain parallel to each other.
Figure12shows sinograms of the parallel light setting and the shortest-path measurement. We cannot see an effect of plastic in the sinogram of the parallel light set-ting. This is because the parallel rays once diffuse at the surface when entering the target and light paths are mixed as illustrated in Fig.2; therefore, rays passing through the
Fig. 11Setup of the experiment
Fig. 12Sinograms. Pixels in sinograms of shortest-path measurement are described in the figure at the bottom right
plastic are no longer distinguished. In contrast, we see a clear trajectory through the plastic in the sinogram of the shortest-path measurement. There is also blurring along the trajectory and non-zero values outside the trajectory. This should be a result of corruption of the path due to scattering in the media and reflection and refraction at the plastic’s surface. We can also see small missing areas on both sides in the sinogram owing to the limitation of the measurement.
The result of reconstruction is shown in Fig.13. From the top view of the target, the distribution of the absorp-tion is expected as shown at the top right. The red and blue lines in the figure respectively indicate the con-tour and the boundary between observed and unobserved areas of the sinogram. We now look at the reconstruc-tion of the parallel light setting that is reconstructed by the FBP. The distribution is almost uniform, and we can hardly tell the area of the plastic stick. For the shortest-path measurement, we show two results of reconstruction obtained without optimization (i.e., the FBP) and with our optimization method. In contrast to the case for the parallel light setting, the proposed method success-fully reconstructs the area of plastic stick regardless of
the reconstruction method. This suggests that our path model approximates the actual paths well because the paths are converted to parallel by the alignment pro-cess. This confirms the validity of our assumption on light paths. There are blurry artifacts outside the plastic area that should be associated with the corrupted paths described above.
We now compare the results of the reconstruction methods. In the result of the FBP, the distribution outside the blue circle is not reconstructed and it corresponds to the missing area in the sinogram. In contrast, our opti-mization method is able to reconstruct the distribution where there are insufficient observations. It is confirmed that our method has an advantage over the FBP method.
4.3 Measurement of arbitrary convex shape
We perform a simulation experiment to show our frame-work frame-works with an arbitrary convex shape. In this exper-iment, we simulate a measurement of a triangle pole.θlis
set to 30◦. Figure14shows the ground truth, the estimated contour, and the reconstructed interior with optimization. A blue line shows the ground truth contour of the object. In the estimated contour, the contour of the triangle is estimated almost correctly. Also, from the reconstructed interior, we can see the circular area at the center is reconstructed without a significant artifact.
4.4 Effect of scattering
Our method is based on the assumption of the shortest-path model that only the absorption of light in the object need be considered. However, as we found in the experi-ment for the real object, scattering in the medium may not be negligible in a practical measurement. It is expected that if the scattering of the medium is strong, our model is no longer a good approximation of paths of rays. In this section, we confirm the effect of scattering in a simulation environment.
In this experiment, the CT measurement is simulated with physically correct light transport. Synthetic data are generated by rendering with photon mapping algorithm [11]. The scene is shown in Fig. 15, i.e., a cylinder is illuminated by collimated light as in the experiment on the real object in Section4.2. The cylinder is filled with
Fig. 14Measurement of the object with triangle shape
Fig. 15Illustration of the rendered scene
the participating medium, and there is another cylinder inside. The scattering of the media is isotropic and is parameterized with scattering coefficientσsand
absorp-tion coefficient σ. σ is set to zero in the outer cylinder and 10.0 in the inner cylinder. The refractive index of the media is set to 1.0.
The CT measurements are performed for various scat-tering coefficientsσs. Note that the radius of the cylinder
is 1 andσsdecides the mean free path of the ray according
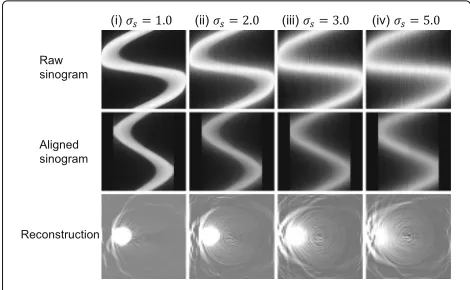
to 1/σs. Figure16shows the top view and the projections
on the camera for scattering coefficientsσs of (i) 1.0, (ii)
2.0, (iii) 3.0, and (iv) 5.0. It is found that the projection is clear in (i), where most rays scatter once or twice, and the scattering degrades the projection asσsincreases to 5.0,
where rays scatter more than five times on average. The degradation of the projection directly reflects the quality of the raw and aligned sinograms as shown in Fig.17. The bottom row shows the reconstruction from the aligned sinogram. We see that the degradation of the sinogram affects the reconstruction. While the highly absorbing part has a clear shape in (i), the shape is more blurry in (ii), (iii), and (iv).
The results show that our measurement is degraded by scattering; however, this can possibly be overcome using descattering techniques [12,13].
5 Conclusion
We investigated the optical measurement of the inter-nal structure of a diffuse surface object. Our framework is built on the shortest-path model that assumes a ray
Fig. 17Sinogram and reconstruction for different scattering coefficients
only diffuses on the surface and travels straight inside an object. Our measurement is realized with a simple setup with a rotary stage, light source, and off-the-shelf perspective camera. It was found that the observation of light rays is never sufficient with this setup for the con-ventional reconstruction method. We solved this problem by introducing a reconstruction method based on numer-ical optimization. Because of the physnumer-ical constraint on the light absorption and TV semi-norm regularization, the full interior could be reconstructed. Our method was shown to be able to reconstruct the interior of an object in a real-world experiment. Furthermore, we evaluated the reconstruction with respect to the measurement setup. It was found that the reconstruction is not perfect if rays vital to the reconstruction are not observed. We also con-firmed that scattering degrades the measurement; how-ever, the measurement is still useful for a weakly scattering medium.
Acknowledgements
The authors would like to thank all the people who kindly helped us in conducting this study.
Funding
This work is partly supported by JSPS KAKENHI Grant Number 26700013, 15K16027, and JST CREST JPMJCR1764.
Availability of data and materials
The datasets during the current study are available from the corresponding author on reasonable request.
Authors’ contributions
TI have designed and developed the methodology, performed the experiments, and prepared the manuscript. TF advised on the methodology and paper presentation. TA advised on the reconstruction algorithm, and HK advised on the simulation experiment of CT measurement. YM supervised the research and advised on the paper presentation. All authors read and approved the final manuscript.
Competing interests
The authors declare that they have no competing interests.
Publisher’s Note
Springer Nature remains neutral with regard to jurisdictional claims in published maps and institutional affiliations.
References
1. Sharpe J (2004) Optical projection tomography. Annu Rev Biomed Eng 6:209–228
2. Florescu L, Schotland JC, Markel VA (2009) Single-scattering optical tomography. Phys Rev E 79(3):036607
3. Yuan B, Tamaki T, Kushida T, Mukaigawa Y, Kubo H, Raytchev B, Kaneda K (2015) Optical tomography with discretized path integral. J Med Imaging 2(3):033501
4. Ishii Y, Arai T, Mukaigawa Y, Tagawa J, Yagi Y (2013) Scattering
tomography by Monte Carlo voting. In: IAPR International Conference on Machine Vision Applications. pp 1–5
5. Akashi R, Nagahara H, Mukaigawa Y, Taniguchi R (2015) Scattering tomography using ellipsoidal mirror. In: 2015 21st Korea-Japan Joint Workshop on Frontiers of Computer Vision (FCV). pp 1–5.https://doi.org/ 10.1109/FCV.2015.7103702
6. Ntziachristos V, Yodh A, Schnall M, Chance B (2000) Concurrent MRI and diffuse optical tomography of breast after indocyanine green enhancement. Proc Natl Acad Sci 97(6):2767–2772
7. Hebden JC, Gibson A, Yusof RM, Everdell N, Hillman EM, Delpy DT, Arridge SR, Austin T, Meek JH, Wyatt JS (2002) Three-dimensional optical tomography of the premature infant brain. Phys Med Biol 47(23):4155 8. Culver JP, Siegel AM, Stott JJ, Boas DA (2003) Volumetric diffuse optical
tomography of brain activity. Opt Lett 28(21):2061–2063 9. Iwaguchi T, Funatomi T, Kubo H, Mukaigawa Y (2016) Light path
alignment for computed tomography of scattering material. IPSJ Trans Comp Vision Appl 8(1):2
10. Laurentini A (1994) The visual hull concept for silhouette-based image understanding. IEEE Trans Pattern Anal Mach Intell 16(2):150–162.https:// doi.org/10.1109/34.273735
11. Jensen HW, Christensen PH (1998) Efficient simulation of light transport in scenes with participating media using photon maps. In: Proceedings of the 25th Annual Conference on Computer Graphics and Interactive Techniques, SIGGRAPH ’98. ACM, New York. pp 311–320
12. Fuchs C, Heinz M, Levoy M, Seidel HP, Lensch HP (2008) Combining Confocal Imaging and Descattering. In: Proceedings of the Nineteenth Eurographics Conference on Rendering, EGSR ’08. Eurographics Association, Aire-la-Ville. pp 1245–1253