R E G U L A R A R T I C L E
Open Access
The effect of Pokémon Go on the pulse
of the city: a natural experiment
Eduardo Graells-Garrido
1,2*, Leo Ferres
1,2, Diego Caro
1,2and Loreto Bravo
1,2*Correspondence: egraells@udd.cl 1Data Science Institute, Faculty of
Engineering, Universidad del Desarrollo, Av. La Plaza 680, Las Condes, Santiago, Chile
2Telefónica R&D, Av. Manuel Montt
1404, Third Floor, Providencia, Santiago, Chile
Abstract
Pokémon Go, a location-based game that uses augmented reality techniques, received unprecedented media coverage due to claims that it allowed for greater access to public spaces, increasing the number of people out on the streets, and generally improving health, social, and security indices. However, the true impact of Pokémon Go on people’s mobility patterns in a city is still largely unknown. In this paper, we perform a natural experiment using data from mobile phone networks to evaluate the effect of Pokémon Go on the pulse of a big city: Santiago, capital of Chile. We found significant effects of the game on the floating population of Santiago compared to movement prior to the game’s release in August 2016: in the following week, up to 13.8% more people spent time outside at certain times of the day, even if they do not seem to go out of their usual way. These effects were found by
performing regressions using count models over the states of the cellphone network during each day under study. The models used controlled for land use, daily patterns, and points of interest in the city.
Our results indicate that, on business days, there are more people on the street at commuting times, meaning that people did not change their daily routines but slightly adapted them to play the game. Conversely, on Saturday and Sunday night, people indeed went out to play, but favored places close to where they live.
Even if the statistical effects of the game do not reflect the massive change in mobility behavior portrayed by the media, at least in terms of expanse, they do show how ‘the street’ may become a new place of leisure. This change should have an impact on long-term infrastructure investment by city officials, and on the drafting of public policies aimed at stimulating pedestrian traffic.
Keywords: Pokémon; mobile phone data; call detail records; floating population; urban informatics
1 Introduction
Pokémon Go is a location-based mobile game about capturing and ‘evolving’ virtual char-acters that appear to exists in the same real-world location as players. As soon as it came out, people of all ages seemed to be caught in the frenzy of walking everywhere trying to find the next pocket monster. As it became world-wide hit, the game has fueled a flurry of speculation about its potential effects. It has been suggested, for example, that the game made kids and adults move out of the living room and into the open air, and that touris-tic attractions would attract more people if they had a Pokéstop (a place to check-in and get items), among many others. Real or not, Pokémon go has had some real-world effects,
some of which are not ideal: governments issuing alerts on playing the game in mine-fields,asearching for Pokémon in ‘inappropriate’ places like the Holocaust Museums and the White House,band even to causing accidents.cThe game was so popular, that in some
countries it reached engagement rates that surpass those of mainstream social platforms like Twitter and Facebook.d
The general perception is that games like Pokémon Go and its predecessor, Ingress [], could make whole populations change their mobility patterns through a reward-system: earning more points by catching creatures, getting to certain places and checking in, among other well-known gamification techniques. Ingress and Pokémon Go have a laxer definition of ‘check-points’ than a city’s usual Points of Interest (POIs, such as museums and parks) including, for example, graffiti [] and hidden heritage []. Thus, these games may help motivate visiting different kinds of places from the usual POIs. Because peo-ple tend to visit few POIs in their daily routines [], playing the game implies that peopeo-ple would tend to visit different places from those they would usually visit. If this is the case, and considering that Pokémon is one of the most successful media franchises in the world [], providing empirical evidence in favor (or against) this folk hypothesis would help un-derstand the level to which these games make people change their habits.
In this study, we seek to quantify thePokémon Go Effecton the pulse of a city, as seen from its floating population patterns. The ‘floating population’ concept denotes the num-ber of people present in a given area during a specific period of time, but who do not necessarily reside there. For instance, people who work in a business district are part of its floating population, since they probably reside elsewhere. Given the successful launch of Pokémon Go in Chile and the availability of mobile phone network data, we are able to ask sophisticated questions about floating population such as whether Pokémon Go has an effect on it at the city-scale; and if so, what the characteristics of these effects are.
In Chile, Pokémon Go was officially launched on August rd, . Reports indicate that more than one million people downloaded the game within the next five days.eTo
understand the game effects, we based our analyses on a set of mobile communications records from Telefónica Movistar, the largest telecommunications company in Chile, with a market share of % in . We used a dataset that follows the Call Detail Records structure, i.e., a dataset built for billing purposes, from July th, until August th. CDR datasets usually include logs of mobile phone calls, SMS’s, and data-type network events (e.g., Web browsing, application usage, etc.), aggregated by a context-dependent amount of downloaded information []. Even though we cannot know who is playing the game, we hypothesize that this is not needed to evaluate the city-level effect: our aim is to measure how many people were on the streets before and after the release of the game.
We explored how spatio-temporal properties of mobility were related to the Pokémon Go effect. To do so, we also used complementary datasets that are either generally avail-able, such as travel surveys, or that could be approximated using mobile phone data (e.g., land use). Hence, the methods presented in this paper can be used to perform a similar analysis in other cities, as well as monitoring for pattern changes.
The contributions of this work are two-fold. First, we introduce a methodology to ana-lyze mobile records that allowed us to identify behavioral changes at the city level. Second, we provide a case study of a city in a developing country: Santiago of Chile, and report sev-eral empirical insights about the observed phenomena. To the extent of our knowledge, this is the first large-scale study on the effect of an external factor (a location-based aug-mented reality game) on the floating population of a city.
The main findings of our work are as follows: first, there is a significant effect of the availability of Pokémon Go on Santiago’s floating population patterns, including covari-ates that account for daily patterns, land use, and available points of interest. The highest effect during business hours was found at :, with .% more people connected to mobile networks. After business hours, the strongest effect was found at :, with .% more people connected to mobile networks. Second, during business hours, the effect is significant at commuting times between important places (such as home and work) and break hours (e.g., lunch times). We conclude that people adapted their routines to play the game, concentrating geographically in places with a high floating population. Unlike those effects found during business hours, Pokémon Go players were scattered around the city at night, which hints at the possibility that people played the game near their places of residence at times when they were usually indoors. Finally, we discuss our findings in the light of practical and theoretical implications in the areas of urbanism and the social life of the city.
2 Data and methods
We focused our study on Santiago, the most populated city in the country, with almost million inhabitants. Comprising an area of . km, urban Santiago is composed of
independent administrative units called municipalities. The city has experienced ac-celerated growth in the last few decades, a trend that has been predicted to continue at least until []. Chile, and Santiago in particular, is one of the developing regions of South America with the highest mobile phone penetration index. There are about mo-bile subscriptions per people.fSantiago’s growth and the general availability of mobile
phones makes it an excellent city to perform research based on mobile communication data.
2.1 Datasets
We use the following complementary datasets:
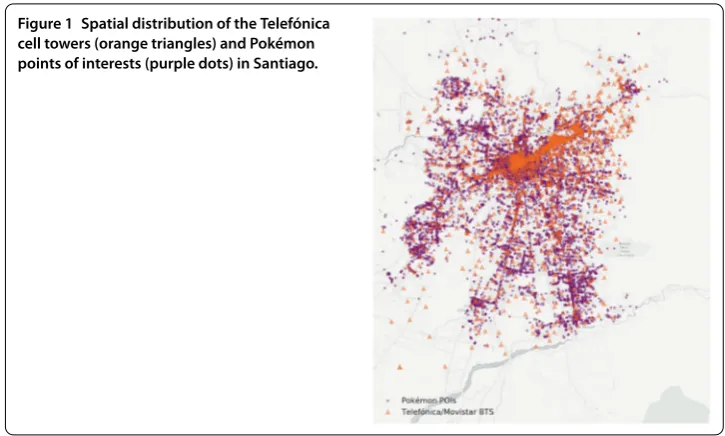
Figure 1 Spatial distribution of the Telefónica cell towers (orange triangles) and Pokémon points of interests (purple dots) in Santiago.
and floating population density, administrative boundaries, and city infrastructure into account. This enables the comparison of several phenomena between zones. On the other hand, it allows us to integrate other sources of information, providing results that can be compared to other datasets such as land use properties [].
The complete survey includes zones; however, we were interested in urban areas of a single city. Since these are densely populated, we restricted our analysis to zones with a surface of under km. As result, the maximum zone area is . km, with mean . and median . km. Finally, we were interested in zones that have both cell phone towers and Pokémon points of interests (see Figure ), resulting in zones covering km, about % of Santiago.
Ingress portals/Pokémon points of interest Before Pokémon Go, Niantic Labs launched Ingress [] in . Ingress is a location-based game where players choose one team (from two available), and try tohack(take control) severalportalsplaced in real locations world-wide. Portal locations are crowd-sourced and include ‘a location with a cool story, a place of historical or educational value,’ ‘a cool piece of art or unique architecture,’ ‘a hidden-gem or a hyper-local spot,’ among others.hThe definition of a portal, thus, includes points of
interest that go beyond the definition used in, for instance, check-in based social networks []. Once a portal is ‘hacked,’ it belongs to the corresponding faction. A set of portals belonging to the same faction defines the limit of an area controlled by it. Since players need to be close to portals to hack them, this makes players explore the city to find portals to hack and conquer for their own teams.
may be captured by many players. The game motivates walking in two ways: first, walking to points of interests that are scattered around city (see Figure ); and second, by walking , or km, players can also hatch eggs containing random pocket monsters that have better biological properties than those caught on the wild.
Mobile communication records Telefónica has , cell phone towers in the municipal-ities under consideration. We studied an anonymized Call Detail Records (CDR) dataset from Telefónica Chile. This dataset contains records from seven days prior to the launch of Pokémon Go in (from July th to August nd) and seven days after (from August th to August th). We did not take into account the day of the official launch of Pokémon Go, as there was no specific hour in which the game was officially and generally available. Also note that the dataset contains pre-paid and contract subscriptions from Telefónica.
The dataset contains data-type events rather than voice CDRs []. Unlike typical Call Detail Records for voice, each data event has only one assigned tower, as there is no need for a destination tower. Each event has a size attribute that indicates the number of KiB downloaded since the last registered event.
We did not analyze the records from the entire customer population in Santiago. In-stead, we applied the following filtering procedure: (i) we filtered out those records that do not fall within the limits of the zones from the travel survey, and also those with a timestamp outside the range between : AM and : PM; (ii) to be considered, mo-bile devices must have been active every day under study, because a device that does not show regular events may belong to a tourist, someone who is not from the city, or does not evidence human-like mobility patterns such as points-of-sale (which are mostly static); (iii) only devices that downloaded more than . MiB and less than MiB per day were included, as that indicates either inactivity or an unusual activity for a human (i.e., the device could be running an automated process); (iv) we used a Telefónica categorization scheme that associates an anonymized device ID with a certain category of service: for ex-ample pay-as-you-go, contractual, enterprise, etc. This gives us a good idea of the general kind of account holders. Thus, every step of this procedure was taken to ensure that events were triggered by humans. After applying these filters, the dataset comprised records from , devices.
Our filtering procedure ensures that a positive difference in the number of connections between two different days represents more people within a given zone. Depending on conditions such as time and location, we may interpret that some of those people are on the street. For instance, we may look at typical times where people commute, or at places where people are either inevitably outdoors (e.g., in a park) or inevitably at residential areas, which tend to have WiFi networks.i
Land use clusters We may take each traffic analysis zone to belong to one category of land use: residential, business, and areas with mixed activities (e.g., business plus recreation or shopping activities, etc.). These categories are the result of our previous work on land use and CDR data, which is based on hierarchical clustering of time-series of connections at each zone of the city [].
2.2 Approach
launch of Pokémon Go as evidenced by CDR data. First, we described a method of smooth-ing the number of connected devices at each cell tower accordsmooth-ing to several snapshots of the tower network. A snapshot is the status of the cell phone network in a given time-window []. Then, we aggregated these device counts at the zone level to define a set of observations that we evaluated in a regression model. We took into account covariates that enabled us to isolate and quantify the Pokémon Go effect.
Device counts at each tower and zone level aggregation Lete∈Ebe a network event, and |E|is the total number of such events. A network eventeis a tuple (d,u,b,z), wheredis a timestamp with a granularity of one minute,uis some (anonymized) user id,bis a tower id, andzis one of the previously defined geographical areas of Santiago. For each towerb and timedwe developed a time-seriesBd,bwhich represented the number of unique users
fromEconnected tobatd. Due to the sparsity of CDR data, it is possible thatBis not continuous. As consequence, the time-series could be null (B= ) at a point of time where there were active devices at the corresponding tower. To account for this sparsity and obtain a continuous time-series, we smoothed each time-seriesBusing Locally Weighted Scatterplot Smoothing (LOWESS) interpolation [], obtainingBd,b. To obtain a LOWESS curve, several non-parametric polynomial regressions are performed in a moving window. The size of this window is the bandwidth parameter for the model. In our implementation, this value is , which is interpreted as follows: each connection influences (i.e., is counted into) its correspondent location during minutes. Then, for each zonez, we aggregated all time-seriesBd,biintoSd,zby computing the sum of all time-seriesBd,bi, where the tower
bilies inz(determined using a point-in-polygon test, as in []). Finally, eachSd,z
time-series represents the floating population profile for each zone under study.
Measuring the Pokémon Go effect To measure the city-wide Pokémon Go effect we con-sidered the availability of the game as a city intervention, which started on the day of the launch of the game. Our hypothesis is that the following days would show an effect of the game if people went out, regardless of being players or not, and this effect would show on the number of people connected at each zone of the city. To do so, we used Negative Binomial Regression (NB) [, ] applied to our dataset at -minute intervals during a day. The NB regression model has been used frequently to analyze over-dispersed count data, i.e., when the variance is much larger than the mean, contrary to the Poisson model [].
For every minute under study (note that we restricted ourselves from AM until AM), we performed a NB regression using the observed device counts at each zone of the city in all available days in the dataset. The model is specified as follows:
logEX(t)=loga+β+βPoGo+βDayOfWeek+βLandUse+βPokePoints,
where E[X(t)] is the expected value of the number of active devices within a zone at timet. ThePoGofactor is a binary variable that has a value of when the game was not available, and when it was available. The covariatesDayOfWeek(with values busi-ness_day, Saturday, and Sunday) and LandUse(with values residential, business_only, and mixed_activities) account for the fluctuations in population on different days accord-ing to land use. Both factors use dummy codaccord-ing because they are categorical. The covariate
points of interest within an area, accounting for the number of potential attracting places in each zone. The exposure valuearepresents the surface area of each zone. Because ur-banists designed each zone having into account population density, transportation infras-tructure, and administrative boundaries, the exposure parameter also allowed to control indirectly for these potential covariates.
The model output allows the following interpretation: theβcoefficient assigned to each factor represents the difference of the logarithm of expected counts in a zone at timet, if all other factors were held equal. Sinceβ=logμ–logμ=logμμ, then the difference of
logarithms equals the logarithm of the ratio between population counts before and after the availability of the game. The exponential of this coefficient is defined as Incidence Rate Ratio,IRRβ(t) =eβ(t). We developed a time-series ofIRRβ(t) values for each factor.
By analyzing these time-series we determined when, in terms of time-windows within a day, there were significant effects for each factor.
3 Case study: the effect of Pokémon Go in Santiago, Chile
Our aim was to measure the effect of Pokémon Go in the number of people and their mobility patterns in a city. As stated in our methods section, the first step is to obtain a smoothed number of connected devices to each tower per minute during the previ-ous/following seven days to the launch of the game.
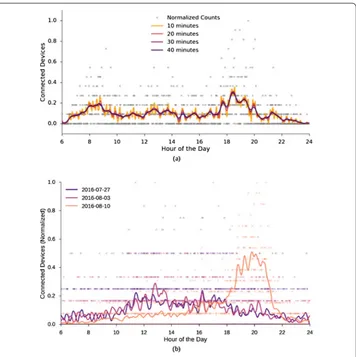
Figure (a) shows the normalized number of events per minute in a specific tower (Mon-eda Metro Station) during July th. The chart shows that there are many minutes (dots) without registered events, i.e., their position in they-axis is . This shows the sparsity of the data, because this tower is located in a business area with a high rate of public trans-portation traffic. We used LOWESS interpolation to be able to approximate the num-ber of people even in those minutes where there are no events. The continuous lines in Figure (a) are LOWESS interpolation calculations considering values of , , and minutes for the LOWESS time windows. After manual inspection of the dataset, we reasoned that a time window of minutes captured interesting regularities without in-curring in noise produced by the sparsity of the data, nor smoothing the dataset too much. Figure (b) shows the aggregation of towers within Zone for three different days: a week before the launch of the game, the day of the launch, and a week after. Zone contains a park (Parque O’Higgins), which is not usually visited at night, hinting that the availability of the game may have influenced a different behavior.
Figure 2 Connected device counts at a specific cell tower (a), and at a zone, aggregating several towers (b).Each dot represents the number of connections at a specific time of the day. The curves represent LOWESS interpolation of the number of connected devices.
but it might be due to general network outages. Notice that the curve of Pokémon Go availability in the same time period behaves as expected.
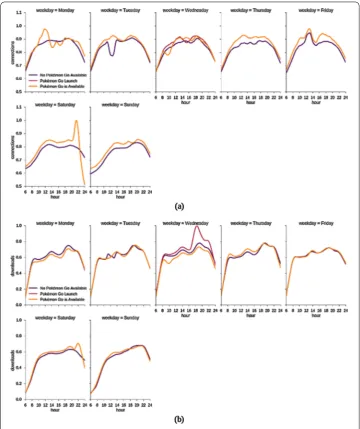
Figure 3 LOWESS time-series of normalized number of connected devices (a) and normalized total downloaded information (b), per minute, for all days in the dataset.The distributions are normalized by dividing the actual number of connections by the global maximum value. Each panel represents a different nominal day, with curves for a day before/after the launch of Pokémon Go. Wednesdays include an additional day that represents the launch of the game.
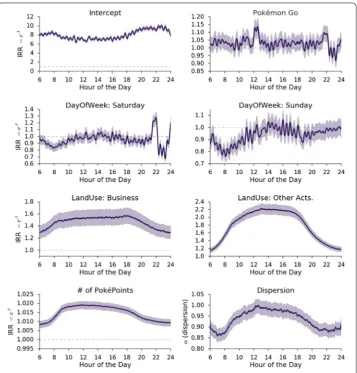
Figure 4 Covariates and dispersion (α) for each factor of the Negative Binomial regression applied to the 1-minute snapshots.The Intercept factor includes the base values of each factor: 0 for the Pokémon Go factor, business_day forDayOfWeek, residential_area forLandUse, and 0 for the number ofPokéPoints.
The day of week covariates captured behavior expected for weekends. There are fewer people (IRR is significantly lesser than ) in the morning for both kinds of days. For in-stance, the Saturday factor captured a portion of the night effect (its IRR at : PM is .). This means that not all people who went out on the Saturday when the game was available can be explained by the Pokémon Go factor. The land use covariates captured the dynamics of high floating population during the day, given the bell-shape of their dis-tributions, and their IRRs are significant during the whole day. The PokéPoints covariate, which is a proxy for points of interest in the city, is also significant during the whole day. Its maximum IRR is ., which means that for every additional POI in a zone, the num-ber of people increases by .%, if all other factors are held equal when performing the comparison.
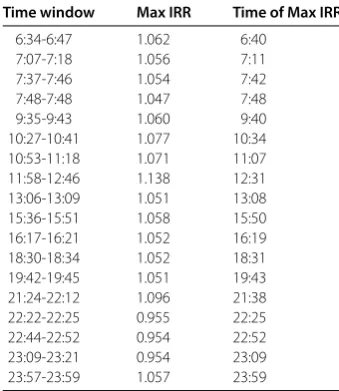
Table 1 Time-windows where the Pokémon Go effect was significant. Each window includes its maximum Incidence Rate Ratio (IRR) and its corresponding time of the day.
Time window Max IRR Time of Max IRR
6:34-6:47 1.062 6:40
7:07-7:18 1.056 7:11
7:37-7:46 1.054 7:42
7:48-7:48 1.047 7:48
9:35-9:43 1.060 9:40
10:27-10:41 1.077 10:34
10:53-11:18 1.071 11:07
11:58-12:46 1.138 12:31
13:06-13:09 1.051 13:08
15:36-15:51 1.058 15:50
16:17-16:21 1.052 16:19
18:30-18:34 1.052 18:31
19:42-19:45 1.051 19:43
21:24-22:12 1.096 21:38
22:22-22:25 0.955 22:25
22:44-22:52 0.954 22:52
23:09-23:21 0.954 23:09
23:57-23:59 1.057 23:59
per window: . and ., respectively. Thus, all other factors being held equal, the availability of the game increased the number of people connected to mobile towers in the city by .% at lunch time and .% at night.
Finally, notice that we also tested for statistical interactions between the regression fac-tors, but they were not significant. Additionally, we tested the model without the covari-ates, having only the intercept and the Pokémon effect. Particularly, the greater time-windows presented similar results and lengths, indicating that the model is robust.
Explaining the Pokémon Go effect Given the specification of our model, our results are city-wide. To explore results at a finer geographical level, we estimated the difference be-tween two time-series: the mean of connection counts per zone after and before the launch of the game by separating observations between business days and weekends. Then, we adjusted the series according to the surface area of each zone, and we obtained time-series per zone that indicate whether they had, on average, more or fewer people con-nected after the launch of the game.
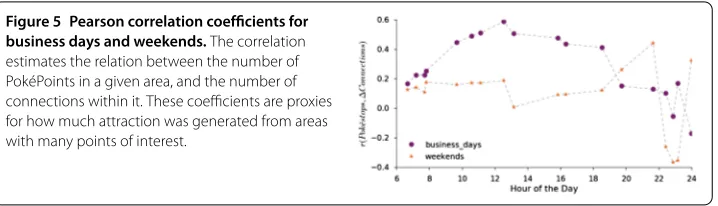
To find whether these differences correlate with the number of PokéPoints per kmin each zone, we performed a Pearson correlation for all the minutes of the day with max-imum IRR values (see Table ). These correlations vary during the day, as shown on Fig-ure . For business days, the highest correlation was found at : (r= .,p< .). For weekends, the highest correlation was found at : (r= .,p< .). The effect is stronger at lunch time on business days, and at night on weekends.
Figure 5 Pearson correlation coefficients for business days and weekends.The correlation estimates the relation between the number of PokéPoints in a given area, and the number of connections within it. These coefficients are proxies for how much attraction was generated from areas with many points of interest.
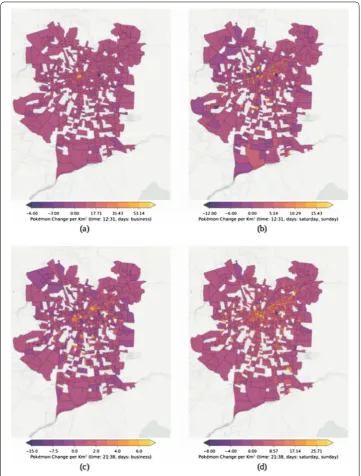
positive differences. A careful exploration of the map (d) reveals that zones with higher differences contain or are near parks and public plazas.
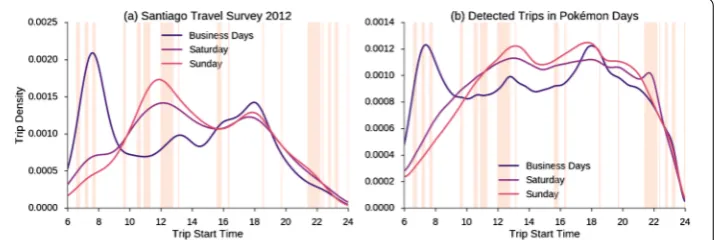
We also compared how the Pokémon Go effect related to urban mobility, by graphi-cally comparing the significant time-windows with the trip density distribution from the travel survey. Figure (a) shows the position of each time-window as a bar, and the trip densities as lines for business days, Saturdays, and Sundays. In the morning, the signifi-cant time-windows appear when the trip density is increasing or when it reaches a local maxima in business days. They also appear after noon, potentially linked to lunch breaks during business hours. All other effects, such as those at night, do not appear to have any correlation with trip behavior. Given that the travel survey is already about five years old, it was also important to compare our results to currenttrip distributions. We ap-plied a work-in-progress algorithm, based on previous work on inferring trips from CDR data []. Figure (b) shows that, in general terms, trip distributions and the effects still hold for CDR detected trips. This is not surprising, given how hard it is to change a whole population’s general mobility patterns without any exogenous circumstances, at least at the -year scale. In any case, this lends further validation to our main results.
4 Discussion
We performed a natural experiment at the city-scale comparing the behavior of a subset of the population before and after the launch of Pokémon Go in Santiago. We found that the availability of the game increased the number of people that connected to the Internet on their mobile phones by .% at lunch time and .% at night. A further exploration of the relationships among urban mobility patterns, mobile connectivity and points of interests revealed that there are two primary ways in which the Pokémon effect is noticeable. On the one hand, people take advantage of commuting times and breaks during the day to play the game. Thus, players tend to be near their work/study places, which are mostly down-town. On the other hand, on weekends at night the effect is more diversified, implying that people tend to play the game in places near their homes.
Figure 6 Choropleth maps of the difference between the means of connected devices per zone, before and after the launch of Pokémon Go.Top row shows differences at 12:31 PM on business days(a)
and weekends(b). Bottom row shows differences at 9:38 PM on business days(c)and weekends(d). The differences are adjusted by zone area, and consider business and weekend days as different groups. A zone with a value of 0 did not show differences between periods.
life[]. Hence, the usage of location-based augmented reality games may help to alleviate both situations, by placing virtual worlds on top of physical reality, and by motivating people to go out and walk around their neighborhoods as our results indicate.
Figure 7 Distribution of trip start time according to: (a) the travel survey held in Santiago in 2012, and (b) detected trips during the Pokémon days.The trips are aggregated into business days, Saturdays, and Sundays. Each rectangle shows the time-window in which the Pokémon Go effect is significant in the regression models.
Jane Jacobs, who claims that there are four conditions that must be met for a city to be lively and safe. These conditions are: the presence of pedestrians at different times of the day, the availability of mixed uses in districts, the mixture of old and new buildings, and the availability of many crossings for pedestrians []. Even though testing theories like these is difficult, some work has already been done. For instance, the city of Seoul found some evidence in favor of the theory by using house-hold surveys []. Recently, mobile communication records have been used to validate Jacobs’ theories in Italian cities []. Studies like those mentioned above [, ] perform an ex-post analysis of whether lively places comply with theories. A more granular approach would be to perform natural ex-periments like ours. To the extent of our knowledge, this is the first experiment of its kind performed using mobile records of data-type. Our method makes it possible to mea-sure the effect not only of long-term but also short-term interventions, opening a path to quantify how much specific actions help improve quality of life in the city. For instance, crime-data could be correlated with results obtained with our method to test whether the safety and livelihood theories hold after specific interventions. Additionally, as our figures have shown (cf. Figure ), our method is able to produce maps apt forpatch dynamics visualization to monitor population density [].
Limitations One limitation in our study is the lack of application usage identification. Thus, even though we included several covariates in our model to account for other effects, we may still be confounding other effects outside the Pokémon Go factor.
Another possible confounding variable is the presence of events that may attract lots of people at certain hours, influencing the Pokémon effect. In particular, since popular events such as important football games or cultural presentations were being held in Santiago at the same time as Pokémon go was launched, we felt the need to test for an effect. Adding those events as a new land use category at the zone and the time when the popular events were held, we found that they only account for the . percent of observations. Therefore, popular events had either negligible effects or no effect at all in our study.
public, it is becoming more common to have access to this kind of information thanks to several initiatives in opening and sharing data []. This kind of analysis is almost costless to perform by telecommunications companies, because mobile records are already extracted and stored for billing purposes.
A further issue involves the nature of the dataset itself. As we mentioned in the paper, Telefónica Movistar has a little more than a third of the Chilean mobile marketshare. This is the largest portion of the market (the other % is owned by many other smaller compa-nies, with the second largest one at %). This does, however, introduce some data biases, although they are hard to identify and quantify. One such bias is population bias: it is not the case that Telefónica customers are distributed uniformly in the geographical space un-der study. Since we do not have access to the Telefónica database of customers, we cannot tell how representative a certain cell-phone tower is to Telefónica versus other telcos.
A final note of caution could be said about weekend effects: since we only have one weekend, we cannot be completely confident about the results. Unfortunately, this is the dataset we have. In any case, our study was meant to be at ‘city’ level, and only analyzed the different days to explore the nature of the effect.
Regarding a potential novelty effect in our results, it may be the case that not all Poké-mon Go players during the first few days were still engaged with the game later. Indeed, the number of Pokémon Go players has gone down enormously. While the novelty effect might be true, our study was not aimed at evaluating the popularity of the game. Instead, its purpose was to quantify the city-level effects, something that could have been more concentrated in time: in Chile, the game was highly anticipated by the users and the me-dia, because it was released almost one month later than in the USA.
Future work User modeling and classification may help to categorize users into Poké-mon players and non-players, in order to study the individual effects of the game. This can be done, for instance, by estimating their daily routines from their CDR-based trajec-tories [, ], as well as their home and work locations []. Using these methodologies, we could learn whether they visited unknown places, or whether they walked slowly or faster. An epidemiological analysis of player behavior [] could help evaluate whether social in-teractions influence city exploration as a result of the Team Battle Dynamics featured in the game. A study of whether the use of the game is correlated with crime-rate reduction in public places, which could be linked with urban theories about street safety and could be useful for urban planners or the police, as well as providing evidence to some of Jacob’s theories.
Finally, given the dataset we had available, we measured the immediate change in mobil-ity patterns for the whole cmobil-ity of Santiago. However, it would have been very interesting to show that the changes in behavioral patterns hold for some weeks further into the future, perhaps even when the popularity of the game was declining (see the provisos above). This could have been a very interesting result that may have opened possible innovative usages of game-based strategies of this kind to modify citizens’ behavioral routines.
5 Related work
In order to analyze our data, we borrowed the concept of a ‘snapshot,’ i.e., the status of the cell phone network during a specific interval of time []. The comparison of snapshots of the network enables us to find which time instants actually show interesting, and, in our case, statistically significant differences. In contrast, previous work has focused mostly on studying the network when it showed higher traffic volume or population density [], without controlling for covariates or population size, which we do in this work. Controlling for this was achieved by fixing the number of users to only those activeevery single day under study, minimizing ‘noise’ in the form of one-off users, for instance. We also make use of the concept offloating population profilederived from our own, and other similar work [, –]. An interesting result is that research based on this methodology has proven consistent across different cities, enabling urban planners to compare cities with respect to their land use patterns [], as well as to study how rhythms of life differ according to socio-cultural factors [].
According to a recent survey of urban sensing research [], local event analysis is a key area of mobile phone data analysis. Local events are usually defined as unusual gatherings or movements of massive amounts of people (e.g., protests, emergencies, sports, natu-ral events, etc.) [–]. Hence, the unit of analysis is a single event with time and space constraints. Our method, instead, works at the city level with less prescribed time and lo-cation from those above. One thing in common between our work and the cited references is that all analysis have been performed ex-post, which makes it possible to create spatio-temporal signatures of places []. Even though these approaches allow us to analyze and understand the city, they do not allow measurement of city-scale phenomena due to their assumptions of locality.
Another relevant area is prediction and forecasting of human mobility [–], which allow to understand distributions [] and limits of predictability in human mobility []. Those methods focus on the big picture of mobility and rely on probabilistic models that need extensive datasets covering large periods of time, unlike ours, which only analyzed a two-week period. Another approach uses regression [], as we do. However, our method differs: instead of using longitudinal data in only one regression model, for which Poisson models are better suited [, ], we use many consecutive Negative Binomial models, one for each time snapshot of the network, thus avoiding violating the assumptions of the Poisson model, and controlling for daily rhythms at the same time []. As the dispersion value showcases (cf. Figure ), the NB regression was a correct choice, due to the exposure αbeing greater than zero []. In our case, factors that could have caused over-dispersion include aggregation and non-uniform spatial distribution of the units of analysis [].
Since as we discussed above, Pokémon is one of the most successful media franchises in the world [], it enables the unique opportunity to study both, the impact of a location-based augmented reality game; and the effect of an intervention at the city scale when it comes to population mobility.
6 Conclusions
In this paper, we studied how Pokémon Go affected the floating population patterns of a city. The game led to notable pedestrian phenomena in many parts of the world. This is extraordinary in the sense that it happened without the usual triggers like war, cli-mate change, famine, violence, or natural catastrophes. In this regard, to the extent of our knowledge, this is the first large-scale study on the effect of augmented reality games on city-level urban mobility. Given the massive popularity of the Pokémon brand, and its cultural impact in many parts of the world, we believe that the found effects represent a good approximation of mobility change in a large city.
Jane Jacobs theorized that the streets need more pedestrians to be safe and lively []. Using CDR data, it has been shown that this is true in at least some cities []. Thus, one of the most important conclusion of our work is that cities may not need to change their infrastructure in the short term to motivate pedestrians to go out. A game about imaginary creatures lurking in neighborhoods, that can be collected using cell phones encourage people to go out and make streets more lively and safe when they are commuting, or when they have free time during lunch or at night.
In summary, this study identified and investigated the effect of a specific type of phe-nomenon in the pulse of a city, measured through its floating population mobility patterns and usage of Pokémon Go. Our methods can be used to perform other natural experiments related to urban mobility, enabling measurement of the impact of city-wide interventions, and using the results to inform public policy changes.
Acknowledgements
We thank Alonso Astroza for providing a crowdsourced list of Ingress Portals validated as Pokémon Go PokéStops and PokéGyms. The analysis was performed using Jupyter Notebooks [51], jointly with thestatsmodels[52] andpandas[53] libraries. All the maps on this paper include data from©OpenStreetMap contributors and tiles from©CartoDB. We also thank Telefónica R&D in Santiago for facilitating the data for this study, in particular Pablo García Briosso. Finally, we thank the anonymous reviewers for the insightful comments that helped to improve this paper.
Funding
The authors would like to thank Movistar - Telefónica Chile and the Chilean government initiative CORFO 13CEE2-21592 (2013-21592-1-INNOVA_ PRODUCCION2013-21592-1) for financial support of this paper.
Availability of data and materials
The Telefónica Movistar mobile phone records have been obtained directly from the mobile phone operator through an agreement between the Data Science Institute and Telefónica R&D. This mobile phone operator retains ownership of these data and imposes standard provisions to their sharing and access which guarantee privacy. Anonymized datasets are available from Telefónica R&D Chile (http://www.tidchile.cl) for researchers who meet the criteria for access to confidential data. Other datasets used in this study are either derived from mobile records, or publicly available.
Competing interests
The authors declare that they have no competing financial interests.
Authors’ contributions
EG and LF designed the experiment. EG, LF and DC performed data analysis. All authors participated in manuscript preparation. All authors read and approved the final manuscript.
Endnotes
a http://goo.gl/AvjpGL.
b http://goo.gl/TWeI86.
d https://goo.gl/lqwfUb.
e https://goo.gl/T2pthM.
f https://goo.gl/sjWEjS.
g https://goo.gl/vStth8.
h https://goo.gl/4QHtBQ.
i 72% of homes have Internet access according to the last survey of telecommunication infrastructure by the Ministry
of Telecommunications of Chile, available at https://goo.gl/bwyzPG. j https://goo.gl/RcxkVA.
Publisher’s Note
Springer Nature remains neutral with regard to jurisdictional claims in published maps and institutional affiliations.
Received: 24 January 2017 Accepted: 7 September 2017
References
1. Majorek M, du Vall M (2015) Ingress an example of a new dimension in entertainment. Games Cult 11(7-8):667-689 2. Moore K (2015) Painting the town blue and green: curating street art through urban mobile gaming. M/C J 18(4).
http://journal.media-culture.org.au/index.php/mcjournal/article/view/1010
3. Stark E (2016) Playful places: uncovering hidden heritage with Ingress. In: Social, casual and mobile games: the changing gaming landscape, pp 149-164
4. Papandrea M, Zignani M, Gaito S, Giordano S, Rossi GP (2013) How many places do you visit a day? In: 2013 IEEE international conference on pervasive computing and communications workshops (PERCOM workshops). IEEE, pp 218-223
5. Buckingham D, Sefton-Green J, Allison A, Iwabuchi K, Tobin J (2004) Pikachu’s global adventure: the rise and fall of Pokémon. Duke University Press, Durham. ISBN 978-0-8223-3287-9
6. Calabrese F, Ferrari L, Blondel VD (2015) Urban sensing using mobile phone network data: a survey of research. ACM Comput Surv 47(2):Article ID 25
7. Greene W (2008) Functional forms for the negative binomial model for count data. Econ Lett 99(3):585-590 8. Puertas OL, Henríquez C, Meza FJ (2014) Assessing spatial dynamics of urban growth using an integrated land use
model. Application in Santiago Metropolitan Area, 2010-2045. Land Use Policy 38:415-425
9. Graells-Garrido E, Peredo O, García J (2016) Sensing urban patterns with antenna mappings: the case of Santiago, Chile. Sensors 16(7):Article ID 1098
10. Naboulsi D, Stanica R, Fiore M (2014) Classifying call profiles in large-scale mobile traffic datasets. In: IEEE INFOCOM 2014-IEEE conference on computer communications. IEEE, pp 1806-1814
11. Cleveland WS, Devlin SJ (1988) Locally weighted regression: an approach to regression analysis by local fitting. J Am Stat Assoc 83(403):596-610
12. Mao H, Shuai X, Ahn Y-Y, Bollen J (2015) Quantifying socio-economic indicators in developing countries from mobile phone communication data: applications to Côte d’Ivoire. EPJ Data Sci 4(1):Article ID 15
13. Nelder JA, Baker RJ (1972) Generalized linear models. In: Encyclopedia of statistical sciences
14. Cameron AC, Trivedi PK (2013) Regression analysis of count data. Econometric society monograph, vol 53. Cambridge University Press, Cambridge
15. Graells-Garrido E, Saez-Trumper D (2016) A day of your days: estimating individual daily journeys using mobile data to understand urban flow. In: Proceedings of the second international conference on IoT in urban space, Urb-IoT ’16. ACM, New York, pp 1-7. ISBN 978-1-4503-4204-9
16. Oldenburg R (1989) The great good place: cafes, coffee shops, community centers, beauty parlors, general stores, bars, hangouts, and how they get you through the day. Paragon House, New York
17. Steinkuehler CA, Williams D (2006) Where everybody knows your (screen) name: online games as “third places”. J Comput-Mediat Commun 11(4):885-909
18. Rao V (2008) Facebook applications and playful mood: the construction of Facebook as a third place. In: Proceedings of the 12th international conference on entertainment and media in the ubiquitous era. ACM, New York, pp 8-12. 19. Dammert L, Malone MFT (2003) Fear of crime or fear of life? Public insecurities in Chile. Bull Lat Am Res 22(1):79-101 20. Jacobs J (1961) The death and life of great American cities. Vintage Books, New York
21. Sung H, Lee S, Cheon S (2015) Operationalizing Jane Jacobs’s urban design theory empirical verification from the Great City of Seoul, Korea. J Plan Educ Res 35(2):117-130. doi:10.1177/0739456X14568021
22. De Nadai M, Staiano J, Larcher R, Sebe N, Quercia D, Lepri B (2016) The death and life of great Italian cities: a mobile phone data perspective. In: Proceedings of the 25th international conference on world wide web. International World Wide Web Conferences Steering Committee, pp 413-423
23. Pulselli R, Ramono P, Ratti C, Tiezzi E (2008) Computing urban mobile landscapes through monitoring population density based on cellphone chatting. Int J Des Nat Ecodyn 3(2):121-134
24. Calabrese F, Di Lorenzo G, Liu L, Ratti C (2011) Estimating origin-destination flows using mobile phone location data. IEEE Pervasive Comput 10(4):36-44
25. Kulldorff M (1998) Statistical methods for spatial epidemiology: tests for randomness. In: GIS and health, pp 49-62 26. Blondel VD, Decuyper A, Krings G (2015) A survey of results on mobile phone datasets analysis. EPJ Data Sci
4(1):Article ID 10
27. Barlacchi G, De Nadai M, Larcher R, Casella A, Chitic C, Torrisi G, Antonelli F, Vespignani A, Pentland A, Lepri B (2015) A multi-source dataset of urban life in the city of Milan and the Province of Trentino. Sci Data 2:Article ID 150055 28. Deville P, Linard C, Martin S, Gilbert M, Stevens FR, Gaughan AE, Blondel VD, Tatem AJ (2014) Dynamic population
mapping using mobile phone data. Proc Natl Acad Sci USA 111(45):15888-15893
30. Soto V, Frías-Martínez E (2011) Automated land use identification using cell-phone records. In: Proceedings of the 3rd ACM international workshop on MobiArch. ACM, New York, pp 17-22
31. Noulas A, Mascolo C (2013) Exploiting FourSquare and cellular data to infer user activity in urban environments. In: 2013 IEEE 14th international conference on mobile data management (MDM), vol 1. IEEE, pp 167-176
32. Lenormand M, Picornell M, Cantú-Ros OG, Louail T, Herranz R, Barthelemy M, Frías-Martínez E, San Miguel M, Ramasco JJ (2015) Comparing and modelling land use organization in cities. R Soc Open Sci 2(12):Article ID 150449 33. Toole JL, Ulm M, González MC, Bauer D (2012) Inferring land use from mobile phone activity. In: Proceedings of the
ACM SIGKDD international workshop on urban computing. ACM, New York, pp 1-8
34. Ahas R, Aasa A, Silm S, Tiru M (2010) Daily rhythms of suburban commuters’ movements in the Tallinn metropolitan area: case study with mobile positioning data. Transp Res, Part C, Emerg Technol 18(1):45-54
35. Calabrese F, Pereira FC, Di Lorenzo G, Liu L, Ratti C (2010) The geography of taste: analyzing cell-phone mobility and social events. In: International conference on pervasive computing, pp 22-37. Springer, Berlin
36. Ferrari L, Mamei M, Colonna M (2012) People get together on special events: discovering happenings in the city via cell network analysis. In: 2012 IEEE international conference on pervasive computing and communications workshops (PERCOM workshops). IEEE, pp 223-228
37. Traag VA, Browet A, Calabrese F, Morlot F (2011) Social event detection in massive mobile phone data using probabilistic location inference. In: 2011 IEEE third international conference on privacy, security, risk and trust (PASSAT) and 2011 IEEE third inernational conference on social computing (SocialCom). IEEE, pp 625-628 38. Bagrow JP, Wang D, Barabasi A-L (2011) Collective response of human populations to large-scale emergencies. PLoS
ONE 6(3):Article ID e17680
39. Calabrese F, Di Lorenzo G, Ratti C (2010) Human mobility prediction based on individual and collective geographical preferences. In: 2010 13th international IEEE conference on intelligent transportation systems (ITSC). IEEE, pp 312-317 40. Shimosaka M, Maeda K, Tsukiji T, Tsubouchi K (2015) Forecasting urban dynamics with mobility logs by bilinear
Poisson regression. In: Proceedings of the 2015 ACM international joint conference on pervasive and ubiquitous computing. ACM, New York, pp 535-546
41. Song C, Qu Z, Blumm N, Barabási A-L (2010) Limits of predictability in human mobility. Science 327(5968):1018-1021 42. Gonzalez MC, Hidalgo CA, Barabasi A-L (2008) Understanding individual human mobility patterns. Nature
453(7196):779-782. doi:10.1038/nature06958
43. Sevtsuk A, Ratti C (2010) Does urban mobility have a daily routine? Learning from the aggregate data of mobile networks. J Urban Technol 17(1):41-60
44. Chan AB, Vasconcelos N (2009) Bayesian Poisson regression for crowd counting. In: 2009 IEEE 12th international conference on computer vision. IEEE, pp 545-551
45. Lindén A, Mäntyniemi S (2011) Using the negative binomial distribution to model overdispersion in ecological count data. Ecology 92(7):1414-1421
46. Flintham M, Benford S, Anastasi R, Hemmings T, Crabtree A, Greenhalgh C, Tandavanitj N, Adams M, Row-Farr J (2003) Where on-line meets on the streets: experiences with mobile mixed reality games. In: Proceedings of the SIGCHI conference on human factors in computing systems. ACM, New York, pp 569-576
47. Magerkurth C, Cheok AD, Mandryk RL, Nilsen T (2005) Pervasive games: bringing computer entertainment back to the real world. Comput Entertain 3(3):4
48. Kosoris N, Chastine J (2015) A study of the correlations between augmented reality and its ability to influence user behavior. In: Computer games: AI, animation, mobile, multimedia, educational and serious games (CGAMES), 2015. IEEE, pp 113-118
49. Apperley T, Leorke D (2013) From the cybercafé to the street: the right to play in the city. First Monday. doi:10.5210/fm.v18i11.4964
50. Lantz F (2007) PacManhattan. In: Space time play, pp 262-263
51. Pérez F, Granger BE (2007) IPython: a system for interactive scientific computing. Comput Sci Eng 9(3):21-29 52. Seabold S, Perktold J (2010) Statsmodels: econometric and statistical modeling with Python. In: Proceedings of the
9th Python in science conference, pp 57-61