DOI10.1186/2193-2409-1-6
R E S E A R C H Open Access
Constructing enterprise input-output tables - a case
study of New Zealand dairy products
Manfred Lenzen·Sven Lundie
Received: 31 August 2012 / Accepted: 3 September 2012 / Published online: 5 September 2012 © 2012 Lenzen, Lundie; licensee Springer. This is an Open Access article distributed under the terms of the Creative Commons Attribution License (http://creativecommons.org/licenses/by/2.0), which permits unrestricted use, distribution, and reproduction in any medium, provided the original work is properly cited.
Abstract We describe an efficient method for estimating enterprise input-output ta-bles for cases when only information on marginal totals is available. In order to es-timate the production structure of enterprises, we utilize engineering knowledge to construct a qualitative prior containing 1 wherever an output may require an input, and 0 otherwise. This qualitative prior is then scaled by the total enterprise turnover, and subsequently reconciled using the RAS method in order to meet accounting rules. We demonstrate the usefulness of this method in an application to dairy product man-ufacturing in New Zealand, where we estimate the input-output tables for 22 produc-tion sites. Our analysis is carried out in units of mass, and hence the accounting rules are mass balance requirements.
Keywords enterprise input-output tables·RAS matrix balancing·qualitative prior·dairy industry
JEL Classification Q560·C650·L660
1 Introduction
Perhaps one of the unconventional uses of input-output analysis is its application to processes and networks within firms. Nevertheless, so-called enterprise models have
M Lenzen (
)ISA, School of Physics A28, The University of Sydney, Sydney, NSW 2006, Australia e-mail:[email protected]
S Lundie
PE INTERNATIONAL, Hauptstraße 111 - 113, 70771 Leinfelden-Echterdingen, Germany e-mail:[email protected]
S Lundie
been constructed for more than 40 years (Farag1967). A true enterprise model is different from single-region input-output models where the inputs and outputs of a firm augment the table by one sector (Tiebout1967; Billings and Katz1982; Joshi
2001). Rather, the firm is appraised as a system in its own right, and represented as a table distinguishing functional units of the firm as row and column sectors (Grubb-strom and Tang2000; Lave2006). Perhaps the most comprehensive and at the same time pioneering work is that of Polenske (1997), who demonstrated the usefulness of an enterprise input-output model that is embedded in the nested system of re-gional and national input-output tables. Since then, a number of interesting enterprise input-output models and their applications have been published worldwide (Correa and Craft1999; Marangoni and Fezzi2002; Li et al.2008; Lenzen et al.2010a), notably by Albino and colleagues (Albino et al. 2003; Albino and Kühtz 2004). Polenske’s basic idea was taken up again in recent input-output-based hybrid life-cycle approaches, where a so-called foreground system containing interdependent production processes is embedded in a national input-output table (Heijungs and Suh
2002; Suh2004).
Our work is about employing an enterprise model of the dairy industry in an as-sessment of life-cycle input coefficients of dairy products. Our approach is motivated by the fact that, given a growing population and demand for food and at the same time limited land resources for cultivation, the food sector - including the dairy in-dustry - faces increasing pressure to move toward more resource-efficient production as measured in the context of life-cycle systems (Flysjö2011). Therefore, standards and guidelines have been developed (for example, ISO 140442006; IDF2010), and efforts have been made to quantify the resource and environmental impacts of the dairy industry (Berlin2002; Lundieet al.2002; de Vries and de Boer2010; Nilsson et al.2010). More recently, the industry and retailers have started to systematically quantify and publish the environmental impacts of their products. These industry ac-tivities have so far concentrated on carbon accounting, that is, carbon footprinting and carbon labeling (Carbon Disclosure Project2011). These carbon-related report-ing and labelreport-ing activities are predominantly based on the methodology of life-cycle assessment (ISO 140442006).
In particular, we investigate whether enterprise input-output approaches can be employed to deal with themulti-functionalityissue in environmental Life-Cycle As-sessment, which has been identified as a significant methodological problem (ISO 140442006, Cirothet al.2008). When assessing the environmental performance of products, the general situation is that most processes that constitute part of a pro-duction system are multi-functional: (1) they may produce more than one product (co-production), or (2) they may treat two or more waste inputs (combined waste treatment), or (3) they may treat one waste input and produce one valuable output. Combinations of these main types, involving three or more of the above basic func-tions on both the input and output side may also occur (Heijungs and Suh2002). Multi-functionality is especially present in dairy manufacturing systems. For exam-ple, the input of raw milk on a whole-of-plant basis needs to be allocated to the final products: skim milk powder, butter and buttermilk powder.
dif-ferent products according to clearly stated procedures. Several approaches for deal-ing with the multi-functionality problem have been developed, for example, through system boundary expansion and by allocation (or partitioning) using physicochemi-cal, economic, mass and energy approaches (see, for example, Cederberg and Stadig
2003; IDF2010; Feitzet al.2007; Weidema2003,2004).
2 Aim of this work
Enterprise input-output tables, the basic ingredient of the studies listed above, are usually constructed based on data gathered during firm surveys. Such surveys usually gather data on inputs and outputs for various sub-processes or sub-branches of the firm, which are then collated into a complete input-output table. It is the aim and also the novelty of this work to demonstrate a semi-survey method for constructing enterprise input-output tables solely from marginal totals. In this respect, our method resembles early matrix balancing methods described by Deming and Stephan (1940), Stephan (1942), Friedlander (1961), and Bacharach (1965), and in fact, our work makes use of the widely known RAS matrix balancing technique (Bacharach1970).
In this paper we have applied this balancing approach to resolve the problem of allocation of inputs to products of multi-product processing sites in the dairy indus-try. Dairy products manufacturing requires a number of primary inputs such as raw milk, ingredients, chemicals, energy carriers and water. Dairy manufacturing plants usually produce more than one product as the fat content in raw milk usually exceeds the required fat content of milk powders, cheeses or fresh milk products (for example, market milk, yogurt or dairy desserts). Therefore, excess milk fat is normally further processed into butter or anhydrous milk fat (AMF). The primary input raw milk is also transformed into intermediate products such as lactose and whey, which may in turn be transformed into other intermediate products. Finally, a number of outputs emerge, such as milk, butter, cheese, and cream, but small fractions of substance also end up in solid waste and waste water. Dairy manufacturing plants consequently pro-duce a wide variety of products, but resource use or emissions data are typically only available on a whole-of-factory basis. Data collection for each unit process within the plant is resource-intensive, and there is typically insufficient metering to collect the required information. In addition, many of the unit processes are shared for pro-ducing different products (for example, pasteurization/separation or spray drying). Such aggregation of data poses problems when undertaking the Life Cycle Assess-ment (LCA) for a selected product within a multi-product setting. To compare the life cycle of one dairy product to another, therefore, requires determination of the material consumption and process energy (electricity and fuel) demand in addition to emissions from a plant for each product.
In short, dairy products manufacturing represents an input-output system of inter-dependent sectors. Whereas in an economic system the sectors are industries that are interconnected by money transactions measured in currency units, in our dairy prod-ucts manufacturing system the sectors are substances that are interconnected through mass flows measured in mass units.
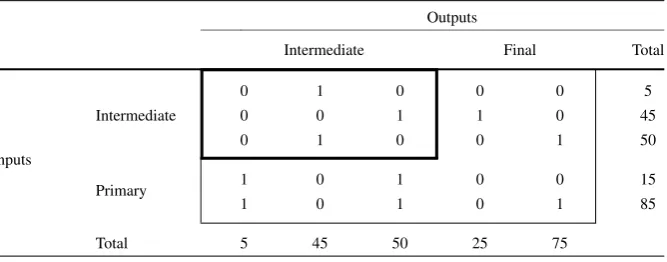
Table 1 Hypothetical enterprise input-output table (thin frame), including a qualitative prior for interme-diate mass flows (bold frame) and primary and final mass flows (thin frame), as well as marginal row and column sums (total inputs and outputs), for a dairy manufacturing site
Outputs
Intermediate Final Total
Inputs
0 1 0 0 0 5
Intermediate 0 0 1 1 0 45
0 1 0 0 1 50
Primary 1 0 1 0 0 15
1 0 1 0 1 85
Total 5 45 50 25 75
tables for all 22 dairy manufacturing enterprises owned by Fonterra in New Zealand from (a) a qualitative prior matrix, and (b) data on total inputs and outputs of products. The qualitative prior is a binary matrix with entries initially set to one where an input may be required to produce an output, and zero where this is not the case. As the raw data, these tables are expressed in mass units, and therefore, a mass balance has to be imposed on the whole enterprise system. This requirement forms the basis for applying the RAS matrix balancing approach. The resulting 22 enterprise input-output tables are aggregated into one table representative for the entire industry. In order to ascertain the quality of this enterprise table, we examine the level of variance in input-output coefficients across all single manufacturing sites. As a further test of quality, we aggregate our micro-level coefficients so that we can compare them (a) with macro-level data from input-output tables, and (b) with a bottom-up process-type life-cycle assessment of a dairy processing system (Feitzet al.2007).
We first explain our methodology and then our data sources in the following two sections. Thereafter, we present our results and conclude.
3 Methodology
We construct an enterprise input-output table in physical units of mass flow for each of the 22 manufacturing sites (schematic in Table1). We define primary inputs as those inputs that are not supplied by any of the dairy manufacturing sites. Primary in-puts (such as raw milk) are used to produce both intermediate outin-puts (such as whey) and final outputs (such as cheese). We define intermediate inputs as those inputs that are supplied within the dairy manufacturing system. Like primary inputs, intermedi-ate inputs (such as whey) are also used to produce both intermediintermedi-ate outputs (such as whey) and final outputs (such as cheese). Finally, we define intermediate outputs as those outputs that are used again as inputs to produce other outputs, and final outputs as those outputs that end with the consumer and do not enter the production system again.
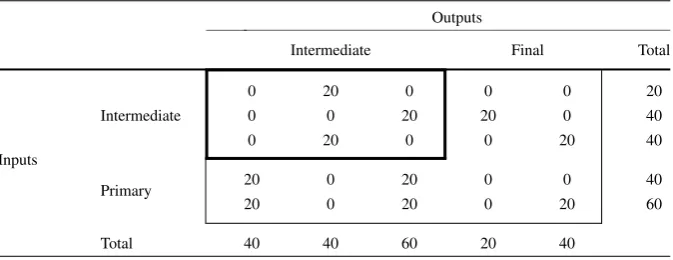
Table 2 Hypothetical enterprise input-output table with a scaled qualitative prior
Outputs
Intermediate Final Total
Inputs
0 20 0 0 0 20
Intermediate 0 0 20 20 0 40
0 20 0 0 20 40
Primary 20 0 20 0 0 40
20 0 20 0 20 60
Total 40 40 60 20 40
demand, and in fact, the concept of mass flow in physical input-output tables is not fundamentally different from the concept of circulating money in an economy. As with monetary input-output tables, all intermediate outputs are also intermediate in-puts, if not in practice then in principle, and hence our intermediate mass flow matrix is square and symmetrical.
As mentioned in the introduction, we construct the 22 enterprise input-output ta-bles based only on two sets of data: (a) a qualitative prior matrix, and (b) data on total inputs and outputs of products. Table1lists hypothetical total inputs and outputs in the bottom row and right-hand column. Totals of intermediate inputs and outputs are equal, because we assume matter cannot be lost anywhere in the system. Totals for primary inputs must not equal those for final outputs, because primary inputs are be-ing transformed by the system into outputs, and final outputs are bebe-ing produced by the system from transformed inputs. However, the total across all primary inputs is equal to the total across all final outputs, once again because matter cannot be lost. The qualitative prior in Table1(thin frame) is a binary matrix with entries set to 1 where an input may be required to produce an output, and 0 where this is not the case. The identity of 0s and 1s is determined solely on the basis of engineering knowledge. Such a qualitative prior is useful for fixing the input structure in cases where informa-tion on intermediate flows is completely absent (see Table 3.30 in Müller (2006) for an example of applying the qualitative prior method to the construction of SAMs).
The construction of the enterprise tables now proceeds in two steps. First, the qualitative prior is scaled so that the sum of all elements equals total mass turnover of the establishment. In our hypothetical example, the qualitative prior will be multiplied by 200/10=20 in order to scale the binary-element total from 10 to the prescribed input and output total of 200 (Table2). Note that this scaled prior does not balance, that is, row and column sums for intermediate products are not equal as required. This is a common situation encountered by virtually every researcher faced with the task of constructing input-output tables.
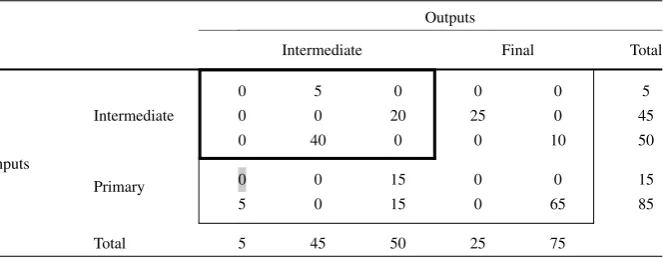
Table 3 Hypothetical, fully balanced enterprise input-output table for a dairy manufacturing site
Outputs
Intermediate Final Total
Inputs
0 5 0 0 0 5
Intermediate 0 0 20 25 0 45
0 40 0 0 10 50
Primary 0 0 15 0 0 15
5 0 15 0 65 85
Total 5 45 50 25 75
constraints whilst preserving the structure of the scaled prior as much as possible. The fully balanced version of our hypothetical enterprise table is shown in Table3.
The shaded element is the one where primary input 1 could have been used in principle, but appears not to have been used in practice, for producing intermediate output 1. This serves to show the utility of RAS to derive solely from data on totals, and a mass-balance condition, how inputs are best allocated across co-products in a complex production system.
4 Analysis
We undertake a number of diagnostic analyzes on the 22 enterprise tables constructed as described in the previous section. LetTs be the balanced enterprise input-output
tables for thes=1, . . . ,22 sites. In order to control the different sizes of manufac-turing sites, we calculate input-output coefficients according toAs=Tsxs−1, where
xs denotes the diagonalization of a vectorxs=Ts1containing gross substance
out-put of manufacturing sites,1= {1, . . . ,1}is a summation operator, and the prime denotes transposition. In input-output economics parlance, Ais called a direct re-quirements matrix. It is commonly referred to as the production recipe, because it is independent of production scale.
In order to fulfill our main aim, a representative enterprise input-output table for the New Zealand dairy products industry, we derive a combined tableAby taking a weighted averageA∗=swsAs over all 22 enterprises, wherews=xs/rxr, andxs
is total mass turnover of enterprises. As a result, enterprises influence the weighted average according to their size. In addition we calculate relative and absolute standard errors for each element ofA∗.
Finally, we useA∗ in order to calculate the classical Leontief inverse L=(I− A∗)−1, whereIis an identity matrix with the same dimensions asA∗. The elements Lij ofLthen represent the total (direct and indirect) mass requirement of substance
ito produce substancej.
Ln,ij =Lij/Li,milk powder. This unusual way of normalization was chosen by
repre-sentatives of the Australian Dairy Processing Industry because the preference was to release relative figures rather than absolute figures. Therefore, results were reported in relation to the reference product milk powder.
5 Data sources
To achieve our stated aims, we first collected data in mass and energy units on all intermediate and primary inputs, and on intermediate and final outputs for the man-ufacturing sites. Before starting with the onsite data collection we developed a ques-tionnaire, asking for information on throughputs of various inputs and outputs. The questionnaire lists, for example, intermediate outputs such as AMF, cheese whey, ca-sein fines (43 in total). These intermediate outputs are identical with the intermediate inputs. Primary inputs asked for (52 in total) are, for example, ingredients (such as salt), chemical usage (caustic, nitric acid, triplex sodium hypochlorite), energy (elec-tricity usage, thermal energy consumption from black coal, lignite, gas, oil, LPG and biogas, cogenerated steam and waste heat), packaging (for example, kraft liner, card-board, polypropylene, steel drums, nitrogen and carbon dioxide usage), refrigerant use (R22 and ammonia), and town water usage. Final outputs asked for (29 in total) are milk powders (skim and whole milk powder, butter milk powder, nutritionals, spe-cialty powders, different types of MPC), cheese (dry salt and brine salt cheese, mozz type cheese and cream cheese), fat products (butter, fat blend), casein-based products (casein and caseinate) and whey products (whey powder, whey protein concentrate, whey fractions, lactose, lactalbumin, alamin and ethanol). Final outputs also include milk solids to waste, wastewater discharged to sewer and solid waste.
The data collection was predominantly done by site visits. Relevant data were extracted from onsite meters, data management systems (for example, SAP, Excel) and financial accounts (for example, expenditure data allow backtracking to mass and energy flows). Obtaining high-quality data is challenging as the majority of the mass and energy flows are captured only on a whole-of-plant basis, for example, thermal and electrical energy consumption and town water demand are usually not measured for separate processing steps. However, there are also mass inputs that can be allocated directly (in the qualitative prior) to specific products, for example, salt to cheese, or low density polypropylene for packing cheese. An additional challenge is caused by the intermediate product transfers between sites. There is a large variation of these product transfers among individual sites, while the overall amount of product transfers forallsites is only∼2% compared to the total quantity of final products.
Second, we set up a qualitative prior on the basis of extensive interviews with ex-perts from the dairy industry. The qualitative prior reflects the structure of mass flow of all inputs and outputs. In addition to the scaling described above, we also weight the qualitative prior (with weights ranging between 0.001 and 1) in order to sup-press some connections and emphasize others (compare with a weighting procedure applied by Müller and Djanibekov (2009) for estimating an agricultural model).
and whole milk as a primary input. This is straightforward for final outputs such as butter, different types of whey products, powders, cheeses and milk concentrates, but more complex for intermediate outputs, mainly due to the choice of intermedi-ate product names and the variety of how processing sites manufacture their dairy products. For raw milk and whole milk inputs, we have identified 23 intermediate outputs in total, such as cream, homogenized milk, skim milk and whey cream. In these cases 1 is set where an input is required to produce an output, and 0 where this is not the case. A small fraction of milk solids enters the waste stream, that is, wastewater discharged to sewer or municipal household waste.
Some of the primary inputs are ingredients that can be allocated directly to final products: for example, lactose goes into milk powders, salt is used for butter, cheese and MPC, and acetic is used for MPC. In these cases we weight the qualitative prior elements with 0.01 because these ingredients can be expected to contribute less to final products than to intermediate products. Direct allocation is also possible for the majority of cleaning agents (caustic, nitric acid, triplex sodium hypochlorite), for ex-ample, triplex being used for cleaning caseinate processing equipment. Packaging material consists of the actual material (kraft liner, cardboard, polypropylene, steel drums) in which the product is contained in and - in the case of powders - nitrogen and carbon dioxide gas that is filled in the packaging material together with the prod-uct. Paper, paper cases and LDPE are assumed to be required for all products, while HDPE and some LDPE can be directly attributed to butter and cheese.
Energy inputs (electrical and thermal) are not subject to mass flow constraints as all other inputs. Therefore, we used additional process information for allocating electrical and thermal energy consumption to the final products.
Intermediate inputs are products that are required for producing intermediate and final dairy products. In total there are 43 intermediate inputs, and in our system these are transformed into intermediate outputs in 196 combinations. For example, AMF is potentially used in AMF, beta serum, butter rework, colostrums cream and milk, cream (high-fat and organic), whey AMF serum and whey cream. In addition, inter-mediate inputs are also used for producing final products that are sold to the market; for example, skim milk concentrate is used for MPC70, cheese dry salt and brine salt, mozz type cheese and cream cheese.
Whilst the above description is nowhere near exhaustive in explaining the entire qualitative prior, it serves as an illustration of the principles followed in constructing such a prior.
6 Results
The enterprise input-output matrixA∗for the New Zealand dairy manufacturing sys-tem is reasonably sparse (Figure1, left plot). This sparsity is of course pre-determined by the non-zero entries in the qualitative prior, because the zero entries are preserved during RAS balancing. Most of the significant elements inA∗ can be found in two particular rows that hold milk solids (row #44) and town water (row #85), which constitutes by far the main mass flows.
Fig. 1 Checkerboard plot of log10(A∗ij)and its absolute and relative standard errors. Element magnitude is represented by cell colors. The axes are scaled by sector numbers: rows and columns 1-43 represent in-termediate inputs and outputs, rows 44-88 represent primary inputs, columns 44-73 represent final outputs.
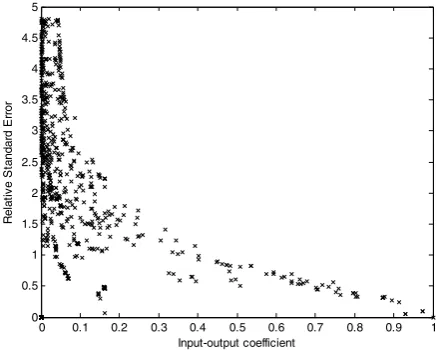
Fig. 2 Relative standard errors of input-output coefficients as a function of their magnitude.
associated with small elements inA∗. Moreover, Figure2reveals an inverse relation-ship where large elements are associated with small relative standard errors and vice versa. For example, small standard deviations are associated with large elements in A∗, for example, mass flows of milk solid inputs and town water inputs. This circum-stance is well known from statistical analyzes of input-output tables (Lenzen2000; Lenzenet al.2010b). It means that the proportion of small and unimportant inputs into production processes can vary significantly between enterprises, but that the pro-portion of large and important inputs is relatively constant. For example, the input of nitric acid into whole milk powder fluctuates between 0.002% and 0.05% of milk powder mass, but the input of raw milk solids into various intermediate and final dairy products ranges only between 5% and 10% of product mass.
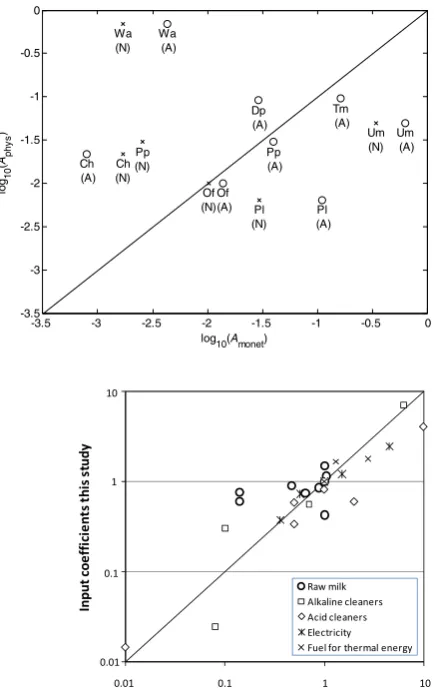
co-Fig. 3 Comparison between monetary and physical input-output coefficients for dairy products.Aand ‘o’ symbols = Australia,Nand ‘x’ symbols = New Zealand,Ch= Basic chemicals,Dp= Dairy products,Of= Other food products,Pl= Plastic products, Pp= Paper products,Tm= Treated milk,Um= Untreated milk,Wa= Water supply.
Fig. 4 Comparison between our dairy enterprise input-output multipliers and life-cycle coefficients obtained by Feitzet al.(2007). Each marker group represents inputs into up to 9 dairy products (milk powder, milk, cream, butter, AMF/ghee, cheese, whey powder, UHT, WPC/lactose) according to Feitz et al.(xaxis) and this study (yaxis). Groups including less than 9 markers indicate that inputs are unimportant for some products.
efficients, the magnitudes of the relative proportions of inputs agree reasonably well (Figure3). Areas above the diagonal indicate inputs that are more important in phys-ical terms than in monetary terms, and vice versa for the area below the diagonal. Of course, water supply deviates most strongly from the diagonal, but also basic chem-icals are an order of magnitude less expensive for their mass than other inputs. On the other hand, plastic products affect inputs more financially than physically. Inter-estingly, Australian and New Zealand monetary input coefficients agree reasonably well, except for the monetary input of paper products into dairy manufacturing, which appears to be much smaller in New Zealand than in Australia.
Finally, we compare our normalized Leontief multipliersLnwith the life-cycle
of water per tonne of yogurt) from 17 multi-product manufacturing plants with a sim-ilar processing technology. The process involved using initial literature and company estimates for resource efficiency per product (for example, GJ of electricity/tonne of milk powder), normalizing the resource efficiency figures for all products to milk powder, and producing a matrix of life-cycle resource efficiency coefficients.
We observe some deviations from equality (represented by the diagonal in Fig-ure4); however, these deviations are almost all smaller than half an order or magni-tude, and hence comparable to variations within our sample of dairy manufacturing firms (compare with Figure2). Considering that the study by Feitzet al.and our study deal with entirely different sets of firms, the agreement between the two is reasonable enough to demonstrate that our results are in the right ballpark. This is especially because this comparison is in terms of aggregates of products (cheese, milk,etc.), which are likely to differ between this study and the one by Feitzet al.
7 Conclusions
We have described an efficient method for estimating enterprise input-output tables for cases when only information on marginal totals is available. In order to fix the production structure of enterprises, we utilize engineering knowledge to construct a qualitative prior containing 1 wherever an output may require an input, and 0 other-wise. Mass flow balance is accomplished by balancing a scaled prior using the RAS matrix balancing method.
We have demonstrated the usefulness of this method in an application to dairy product manufacturing in New Zealand, where we estimate input-output tables in mass units for 22 dairy manufacturing enterprises.
We encountered only one problem where improvements could be made in future applications. The water mass balances of most sites have been problematic: while the water content of primary input raw milk was always well known, there were discrep-ancies in metering information for incoming town water and discharged wastewater resulting in inconsistencies of mass balances for many sites. Since town water is such a significant input in mass terms, these discrepancies distorted the adjustment of smaller mass flows of other substances. In the future we recommend paying par-ticular attention to obtaining quality data for important mass flows. In addition, we recommend treating the input of water on a net basis, that is, to exclude all once-through water uses such as for washing equipment and to include only water that is associated with substance transformations.
Appendix: List of inputs and outputs
A.1 Intermediate inputs and outputs
1.AMF 2.Beta serum 3.Butter rework 4.Buttermilk 5.Casein fines 6.Cheese whey
7.Cheese whey concentrate 8.Cheese whey retentate 9.Colostrum Cream 10.Colostrum milk 11.Colostrum permeate 12.Cream
13.Cream fima 14.Cream hi fat 15.Dilute milk permeate
16.Evap milk perm 30% 17.Evap milk perm 45% 18.High fat whey retentate 19.Homog milk
20.Imported Lactose 21.Ion exchange whey 22.Lactalb slurry 23.Lactic whey 24.Lactose slurry 25.Milk perm 18% 26.Mineral acid whey 27.Nano filtered whey 28.Organic Cream 29.Permeate
30.Reconstituted lactose
31.Retentate concentrate 32.Retentate concentrate_Gen 33.RO Milk
34.Secondary skim milk 35.Skim milk
36.Skim milk concentrate 37.Skim milk retentate 38.Whey
39.Whey AMF serum 40.Whey cream 41.Whey permeate 42.Whey protein retentate 43. Whey_2
A.2 Primary inputs
1. Total MS from raw and whole milk
2.Milk concentrate 3.Proliq
4.Lactose only milk powder 5.Ingredients milk powder 6.Salt butter
7.Salt cheese 8.Salt MPC 9.Acetic acid MPC 10. Calcicum hydroxide
caseinate 11. Sodiuim hydroxide
caseinate
12.Sulphuric acid caseinate 13.Caustic milk treatment 14.Nitric acid milk treatment 15.Triplex milk treatment
16. Sodium hypochlorite milk treatment
17.Caustic demin 18.Nitric acid demin 19. Sodium hypochlorite
demin 20.Caustic butter 21.Nitric acid butter 22.Sodium hypochlorite butter 23.Caustic milk powder 24.Nitric acid milk powder 25. Sodium hypochlorite milk
powder
26.Caustic MPC42-85 27.Triplex MPC42-85 28. Sodium hypochlorite
MPC42-85
29. Caustic dry salt cheese
30.Nitric acid dry salt cheese 31.Triplex dry salt cheese 32. Sodium hypochlorite dry salt
cheese
33.Caustic caseinate 34.Triplex caseinate
35.Sodium hypochlorite caseinate 36.Caustic lactose
37.Nitric acid lactose 38.Triplex lactose
39.Sodium hypochlorite lactose 40.Nitrogen usage
A.3 Final outputs
1.Butter 2.Fat Blend 3.Skim milk powder 4.Whole milk powder 5.Butter milk powder 6.Nutritionals 7.Specialty Powders 8.MPC42
9.MPC56 10.MPC70
11.MPC 85 12.Cheese (dry salt) 13.Cheese (brine salt) 14.Mozz type cheese 15.Cream Cheese 16.Casein 17.Caseinate 18.Whey powder 19.WPC 20.Whey fractions
21.Lactose 22.Lactalbumin 23.Alamin 24.Ethanol 25.Milk concentrate 26.Proliq
27.Milk solids to waste
28.Wastewater discharged to sewer 29.HSW waste (trucked)
Competing interests
The authors declare that they have no competing interests.
Authors’ contributions
ML developed the methodology and carried out the calculation and generated the quantitative results, while SL was in charge of data collection, populating the qualitative prior matrix. ML and SL interpreted the results and drew the conclusions. All authors read and approved the final manuscript.
Acknowledgement The authors are grateful for expert advice and data on mass inputs and outputs for 22 New Zealand dairy manufacturing sites collected by Jim Barnett (Fonterra).
References
ABS (2009) Australian National Accounts: Input-Output Tables, 2005-06. ABS Catalogue No. 5209.0.55.001, Canberra, Australia, Australian Bureau of Statistics
Albino V, Dietzenbacher E, Kühtz S (2003) Analysing materials and energy flows in an industrial district using an enterprise input-output model. Econ Syst Res 15:457-480
Albino V, Kühtz S (2004) Enterprise input-output model for local sustainable development - the case of a tiles manufacturer in Italy. Resour Conserv Recycl 41:165-176
Bacharach M (1965) Estimating nonnegative matrixes from marginal data. Int Econ Rev 6:294-310 Bacharach M (1970) Biproportional matrices & input-output change. Cambridge University Press,
Cam-bridge
Berlin J (2002) Environmental Life Cycle Assessment (LCA) of Swedish semi-hard cheese. Int Dairy J 12:939-953
Billings RB, Katz JL (1982) A technique to obtain accurate impact multipliers for individual firms by means of existing input-output models. Environ Plan A 14:739-744
Carbon Disclosure Project (2011)https://www.cdproject.net/en-US/Pages/HomePage.aspx. Accessed Sept 2011
Ciroth A, Lundie S, Huppes G (2008) UNEP/SETAC Life Cycle Initiative, Life Cycle Inventory (LCI), Task Force 3, Methodological Consistency: Inventory methods in LCA: towards consistency and improvement. VDM-Verlag
Correa H, Craft J (1999) Input-output analysis for organizational human resources management. Omega 27:87-99
de Vries M, de Boer IJM (2010) Comparing environmental impacts for livestock products: a review of life cycle assessments. Livestock Science 128:1-11
Deming WE, Stephan FF (1940) On least-squares adjustments of a sampled frequency table when the expected marginal total are known. Ann Math Stat 11:427-444
Farag SM (1967) Input-output analysis: applications to business and accounting. Center for International Education and Research in Accounting, Urbana
Feitz A, Lundie S, Dennien G, Morain M, Jones M (2007) Generation of an industry-specific physico-chemical allocation matrix - application in the dairy industry and implications for systems analysis. Int J Life Cycle Assess 12(2):109-117
Flysjö A (2011) Potential for improving the carbon footprint of butter and blend products. J Dairy Sci 94(12):5833-5841
Friedlander D (1961) A technique for estimating a contingency table, given the marginal totals and some supplementary data. J R Stat Soc, A 124:412-420
Grubbstrom RW, Tang O (2000) An overview of input-output analysis applied to production-inventory systems. Econ Syst Res 12:3-25
Heijungs R, Suh S (2002) The computational structure of life cycle assessment. Kluwer Academic, Dor-drecht
IDF (2010) A common carbon footprint approach for dairy - the IDF guide to standard lifecycle assessment methodology for the dairy sector. Bull - Int Dairy Fed 445/2010; ISSN 0250-5118
ISO 14044 International Standardization Organisation (ISO) (2006) Environmental management - Life cycle assessment - Life Cycle Interpretation. ISO 14044. Geneva (Switzerland)
Joshi S (2001) Product environmental life-cycle assessment using input-output techniques. J Ind Ecol 3:95-120
Lave LB (2006) Enterprise and materials flow input-output analysis. In: Hendrickson CT, Lave LB, Matthews HS (eds) Environmental life cycle assessment of goods and services - an input-output approach. Resources for the Future, Washington, pp 179-183
Lenzen M (2000) Errors in conventional and input-output-based life-cycle inventories. J Ind Ecol 4:127-148
Lenzen M, Benrimoj C, Kotic B (2010a) Input-output analysis for business planning: a case study of the University of Sydney. Econ Syst Res 22:155-179
Lenzen M, Wood R, Wiedmann T (2010b) Uncertainty analysis for Multi-Region Input-Output models - a case study of the UK’s carbon footprint. Econ Syst Res 22:43-63
Li J, Tong R, Wang Y (2008) Transregional enterprise input-output model and its application in production decision-making. In: CCCM ’08, ISECS international colloquium on computing, communication, control, and management 3 pp 211-215
Lundie S, Feitz A, Changsirivathanathamrong A, Jones M, Dennien G, Morain M (2002) Evaluation of the environmental performance of the Australian dairy processing industry using Life Cycle Assessment. Final report for Dairy Australia
Marangoni G, Fezzi G (2002) Input-output for management control: the case of GlaxoSmithKline. Econ Syst Res 14:245-256
Müller M (2006) A general equilibrium approach to modeling water and land use reforms in Uzbekistan. Dissertation, Bonn, Germany, Zentrum für Entwicklungsforschung, Rheinische Friedrich-Wilhelms-Universität.http://hss.ulb.uni-bonn.de/2006/0801/0801.pdf
Müller M, Djanibekov N (2009) Calibration of an agricultural sector model for the region Khorezm (Uzbekistan) based on survey data. In: 27thinternational IAAE conference, the new landscape of global agriculture, Beijing, China. International Association of Agricultural Economists (IAAE), Milwaukee.http://ageconsearch.umn.edu/bitstream/50354/2/533.pdf
Nilsson K, Flysjö A, Davis J, Sim S, Unger N, Bell S (2010) Comparative life cycle assessment for mar-garine and butter consumed in UK, Germany and France. Int J Life Cycle Assess 15:916-926 Polenske KR (1997) Linked system of enterprise, regional and national input-output accounts for policy
Statistics New Zealand (2011) Supply and use tables - year ended March 2007. Wellington, New Zealand. http://www.stats.govt.nz/browse_for_stats/economic_indicators/NationalAccounts/supply-use-tables-yr-end-mar-07.aspx
Stephan FF (1942) An iterative method of adjusting sample frequency tables when expected marginal totals are known. Ann Math Stat 13:166-178
Suh S (2004) Functions, commodities and environmental impacts in an ecological-economic model. Ecol Econ 48:451-467
Tiebout CM (1967) Input-output and the firm: a technique for using national and regional tables. Rev Econ Stat 49:260-262
Weidema BP (2003) Market information in life cycle assessment. Environmental Project no. 863, Miljøstryrelsen. Danish Environmental Protection Agency, Copenhagen.http://www.mst.dk/udgiv/ publications/2003/87-7972-991-6/pdf/87-7972-992-4.pdf