R E S E A R C H
Open Access
Multiple-true-false questions reveal more
thoroughly the complexity of student
thinking than multiple-choice questions: a
Bayesian item response model comparison
Chad E. Brassil and Brian A. Couch
*Abstract
Background:Within undergraduate science courses, instructors often assess student thinking using closed-ended question formats, such as multiple-choice (MC) and multiple-true-false (MTF), where students provide answers with respect to predetermined response options. While MC and MTF questions both consist of a question stem followed by a series of options, MC questions require students to select just one answer, whereas MTF questions enable students to evaluate each option as either true or false. We employed an experimental design in which identical questions were posed to students in either format and used Bayesian item response modeling to understand how responses in each format compared to inferred student thinking regarding the different options.
Results:Our data support a quantitative model in which students approach each question with varying degrees of comprehension, which we label as mastery, partial mastery, and informed reasoning, rather than uniform random guessing. MTF responses more closely estimate the proportion of students inferred to have complete mastery of all the answer options as well as more accurately identify students holding misconceptions. The depth of instructional information elicited by MTF questions is demonstrated by the ability of MTF results to predict the MC results, but not vice-versa. We further discuss how MTF responses can be processed and interpreted by instructors.
Conclusions:This research supports the hypothesis that students approach MC and MTF questions with varying levels of understanding and demonstrates that the MTF format has a greater capacity to characterize student thinking regarding the various response options.
Keywords:Assessment, Bayesian analysis, Item response theory, Mixed conceptions, Multiple-choice, Multiple-true-false, Question format, Undergraduate
Introduction
While assessment instruments have been used com-monly in undergraduate science education to measure student achievement for the purposes of assigning grades, these instruments can also play a formative role in the learning process (Angelo, 1998; Handelsman, Miller, & Pfund, 2007). In particular, formative assess-ment provides an opportunity for students to practice answering questions, gives instructors information they can use to alter their teaching, and creates opportunities
for students to receive feedback on their progress (Black & Wiliam, 2009; Ericsson, Krampe, & Tesch-romer, 1993). Given that instructors often infer student under-standing based on aggregate responses to individual questions, assessment items must provide accurate infor-mation that can be used to diagnose and give feedback to students with respect to specific conceptions.
When designing an instrument or activity, assessment developers choose a question format (i.e., item type) that meets their needs while considering various practical constraints, such as limited assessment time and grading resources. In many cases, instructors use closed-ended formats where students select from a predetermined list
© The Author(s). 2019Open AccessThis article is distributed under the terms of the Creative Commons Attribution 4.0 International License (http://creativecommons.org/licenses/by/4.0/), which permits unrestricted use, distribution, and reproduction in any medium, provided you give appropriate credit to the original author(s) and the source, provide a link to the Creative Commons license, and indicate if changes were made.
* Correspondence:[email protected]
of response options. Multiple-choice (MC) questions represent a common closed-ended format used through-out undergraduate science education (Eagan et al., 2014). By having students select a single correct answer among a list of plausible distractors, MC questions pro-vide an estimate of how many students endorse correct versus incorrect ideas. The MC format has been employed in a wide variety of contexts, from low-stakes daily activities to high-stakes assessments determining professional advancement. Education researchers have also developed tools that employ MC questions for for-mative purposes. For example, MC “clicker” questions serve as in-class check-ins that can facilitate student dis-cussion and provide real-time feedback to inform in-structional decisions (Crouch & Mazur, 2001; Hubbard & Couch,2018; Vickrey, Rosploch, Rahmanian, Pilarz, & Stains, 2015; Wood, 2004). Similarly, numerous MC research-based assessments (RBAs) and concept inven-tories have been developed to help instructors diagnose student understandings and guide larger-scale changes to curriculum and instruction (e.g., Hestenes, Wells, & Swackhamer,1992; Smith, Wood, & Knight,2008).
Despite the widespread use of the MC format, research into student mental models has exposed potential limita-tions of MC queslimita-tions. Students often have mixed and incoherent understandings of natural phenomena, mean-ing that they can simultaneously hold both correct and incorrect ideas regarding particular concepts (Nehm & Reilly, 2007; Nehm & Schonfeld, 2008). This presents a problem for the MC format because students who select the correct answer may still consider one or more of the distractors to also be correct (Parker et al., 2012). In light of this issue, some assessment developers have adopted multiple-response formats that allow students to evaluate each response option (Kalas, O’Neill, Pollock, & Birol,2013; Newman, Snyder, Fisk, & Wright,2016).
Multiple-true-false (MTF) questions represent a multiple-response format that retains the question stem and response option structure of MC questions but re-quires students to separately mark each option as true or false, rather than selecting one correct option. Early work in comparing MC and MTF questions focused on quantifying reliability, difficulty, and the amount of time needed to complete questions (Dudley, 2006; Frisbie, 1992; Haladyna, Downing, & Rodriguez, 2002; Javid, 2014). In general, the MTF format yields superior in-ternal test reliability determined by coefficient alpha, even when accounting for item number and test dur-ation (Couch, Hubbard, & Brassil,2018; Frisbie & Swee-ney, 1982; Kreiter & Frisbie, 1989). While students are known to employ test-taking strategies (e.g., option length comparisons, option elimination) for MC ques-tions (Ellis & Ryan, 2003; Kim (Yoon & Goetz, 1993; Stenlund, Eklöf, & Lyrén, 2017), less is known about
how students approach MTF questions. Studies produce conflicting results with respect to how response patterns differ based on being asked to only endorse true state-ments versus being asked to also mark false statestate-ments (Cronbach,1941; Pomplun & Omar,1997). Recent work has highlighted how MTF questions reveal the preva-lence of mixed and partial understandings among stu-dents, even within upper-division courses consisting mostly of graduating seniors (Couch, Wood, & Knight, 2015; Parker et al.,2012).
To understand the effects of question format on stu-dent responses, members of our research team previ-ously conducted a within-subjects controlled experiment where similar groups of students answered identical questions in either the MC or MTF format (Couch et al., 2018). On average, nearly half of the students who cor-rectly answered a MC question likely would have en-dorsed one or more of the remaining distractors, if given the opportunity. The MC format underestimated the proportion of students who would have endorsed the correct answer as well as each incorrect distractor in the MTF format. These findings collectively suggested that the MC format systematically misrepresents student thinking by failing to reflect the partial understandings that most students hold regarding the various response options. This has implications when using the MC for-mat for forfor-mative and diagnostic purposes because it could lead instructors and students to make instruc-tional decisions based on incomplete or inaccurate information.
While initial analyses suggested that MTF questions reveal partial understandings otherwise obscured by the MC format, these results warranted further investigation to understand how students process the two question formats and address alternative explanations for previ-ous results. A major difference between the MC and MTF formats lies in their putative guess rates. When students engage in uniform random guessing, each MC option will be selected roughly 25% of the time, whereas each MTF statement will be endorsed 50% of the time. Thus, the previous finding that students endorse both correct and incorrect statements more in the MTF for-mat than the MC forfor-mat could be partially explained by the different guess rates. Further, the MTF format could have induced acquiescence bias, where students system-atically tend to mark true for MTF statements, leading to inflated endorsement rates based on non-content rea-sons (Cronbach,1941). Finally, the presence of weak dis-tractors could have led the MC format to overestimate question mastery because adequate alternatives were not presented to attract students with partial understandings.
response theory (IRT) models person ability and item parameters (i.e., difficulty, discrimination, and pseudo-guessing) based on student responses across an instru-ment (de Ayala,2008). When applied to MC questions, IRT typically considers responses as dichotomous correct/incorrect variables, and thus, does not provide insights on student thinking regarding the various re-sponse options. However, polytomous rere-sponses from MC option selections can be incorporated into IRT models, known as nominal response models, enabling one to estimate the probability of a student selecting a particular response option based on a student’s overall ability level (Bock, 1972). This approach can lead to more accurate person ability estimates (Baker & Kim, 2004; Briggs, Alonzo, Schwab, & Wilson, 2006) and more refined information regarding the relative attractive-ness of the different response options for students at dif-ferent ability levels (Bolt, Cohen, & Wollack, 2001; Thissen, Steinberg, & Fitzpatrick, 1989). However, since the MC format intrinsically depends on students selecting only one answer, this approach requires modification for use with MTF questions, where students separately evalu-ate each response option associevalu-ated with a question stem.
We sought to develop a response model that could simultaneously be applied to both MC and MTF ques-tions to understand how student thinking becomes manifest in responses to each format. We developed a variant of a Bayesian item response model that included MC and MTF responses, incorporating information on how students responded to each option. In part, our model represents a reparameterization of a traditional IRT model. Terms such as item difficulty and discrimin-ation map onto particular IRT parameters and also frame an implied interpretation of student cognitive pro-cessing. We utilize the unique nature of our paired, ex-perimental questions to develop a model that can be derived from IRT parameters, such as item difficulty, but that ultimately parameterizes new terms. These new terms frame the interpretation of our analysis in terms of student understanding with respect to different response options. Consequently, these terms imply a different cognitive model of student processing that can guide instructors in considering specific student misconceptions.
In developing this model, we wanted to understand how student responses varied with respect to specific questions, rather than focusing on how well each format estimates overall student ability levels. Specifically, we aimed to address several related research questions.
How well do MC and MTF response rates
approximate the proportion of students that have complete, partial, or little understanding of the response options?
To what extent do MC and MTF responses reflect
random guessing?
To what extent can responses for each format be
used to predict responses to the other format? What is the potential utility of MC, as compared to
MTF, to reveal student question mastery, even with different distractor characteristics?
How should MTF responses be processed and
interpreted by educators in light of the model?
In answering these questions, we sought to generate practical insights that instructors can follow to use closed-ended assessments in a manner that best captures the complexity of student thinking.
Methods
Experimental design
The current analyses utilize a previously reported dataset (Couch et al., 2018) but do not overlap with this previ-ous publication. Briefly, we implemented a crossover ex-perimental design within four unit exams of an introductory biology course. Our question development aligned with typical instructor construction and inter-pretation of unit exams, where questions do not undergo
For an individual MC × MTF question, the MC response options and corresponding MTF statements appeared in an identical order on exams. Across the dif-ferent MC × MTF questions, the position of the correct/ true option varied in a semi-random fashion, such that each of the four answer positions received roughly equal representation. For the purpose of data analysis and presentation, the response options have been reordered: the first option corresponds to the correct/true option and the remaining incorrect/false options are ordered sequentially according to their average selection/en-dorsement rates, with the most frequently selected dis-tractor coming first and the least frequently selected distractor coming last. Thus, the correct response to MC questions will be A, and options B–D will represent the distractors in order of decreasing selection/endorse-ment rates. MTF question responses will be represented by a four-digit code, corresponding to answers to each of the four statements. For example, a fully correct an-swer will be represented by TFFF, meaning that the stu-dent correctly answered true for the true statement and correctly answered false for the three false statements.
A total of 194 students consented to have their exam data released for research purposes, representing 78% of total course enrollment. Student data was included in the data set on an available case basis (i.e., students who missed one or more exams typically due to course with-drawal still had their available data included). All student data was analyzed at once after the semester; we did not separately analyze the data for each exam. Students had a raw average of 72 ± 13% SD across the four exams, in-cluding the other non-experimental questions. Add-itional file 1: Supplementary Material 1 provides a summary of student demographic characteristics. This research was classified as exempt from the Institutional Review Board review, Project ID 14314.
Analyses
A Bayesian approach to modeling student responses (Fox, 2010) allowed us to construct a model of student thinking and utilize that model to compare the two question formats. Our response model builds on the idea that students have certain incoming understandings of the various response options when they encounter an experimental exam question. These understandings are then translated into specific responses depending on the format of the question. In the process of model con-struction, we formulated latent (i.e., not directly ob-served) parameters describing student approaches, and we calculated a set of shared parameters for each MC × MTF question to simultaneously predict aggregate population-level student response probabilities in both formats. At the same time, we accounted for differences in individual student performance, a hierarchical feature
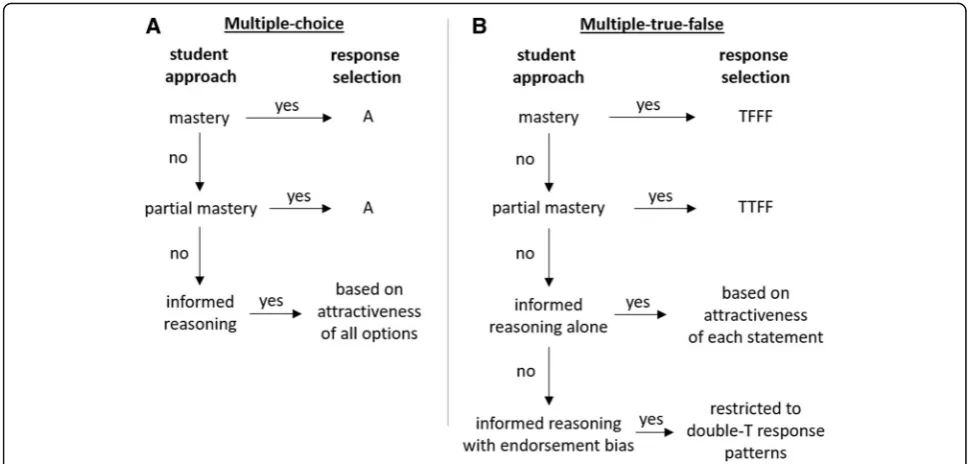
of the data for which a Bayesian approach is well suited when used in combination with a structured model. In our case, the utility of priors was not a motivating feature of a Bayesian approach. Therefore, weak, or vague, priors were utilized throughout, essential in elim-inating the influence of priors in this analysis. The repeated measures aspect of the data in which each stu-dent answers multiple questions was accounted for when we included a student ability parameter (see individual student performance, as described below). We fit the best parameters for alternative models and compared the fit of each model to the empirical data. In the best-fit model, students process questions via a decision tree involving mastery, partial mastery, informed reason-ing, and endorsement bias (Fig. 1). Additional file 1: Supplementary Material 2 includes a mathematical description of the Bayesian model for the most sup-ported model.
Mastery
The mastery component modeled the proportion of stu-dents that had correct understandings of all the response options and therefore provided a fully correct response in either format (i.e., they answered A for the MC for-mat or TFFF for the MTF forfor-mat). While all students with mastery answered A or TFFF, not all students with these responses fell under mastery because some stu-dents may have arrived at fully correct answers via an-other approach (i.e., partial mastery or informed reasoning, as described below). Mastery was a latent variable inferred based on student responses (i.e., it was not determined using an external tool) and limited to the context of the particular statement options in each question. While this definition of mastery has limitations for extrapolation beyond the statement options, it is ap-propriately used as a comparison metric between the two formats within this study.
Partial mastery
answered A or TTFF, not all students with these responses fell under partial mastery because they may have arrived at these answers via another approach (i.e., informed reasoning, as described below).
Informed reasoning based on option attractiveness Students that did not have either mastery or partial mas-tery were modeled as using informed reasoning to choose a response based on the underlying attractiveness of the various response options/statements. Attractive-ness values, latent variables in the model, were estimated for each option/statement, representing the independent probability of endorsing each option/statement. On a pedagogical level, attractiveness values provide insights into the degree to which struggling students were in-clined to select/endorse the various options and, there-fore, the degree to which students consider distractors as valid concepts.
In the MTF format, the probability that a student using informed reasoning would endorse a statement as being true was calculated as the attractiveness of that option. Thus, the probability of selecting a particular an-swer pattern for a MTF question was the product of the associated attractiveness values for the four individual
statements. For the MC format, the probability that a student using informed reasoning would select a particu-lar option was based on the probabilities of the four different MTF answer patterns specifying singular en-dorsement of each option (i.e., TFFF, FTFF, FFTF, and FFFT corresponding to A, B, C, and D, respectively). The probability of selecting a particular MC option was calculated as the probability of that particular response pattern divided by the sum of all four single-T probabil-ities (see Additional file1: Supplementary Material 3 for further description).
Informed reasoning with MTF endorsement bias
Within the MTF format, we also recognized that stu-dents may have tendencies to endorse certain answer patterns instead of considering each statement inde-pendently from other statements. Students operating under double-T endorsement bias still weighed the vari-ous statements according to their underlying attractive-ness values but had a bias to select among the answer patterns containing two true answers (i.e., TTFF, TFTF, TFFT, FTTF, FTFT, or FFTT) above that expected based on attractiveness alone. In the first alternative structure, students operating under multi-T bias favored response
patterns containing two or more true answers. In the second alternative structure, rather than calculating double-T bias for each question, a double-T bias value was calculated for each student based on the hypothesis that each student may have their own intrinsic tendency for this bias.
Note, the model structure for endorsement bias was superficially similar to partial mastery in that students were restricted to a subset of all the possible answer per-mutations. However, endorsement bias applies to those students engaged in informed reasoning with the correct answer being weighed against other options. In contrast, partial mastery describes students with not only a fined understanding of the correct answer, but also a de-fined misunderstanding of a distractor.
Random guessing
We tested an additional component to account for ran-dom guessing. Students engaged in ranran-dom guessing were modeled as having a 25% probability of selecting each MC option and a 50% chance of selecting true for each MTF statement (i.e., uniform random). In one case, random guessing was an alternative to informed reason-ing. In another case, random guessing was modeled in addition to informed reasoning (i.e., students not in mastery, partial mastery, or informed reasoning were modeled to be engaged in random guessing).
Individual student performance
We included an additional individual student perform-ance parameter to account for differences in the particu-lar sample of students taking each question version. Each individual student performance parameter was based on the extent to which they demonstrated mastery across all the questions. The probability of a student answering a particular question via mastery was thus modeled based on the mastery level of the question as well as the student’s individual performance across all questions.
Relationship to IRT models
We developed a specifically structured polytomous item response model. In terms of a traditional binary item response model, our model maps onto the equivalent of a one-parameter logistic model, or Rasch model (Rasch, 1960). The item difficulty is the negative of the question mastery parameter (−ui), and we model the ability level for each individual (vj). We did not include the discrim-ination parameter from a two-parameter logistic model because our interest is not in determining an individual, assessment-level ability. Rather, our interest is in con-trasting these two question formats in their ability to provide information on the item difficulty and on the attractiveness of options for individual questions. We
included a structure accounting for informed reasoning, which is similar to but provides richer information than the pseudo-guessing parameter of the three-parameter logistic model. We model a complex polytomous sponse and construct a unique model relating MC re-sponses to MTF rere-sponses with a common set of parameters. Therefore, our model is a derived version of IRT, specifically structured for our comparison between these question formats. Our data consists of the joint re-sponses across all students and across both formats of the question.
Model fit
The above structures were each modeled at the question level. The independent variables were the question for-mat being answered and the student answering. The response variable in all models was the selection of a MC option or selection of true or false for the four MTF statements for each question by each student. All pa-rameters with the exception of question-level mastery were modeled hierarchically (i.e., by fitting mean and dispersion parameters for the entire question distribu-tion from which individual quesdistribu-tion values were drawn). In mixed-models parlance, this equated to considering these parameters as “random effects.” Question-level mastery was fit independently for each question (i.e., as a“fixed effect”). This decision was informed by prelimin-ary analyses indicating that mastery levels were fairly uni-formly spread, while the values of other question-level parameters clustered into distributions (Additional file1: Supplementary Material 4).
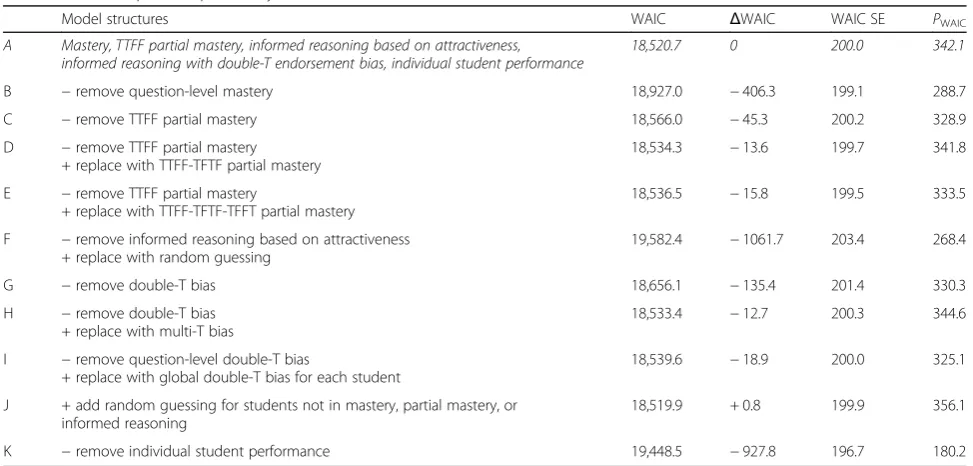
To justify the inclusion of each structure, model comparisons were made using a Watanabe–Akaike in-formation criterion (WAIC), a recently recommended Bayesian analog to AIC (Gelman, Hwang, & Vehtari, 2014; Vehtari, Gelman, & Gabry, 2017). The best-fit model was compared with and without each parameter structure, resulting in nested models. Components were retained when their absence increased WAIC by more than 2, a suggested threshold for model comparison (Gelman et al., 2014). For nested models, a decrease in WAIC of less than 2 was assumed to be consistent with a component of little to no real effect and therefore dropped for parsimony. Models were also compared with non-nested, alternative structures, and the structure that provided the largest WAIC decrease was selected for model inclusion. To be clear, the structure of the most supported model is derived from the data and not a single a priori hypothesis. However, the structures are based on potential types of student processing, and our analysis is consistent with multi-model inference (Burn-ham & Anderson,2002).
fit. Non-informative, uniform priors were used for all pa-rameters with beta distributions (α= 1 andβ= 1 for those having probabilities constrained between 0 and 1). Half-Cauchy priors (Gelman, 2006) were used as weak-information priors (σ= 2.5) for the dispersal param-eter of the hierarchical probability values (i.e., the distribu-tions from which the question-level values were drawn). Weak-information normal priors (centered at the mean with a standard deviation = 2) were used for mastery parameters, which were themselves components in a logit link function (Additional file 1: Supplementary Material 2). Model parameterization was conducted using the pro-gram Stan in R with the package rstan (Stan Development Team,2017). Model comparison via WAIC was calculated in R using the package loo.
Results
Model identification
By comparing the fit statistics for various model permu-tations, we arrived at a best-fit model that included structures for mastery, partial mastery, informed reason-ing based on option attractiveness, informed reasonreason-ing with endorsement bias, and individual student perform-ance (Table1, model A). Comparisons among alternative structures enabled us to understand student response tendencies. The most supported model provides a hier-archical and probabilistic representation of how students processed MC and MTF questions (Fig. 1). The param-eter distributions for the various paramparam-eters were consist-ent with either the hierarchical or independconsist-ent nature of
each component (Additional file1: Supplementary Material 4). The best-fit model also produced reasonable posterior predictive checks in which computed values were com-pared to observed response data.
With respect to alternative model structures, students with partial mastery were best modeled as selecting TTFF (Table1, model A), rather than alternative models in which these students correctly selected true for the true statement and also selected true for any one of the two most attractive false statements (model D) or any one of the three false statements (model E). These find-ings support the notion that some students had an un-derstanding of three out of four response options, but they held a misconception regarding the most attractive distractor. For most questions, partial mastery made lit-tle contribution, but for roughly seven questions, partial mastery enabled a sufficiently better fit to warrant reten-tion in the final model (Addireten-tional file1: Supplementary Material 4).
Students without mastery or partial mastery were best modeled as engaging in informed reasoning based on statement attractiveness. This structure was the most strongly supported of any element in the model in that replacing it with random guessing resulted in the largest WAIC increase (model F). While some students within this group selected answers based solely on their attract-iveness, we also tested structures in which students en-gaged in informed reasoning biased their responses toward patterns with two true answers (double-T endorsement bias) or multiple true answers (multi-T
Table 1Support for model structures. Model A was the best-supported model in italics. Changes in structures from model A are indicated. The differences in WAIC compared to model A were greater than 13 for all models, except model J. Given that model J was more complex, that model A was nested within model J, and that the WAIC difference was small (less than 2), the simpler model A was accepted for parsimony
Model structures WAIC ΔWAIC WAIC SE PWAIC
A Mastery, TTFF partial mastery, informed reasoning based on attractiveness, informed reasoning with double-T endorsement bias, individual student performance
18,520.7 0 200.0 342.1
B −remove question-level mastery 18,927.0 −406.3 199.1 288.7
C −remove TTFF partial mastery 18,566.0 −45.3 200.2 328.9
D −remove TTFF partial mastery
+ replace with TTFF-TFTF partial mastery
18,534.3 −13.6 199.7 341.8
E −remove TTFF partial mastery
+ replace with TTFF-TFTF-TFFT partial mastery
18,536.5 −15.8 199.5 333.5
F −remove informed reasoning based on attractiveness
+ replace with random guessing
19,582.4 −1061.7 203.4 268.4
G −remove double-T bias 18,656.1 −135.4 201.4 330.3
H −remove double-T bias
+ replace with multi-T bias
18,533.4 −12.7 200.3 344.6
I −remove question-level double-T bias
+ replace with global double-T bias for each student
18,539.6 −18.9 200.0 325.1
J + add random guessing for students not in mastery, partial mastery, or informed reasoning
18,519.9 + 0.8 199.9 356.1
endorsement bias). We found that double-T bias was more strongly supported than multi-T bias (model H). While the distribution of double-T bias values was closely clustered, there was stronger support for question-level bias values over student-level bias (model I). To further address the possibility of random guessing, we tested an additional model in which students without mastery, partial mastery, or informed reasoning engaged in random guessing (model J). For a nested model, WAIC did not decrease more than would be expected by chance alone, and so this structure was not included in the best-fit model. Thus, in no case did the random guessing structure provide sufficient explanatory power to warrant inclusion in the final, best-fit model.
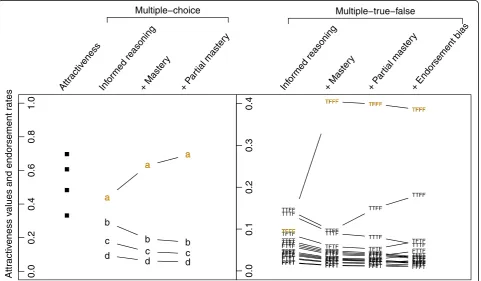
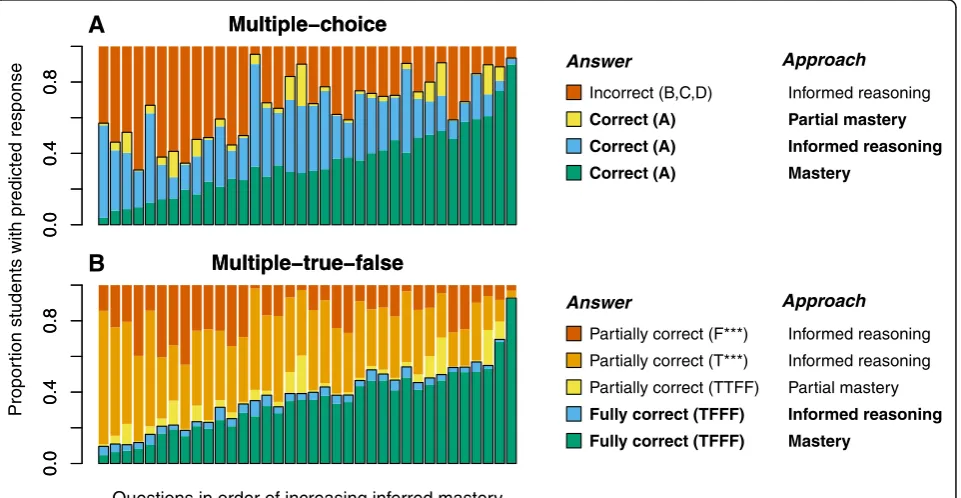
In summary, when considering how students proc-essed MC and MTF questions, a reasonable initial model would have been one in which all students engaged in informed reasoning based on option attractiveness. A joint attractiveness value for each response option/state-ment could have been estimated and converted into a predicted selection/endorsement probability in the MC and MTF formats (Fig. 2). In practice, this model pro-vides a poor approximation of observed student re-sponses, particularly underestimating the proportion of students that selected the correct (A) and fully correct
(TFFF) answers in the MC and MTF formats, respect-ively. Additional structures helped account for the prevalence of certain observed response patterns. In the MC format, mastery and partial mastery each typically increased the proportion of students predicted to answer correctly. In the MTF format, mastery typically raised the predicted number of fully correct responses (TFFF), and partial mastery increased the predicted partially correct TTFF responses. Double-T endorsement bias slightly suppressed predicted TFFF responses while ele-vating all the response combinations with two true an-swers. The addition of these structures brought predicted responses into closer alignment with observed response rates, consistent with the notion that each structure represented an approximation of how subsets of students approached the questions.
In the MTF format, the selection of TFFF is most strongly influenced by mastery and is generally robust to the consequences of partial mastery and endorsement bias (Fig. 2). Partial mastery and endorsement bias can have fairly large effects on the rate of students that choose TTFF. Thus, quantifying partial mastery is a key asset of the MTF format that cannot be recapitulated by MC questions. Endorsement bias, while generally small, does cloud fine-scale interpretation of distractors.
However, endorsement bias pulls students engaging in informed reasoning away from TFFF, distilling the selec-tion of TFFF as a more honest representaselec-tion of mastery.
Format comparison
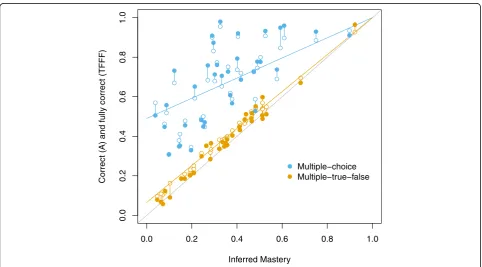
Calculating parameter values for each structure provided an estimation of the proportion of students that oper-ated according to a given structure for each question. Comparing observed student responses to these inferred values revealed the extent to which each format pro-vided raw answers that adequately captured inferred stu-dent approaches. To understand the degree to which each format identified students with complete under-standings of all the response options, we compared the rates at which students selected the correct response in the MC format or provided a fully correct answer in the MTF format to the inferred mastery level for each ques-tion (Fig. 3). We found that correct answer rates in the MC format overestimated inferred mastery to a large degree, and the degree of overestimation varied mark-edly among questions. Conversely, the fully correct re-sponse rate in the MTF format had close to a one-to-one relationship with inferred mastery levels.
The greater variation in MC questions could not be attributed to an unexplained error in the model (i.e.,
the inherent noise in choosing one out of four op-tions), since predicted response rates closely matched observed response rates. A good fit is illustrated for both MC and MTF formats, without major bias. The greater differences between the open (predicted) and closed (observed) values for the multiple choice format is simply a consequence of the inherent noise in a four-option MC response as opposed to an effectively 16-option MTF response pattern. Conversely, the vari-ance between MC correct responses and inferred mas-tery resulted from variance in the attractiveness of the response options comprising each question (i.e., some combinations of attractiveness values enabled the cor-rect option to more closely approximate inferred
mas-tery than other combinations). For example,
distractors with low attractiveness would lead most students using informed reasoning to choose the cor-rect answer in MC, whereas relatively even attractive-ness among distractors would result in students using informed reasoning to choose an incorrect answer in MC. In contrast, a fully correct MTF response pro-vided a more consistent estimate of inferred mastery because MTF answer patterns were not as heavily in-fluenced by the particular combination of statement attractiveness comprising each question.
To further understand how student answers corre-sponded to underlying question approaches, we visual-ized the proportion of students modeled as selecting each answer choice through a particular approach. In the MC format, some students selected the correct an-swer based on mastery, but many additional students also selected the correct answer based on partial mastery or informed reasoning (Fig.4a). Thus, students could ar-rive at the correct answer through three distinct ap-proaches. The mastery students chose the correct answer based on their correct understanding of all the options. The partial mastery students selected the cor-rect MC answer, but they would have incorcor-rectly en-dorsed the first distractor, if given the opportunity. The students using informed reasoning did not have cer-tainty regarding any of the statements, but they chose the correct answer based on a comparison of the relative merits of each option. Finally, students could arrive at theincorrectanswer through informed reasoning that in-volved comparing the attractiveness of the different an-swer options.
In the MTF format, student answers showed closer alignment with their approaches. Some students selected a fully correct answer based on mastery, while only a small proportion arrived at this answer pattern via
informed reasoning (Fig. 4b). Some students selected a partially correct answer based on either partial mastery or informed reasoning. These answer patterns better reflected their proportional understanding of the various statements. Partial mastery students correctly answered three out of four statements, while students using in-formed reasoning earned credit in a manner that ap-proximated their understanding of the four statements.
To contrast the differing information content in MC and MTF questions, we determined the extent to which responses from one format could predict response to the other format. Generally, the root-mean-square deviation (RMSD) of the data points from the one-to-one line was higher when MC data alone was used to estimate ob-served MTF statement endorsement rates (Fig.5a), while MTF data provided a much closer estimation of ob-served MC option selection rates (Fig.5b). Furthermore, for the comparison of MC statement a and MTF option a, which had similar RMSD, the use of MC data alone was biased (Piñeiro, Perelman, Guerschman, & Paruelo, 2008) in the prediction of MTF endorsement, as indi-cated by a significantly non-zero intercept (0.36,t= 5.99,
p< 0.0001) and a slope significantly different from one (−1.41, t=−5.23, p< 0.0001). Conversely, the use of MTF data alone accurately predicted the MC selection
A
B
rate, as indicated by an intercept that did not signifi-cantly differ from zero (0.002, t= 0.026, p= 0.98) and a slope that did not significantly differ from one (1.03,t= 0.253,p= 0.80).
Use of MTF format
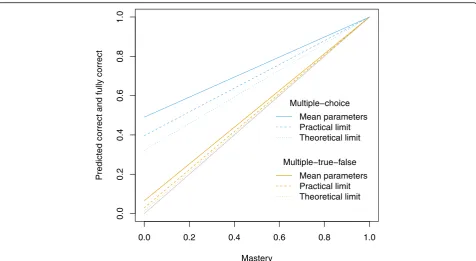
We also wished to understand theoretically how the re-lationship between MC correct responses and inferred mastery levels was affected by distractor characteristics. For students engaged in informed reasoning, the pres-ence of more attractive distractors might draw students away from the correct answer and reveal their limited understandings. This is illustrated in two calculations in
which the attractiveness values of the distractors were artificially changed (Fig. 6). In the first, all distractors were as attractive as the most attractive distractor (i.e., a practical limit), and in the second, the distractors were each as attractive as the correct option (i.e., a theoretical limit). While either of these conditions enabled MC cor-rect responses to better approximate inferred mastery levels, the relationship still lay far from the one-to-one line. Conversely, the relationship for MTF questions lays close to the one-to-one line in all cases.
Finally, while our model provided estimations of the proportion of students that processed questions via dif-ferent approaches, it would be impractical for an
A
B
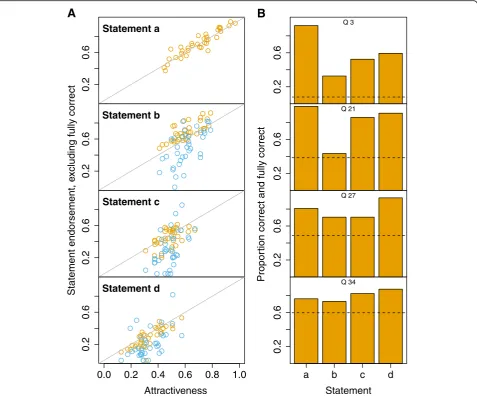
instructor to fit a complex Bayesian model for each exam. Thus, we aimed to determine how instructors could estimate the extent to which students had fully achieved the specified learning objectives (i.e., mastery) and to diagnose where remaining students had residual difficulties (i.e., statement attractiveness). For MC ques-tions, there was no way to use student responses to de-termine underlying mastery of all the question options because MC correct answer selection rates had an in-consistent relation to inferred mastery levels (see Fig. 3). Furthermore, MC selection rates for each answer option provided a relatively weak approximation of option attractiveness (Fig. 7a). For MTF questions, the propor-tion of students that gave a fully correct response (TFFF) correlated closely with inferred mastery levels (see Fig.3). The MTF endorsement rates among students who did not answer fully correct also provided better approxima-tions of the statement attractiveness values (Fig. 7a). In practice, endorsement bias had a very minimal effect on net endorsement rates per statement (Additional file 1: Supplementary Material 5).
Consequently, statement endorsement rates for MTF questions can be meaningfully processed by plotting the fraction of students correctly endorsing each statement, overlaid with a dashed line for the proportion of stu-dents answering fully correct (Fig.7b). We have included
processed results from four sample questions to illus-trate how instructors can use MTF questions to under-stand question performance and prioritize feedback (Fig. 7b). In the first question, very few students pro-vided a fully correct answer, indicative of low mastery levels. The students struggled with the false statements to varying degrees. For the second question, closer to half of the students provided a fully correct answer, while most of the remaining students incorrectly identi-fied the first false statement as true. For the third and fourth question, a high proportion answered fully cor-rect, but the remaining students struggled to identify the correct answer at various levels across the first three statements, including the true statement. In each case, the number of fully correct responses can serve as a close approximation of full student comprehension, while statement selection rates among the remaining students can help pinpoint areas where struggling stu-dents need additional support.
Discussion
How well do MC and MTF response rates approximate the proportion of students that have complete, partial, or little understanding of the response options?
With respect to ascertaining the degree of understand-ing, we found MC correct answers provided a poor
estimation of a student’s mastery of all the answer options. Indeed, the proportion of students answering a MC question correctly was substantially, but incon-sistently, higher than the level of inferred question mastery (Fig. 3). As a consequence, the MC format failed to detect the large fraction of students who se-lected the correct answer based on partial mastery or informed reasoning of the various answer options (Fig. 4). Granted, while it is impossible to quantify partial mastery from MC responses alone, the finding that a partial mastery structure explains MTF re-sponses demonstrates that MC questions inherently hide information on students inclined to simultan-eously ascribe support to the correct answer and an incorrect answer.
Conversely, the proportion of students that gave a completely correct MTF answer (i.e., TFFF) correlated closely with inferred mastery (Fig. 3), and very few stu-dents achieved complete correctness based on informed reasoning (Fig. 4). In short, this is because of the infor-mation potential embedded in an MTF question. The combined MTF response across four statements repre-sents one of 16 statement combinations, while an MC response can be only one of four outcomes. For students with incomplete understandings, MC selection rates pro-vided poor estimations of the independent attractiveness of each option, whereas MTF statement responses corre-lated more closely with statement attractiveness (Fig.7a). Taken together, these data provide compelling evidence that selection of the correct MC answer did not preclude
A
B
misunderstanding of other options. Rather, the MC format masked important layers of student thinking that the MTF format revealed.
To what extent do MC and MTF responses reflect random guessing?
One of the most salient differences between the MC and MTF formats stems from the different theoretical rates at which students are able to guess the correct answer. Contrary to common expectations, we found that purely random guessing was not broadly characteristic of stu-dent responses. Instead, stustu-dents with limited under-standings were better modeled as making selections based on some type of informed reasoning. The in-formed reasoning structure has similarities to the“ pseu-do-guessing” parameter from IRT, which specifies the probability at which low performing students will select the correct answer (Hambleton, Swaminathan, & Rogers, 1991). However, the informed reasoning structure has the additional benefit of accounting for mixed and partial understanding across options. This result also resonates with previous findings related to guessing be-haviors on closed-ended questions. Indeed, Cronbach (1941) concluded decades ago that “No guess is a com-pletely random response; even the student without knowledge consciously reacts to the tone and general character of the statement.”Similarly, a meta-analysis of the MC literature found that students typically select the fourth and fifth options (ranked by student endorsement rates) less than 5 % of the time and that removing these options has little effect on overall test reliability (Rodri-guez, 2005). This meta-analysis underscores the notion that the theoretical guess rate (Fig. 3) has limited rele-vance for MC questions because students can normally eliminate certain options.
Given the potential for random guessing to artificially inflate student scores, assessment developers have de-vised approaches to either decrease guessing behaviors or apply post hoc guessing corrections (Chiu & Camilli, 2013). For the MC format, test administrators often use formula scoring that discourages guessing by penalizing students for incorrect responses by an amount propor-tional to the number of answer options (Frary, 1988). This adjustment relies on the implicit assumption that a student who does not know the correct answer ran-domly chooses an option. Under this scoring scheme, students are advised to answer questions if they can eliminate at least one option and to leave questions blank if they have no knowledge of any of the options. By reducing the tendency to engage in random guessing, this scoring scheme has been shown to yield moderate increases in score reliabilities and validities (Alnabhan, 2002; Burton, 2002; Diamond & Evans, 1973). However, this method also introduces confounding variables
related to personality and risk-taking behaviors and fails to account for intermediate levels of understanding between fully correct and random guessing (Ávila & Torrubia,2004). Our results further call formula scoring into question on two levels. First, the finding that a ran-dom guessing term does not fit the model suggests that students rarely adopted this type of behavior in the given assessment context. Second, the finding that an appre-ciable number of students approach questions with either partial mastery or informed reasoning demon-strates that non-mastery students typically have some underlying knowledge or intuitions regarding a question.
To what extent can responses for each format be used to predict responses to the other format?
Correct MC responses were biased in predicting the proportion of students that endorsed the corresponding true statement in the MTF format. This was particu-larly manifest on challenging questions where observed MTF endorsement rates for true statements were higher than endorsement rates predicted by MC data alone (Fig. 5a, statement a). In other words, students were drawn away from selecting the correct option by a distractor in the MC format, but they were free to en-dorse the correct statement in the MTF format inde-pendent of the distractor.
Correct MC responses could not predict the rate of fully correct MTF responses, and the selection rates for MC distractors could not predict endorsement rates for false statements in the MTF format (Fig. 5a). MC ques-tions were particularly poor at capturing the extent to which students believe incorrect ideas, likely because this format forces students to select only one answer when they may believe more than one to be correct. Conversely, the MTF format enables students to separ-ately endorse each answer option, thus revealing student thinking in a manner that is less dependent on other op-tions. As a consequence, MTF answer patterns alone fairly accurately predicted the selection rates for both the cor-rect and incorcor-rect MC answers (Fig. 5b). Thus, from an instructional standpoint, MC responses had more limited informational content than MTF responses, particularly with respect to the incorrect/false distractors.
What is the potential utility of MC, as compared to MTF, to reveal student question mastery, even with different distractor characteristics?
the MC format, thus revealing their lack of complete un-derstanding. Our calculations not only illustrated how this could improve MC questions, but it also revealed the fundamental limitations of the MC format in com-parison to the MTF format (Fig. 6). This difference between formats reflected the problem that, even with highly attractive distractors, a substantial number of stu-dents would have selected the MC correct answer based on partial mastery or informed reasoning. These findings support the notion that—for questions with independent response options—the MC format will have an intrinsic inability to estimate mastery of all the answer options because the options have been reduced to a forced, non-independent selection process.
How can MTF responses be appropriately processed and interpreted by educators?
We propose the following scheme for processing MTF responses for instructors. First, the percent of students giving a fully correct answer can be calculated for each question stem. These students provide a close estimation of the students who have achieved question mastery and reflect the relative extent to which the question remains problematic. Then, the percent correct for each T/F statement can be calculated to determine where the remaining students are having difficulties. While this processing does not incorporate the statistical structure of the Bayesian model, it aligns closely with the statis-tical analysis while providing a relatively convenient way to parse assessment results according to two instructor goals. On one level, the instructor wants to know how many students have achieved mastery. On a second level, the instructor wants to know where students with-out mastery are still struggling in order to provide appropriate feedback.
Conclusions
When used for diagnostic purposes, the efficacy of closed-ended questions rests on the premise that selec-tion of predefined response opselec-tions can capture under-lying student thinking (Adams & Wieman, 2011). Building on our previous findings, we sought to address several research questions related to how MC and MTF questions reveal student understandings of the various response options. We chose to develop a variant of a Bayesian item response model because it enabled us to propose that certain types of student understanding exist within the population and simultaneously predict how these understandings become manifest in the MC and MTF formats. Our modeling took advantage of the crossover experimental design by fitting joint parameters for individual MC × MTF questions, which permitted us to test specific hypotheses regarding the relationship be-tween question format-independent understandings and
question format-dependent response tendencies. By comparing models with and without each model struc-ture and alternative strucstruc-tures, we were able to deter-mine the degree to which various latent student understandings and approaches were consistent with ob-served responses. Our analyses indicate that low per-forming students use informed reasoning based on option attractiveness but do not engage in uniform ran-dom guessing.
Our findings further support the notion that MC re-sponses provide limited insight into the degree to which students believe the various answer options, while the MTF format provides a more detailed way to capture varying degrees of understanding within an individual question. This work provides an empirically grounded perspective to help address the stated need for theory on the relationship between item formats and cognitive be-havior (Haladyna et al.,2002). In considering our results, it is important to note that our Bayesian analysis can only identify structures and parameters supported by the data. We must then interpret and align these with a given student processing approach. Given the inherent limitations of any forced-response format, there are add-itional layers of complexity that we cannot capture, such as the cognitive processes guiding informed reasoning (e.g., to what extent does statement attractiveness stem from underlying knowledge versus superficial item cues?). While the experimental questions compared in the Bayesian model were necessarily restricted to MTF questions with a single true statement, we have no rea-son to believe that this model of student processing would be substantially different for MTF questions with multiple true statements. We further note that the MTF format takes longer for a student to process than an equivalent MC question (Frisbie, 1992), but the moder-ate increase in time required is considerably outweighed by the several fold increase in response information provided.
range of concepts in a comparatively short time span as well as item generalizability by addressing a particular concept across multiple questions. Additional research is needed to determine the applicability of our findings to MC questions that have undergone a more thorough development process. Given the important role that research-based assessments have played in discipline-based education research (National Research Council (NRC), 2012), understanding the properties of different question formats represents an important step to the proper interpretation and use of assessment results.
Additional file
Additional file 1:Supplementary Material 1.Student demographics and overall course performance.Supplementary Material 2.
Mathematical description of the most supported model.Supplementary Material 3.Calculating the probability of selecting each multiple-choice option.Supplementary Material 4.Best-fit distributions from which model parameters were drawn.Supplementary Material 5.Influence of endorsement bias on results interpretation. (DOCX 61 kb)
Abbreviations
AIC:Akaike information criterion; IRT: Item response theory; MC: Multiple-choice; MTF: Multiple-true-false; RMSD: Root-mean-square deviation; WAIC: Watanabe–Akaike information criterion
Acknowledgements
We thank the University of Nebraska-Lincoln (UNL) discipline-based education research (DBER) community for critical research discussions. We are grateful to our colleagues who provided feedback on project design and manuscript revisions: Kathleen Brazeal, Tanya Brown, Mary Durham, Joanna Hubbard, Michelle Howell, and Kelly Lane. This work was supported by an internal award from UNL.
Funding
This work was supported by an internal award from UNL.
Availability of data and materials
Source data will be uploaded to Dryad once the manuscript is published.
Authors’contributions
BAC conducted data collection; CEB and BAC conceived of the analysis; CEB developed the model; CEB and BAC drafted and revised the manuscript. Both authors read and approved the final manuscript.
Competing interests
The authors declare that they have no competing interests.
Publisher’s Note
Springer Nature remains neutral with regard to jurisdictional claims in published maps and institutional affiliations.
Received: 27 March 2018 Accepted: 10 April 2019
References
Adams, W. K., & Wieman, C. E. (2011). Development and validation of instruments to measure learning of expert-like thinking.International Journal of Science Education, 33(9), 1289–1312.https://doi.org/10.1080/09500693.2010.512369. Alnabhan, M. (2002). An empirical investigation of the effects of three methods of handling guessing and risk taking on the psychometric indices of a test.
Social Behavior and Personality, 30, 645–652.
Angelo, T. A. (1998).Classroom assessment and research: An update on uses, approaches, and research findings. San Francisco: Jossey-Bass.
Ávila, C., & Torrubia, R. (2004). Personality, expectations, and response strategies in multiple-choice question examinations in university students: A test of Gray’s hypotheses.European Journal of Personality, 18(1), 45–59.https://doi. org/10.1002/per.506.
Baker, F. B., & Kim, S.-H. (2004).Item response theory: Parameter estimation techniques(2nd ed.). New York: Marcel Dekker.
Black, P., & Wiliam, D. (2009). Developing the theory of formative assessment.
Educational Assessment, Evaluation and Accountability, 21(1), 5–31.https://doi. org/10.1007/s11092-008-9068-5.
Bock, R. D. (1972). Estimating item parameters and latent ability when responses are scored in two or more nominal categories.Psychometrika, 37(1), 29–51.
https://doi.org/10.1007/BF02291411.
Bolt, D. M., Cohen, A. S., & Wollack, J. A. (2001). A mixture item response model for multiple-choice data.Journal of Educational and Behavioral Statistics, 26(4), 381–409.
Briggs, D., Alonzo, A., Schwab, C., & Wilson, M. (2006). Diagnostic assessment with ordered multiple-choice items.Educational Assessment, 11(1), 33–63.https:// doi.org/10.1207/s15326977ea1101_2.
Burnham, K. P., & Anderson, D. R. (2002).Model selection and multimodel inference: A practical information-theoretic approach(2nd ed.). New York: Springer-Verlag Retrieved fromhttps://www.springer.com/us/book/9780387953649. Burton, R. F. (2002). Misinformation, partial knowledge and guessing in true/false
tests.Medical Education, 36(9), 805–811.
Chiu, T.-W., & Camilli, G. (2013). Comment on 3PL IRT adjustment for guessing.
Applied Psychological Measurement, 37(1), 76–86.https://doi.org/10.1177/ 0146621612459369.
Couch, B. A., Hubbard, J. K., & Brassil, C. E. (2018). Multiple–true–false questions reveal the limits of the multiple–choice format for detecting students with incomplete understandings.BioScience, 68(6), 455–463.https://doi.org/10. 1093/biosci/biy037.
Couch, B. A., Wood, W. B., & Knight, J. K. (2015). The molecular biology capstone assessment: A concept assessment for upper-division molecular biology students.CBE-Life Sciences Education, 14(1), ar10.https://doi.org/10.1187/cbe. 14-04-0071.
Couch, B. A., Wright, C. D., Freeman, S., Knight, J. K., Semsar, K., Smith, M. K., et al. (2019). GenBio-MAPS: A programmatic assessment to measure student understanding of vision and change core concepts across general biology programs.CBE—Life Sciences Education, 18(1), ar1.https://doi.org/10.1187/ cbe.18-07-0117.
Cronbach, L. J. (1941). An experimental comparison of the multiple true-false and multiple multiple-choice tests.Journal of Educational Psychology, 32(7), 533. Crouch, C. H., & Mazur, E. (2001). Peer instruction: Ten years of experience and
results.American Journal of Physics, 69(9), 970–977.https://doi.org/10.1119/1. 1374249.
de Ayala, R. J. (2008).The theory and practice of item response theory(1st ed.). New York: The Guilford Press.
Diamond, J., & Evans, W. (1973). The correction for guessing.Review of Educational Research, 43(2), 181–191.
Dudley, A. (2006). Multiple dichotomous-scored items in second language testing: Investigating the multiple true–false item type under norm-referenced conditions.Language Testing, 23(2), 198–228.https://doi.org/10. 1191/0265532206lt327oa.
Eagan, K., Stolzenberg, E. B., Lozano, J. B., Aragon, M. C., Suchard, M. R., & Hurtado, S. (2014).Undergraduate teaching faculty: The 2013–2014 HERI faculty survey. Los Angeles: Higher Education Research Institute, UCLA Retrieved fromhttps:// www.heri.ucla.edu/monographs/HERI-FAC2014-monograph-expanded.pdf. Ellis, A. P. J., & Ryan, A. M. (2003). Race and cognitive-ability test performance: The
mediating effects of test preparation, test-taking strategy use and self-efficacy.Journal of Applied Social Psychology, 33(12), 2607–2629.https://doi. org/10.1111/j.1559-1816.2003.tb02783.x.
Ericsson, K. A., Krampe, R. T., & Tesch-romer, C. (1993). The role of deliberate practice in the acquisition of expert performance.Psychological Review, 100(3), 363–406. Fox, J. (2010).Bayesian item response modeling. New York: Springer.
Frary, R. B. (1988). Formula scoring of multiple-choice tests (correction for guessing).Educational Measurement: Issues and Practice, 7(2), 33–38.https:// doi.org/10.1111/j.1745-3992.1988.tb00434.x.
Frey, B. B., Petersen, S., Edwards, L. M., Pedrotti, J. T., & Peyton, V. (2005). Item-writing rules: Collective wisdom.Teaching and Teacher Education: An International Journal of Research and Studies, 21(4), 357–364. Frisbie, D. A. (1992). The multiple true-false item format: A status review.
Frisbie, D. A., & Sweeney, D. C. (1982). The relative merits of multiple true-false achievement tests.Journal of Educational Measurement, 19(1), 29–35.https:// doi.org/10.1111/j.1745-3984.1982.tb00112.x.
Gelman, A. (2006). Prior distributions for variance parameters in hierarchical models (comment on article by Browne and Draper).Bayesian Analysis, 1(3), 515–534. Gelman, A., Hwang, J., & Vehtari, A. (2014). Understanding predictive information
criteria for Bayesian models.Statistics and Computing, 24(6), 997–1016.
https://doi.org/10.1007/s11222-013-9416-2.
Haladyna, T. M., Downing, S. M., & Rodriguez, M. C. (2002). A review of multiple-choice item-writing guidelines for classroom assessment.Applied Measurement in Education, 15(3), 309–333.https://doi.org/10.1207/S15324818AME1503_5. Hambleton, R. K., Swaminathan, H., & Rogers, H. J. (1991).Fundamentals of item
response theory. Newbury Park: SAGE Publications, Inc.
Handelsman, J., Miller, S., & Pfund, C. (2007).Scientific teaching. New York: W. H. Freeman and Co.
Hestenes, D., Wells, M., & Swackhamer, G. (1992). Force concept inventory.The Physics Teacher, 30(3), 141–158.
Hubbard, J. K., & Couch, B. A. (2018). The positive effect of in-class clicker questions on later exams depends on initial student performance level but not question format.Computers & Education, 120, 1–12.https://doi.org/10. 1016/j.compedu.2018.01.008.
Javid, L. (2014). The comparison between multiple-choice (mc) and multiple true-false (mtf) test formats in Iranian intermediate EFL learners’vocabulary learning.Procedia - Social and Behavioral Sciences, 98, 784–788.https://doi. org/10.1016/j.sbspro.2014.03.482.
Kalas, P., O’Neill, A., Pollock, C., & Birol, G. (2013). Development of a meiosis concept inventory.CBE-Life Sciences Education, 12(4), 655–664.https://doi.org/ 10.1187/cbe.12-10-0174.
Kim (Yoon), Y. H., & Goetz, E. T. (1993). Strategic processing of test questions: The test marking responses of college students.Learning and Individual Differences, 5(3), 211–218.https://doi.org/10.1016/1041-6080(93)90003-B. Kreiter, C. D., & Frisbie, D. A. (1989). Effectiveness of multiple true-false items.
Applied Measurement in Education, 2(3), 207–216.
National Research Council (NRC). (2012).Discipline-based education research: Understanding and improving learning in undergraduate science and engineering. Washington, D.C.: National Academies Press.
Nehm, R. H., & Reilly, L. (2007). Biology majors’knowledge and misconceptions of natural selection.BioScience, 57(3), 263–272.https://doi.org/10.1641/B570311. Nehm, R. H., & Schonfeld, I. S. (2008). Measuring knowledge of natural selection:
A comparison of the CINS, an open-response instrument, and an oral interview.Journal of Research in Science Teaching, 45(10), 1131–1160.https:// doi.org/10.1002/tea.20251.
Newman, D. L., Snyder, C. W., Fisk, J. N., & Wright, L. K. (2016). Development of the Central Dogma Concept Inventory (CDCI) assessment tool.CBE-Life Sciences Education, 15(2), ar9.https://doi.org/10.1187/cbe.15-06-0124. Parker, J. M., Anderson, C. W., Heidemann, M., Merrill, J., Merritt, B., Richmond, G.,
& Urban-Lurain, M. (2012). Exploring undergraduates’understanding of photosynthesis using diagnostic question clusters.CBE-Life Sciences Education, 11(1), 47–57.https://doi.org/10.1187/cbe.11-07-0054. Piñeiro, G., Perelman, S., Guerschman, J. P., & Paruelo, J. M. (2008). How to
evaluate models: Observed vs. predicted or predicted vs. observed?
Ecological Modelling, 216(3), 316–322.https://doi.org/10.1016/j.ecolmodel. 2008.05.006.
Pomplun, M., & Omar, H. (1997). Multiple-mark items: An alternative objective item format?Educational and Psychological Measurement, 57(6), 949–962. Rasch, G. (1960). Probabilistic models for some intelligence and attainments tests.
Copenhagen: Danish Institute for Educational Research.
Rodriguez, M. C. (2005). Three options are optimal for multiple-choice items: A meta-analysis of 80 years of research.Educational Measurement: Issues and Practice, 24(2), 3–13.https://doi.org/10.1111/j.1745-3992.2005.00006.x. Semsar, K., Brownell, S., Couch, B. A., Crowe, A. J., Smith, M. K., Summers, M. M. et
al. (2019). Phys-MAPS: A programmatic physiology assessment for introductory and advanced undergraduates.Advances in Physiology Education, 43(1), 15–27.https://doi.org/10.1152/advan.00128.2018. Smith, M. K., Wood, W. B., & Knight, J. K. (2008). The Genetics Concept
Assessment: A new concept inventory for gauging student understanding of genetics.CBE-Life Sciences Education, 7(4), 422–430.https://doi.org/10.1187/ cbe.08-08-0045.
Stan Development Team. (2017). Stan modeling language users guide and reference manual, version 2.15.0 (version 2.15.0).http://mc-stan.org.
Stenlund, T., Eklöf, H., & Lyrén, P.-E. (2017). Group differences in test-taking behaviour: An example from a high-stakes testing program.Assessment in Education: Principles, Policy & Practice, 24(1), 4–20.https://doi.org/10.1080/ 0969594X.2016.1142935.
Summers, M. M., Couch, B. A., Knight, J. K., Brownell, S. E., Crowe, A. J., Semsar, K., et al. (2018). EcoEvo-MAPS: An ecology and evolution assessment for introductory through advanced undergraduates.CBE—Life Sciences Education, 17(2), ar18.https://doi.org/10.1187/cbe.17-02-0037.
Thissen, D., Steinberg, L., & Fitzpatrick, A. R. (1989). Multiple-choice models: The distractors are also part of the item.Journal of Educational Measurement, 26(2), 161–176.https://doi.org/10.1111/j.1745-3984.1989.tb00326.x. Vehtari, A., Gelman, A., & Gabry, J. (2017). Practical Bayesian model evaluation
using leave-one-out cross-validation and WAIC.Statistics and Computing, 27(5), 1413–1432.https://doi.org/10.1007/s11222-016-9696-4.
Vickrey, T., Rosploch, K., Rahmanian, R., Pilarz, M., & Stains, M. (2015). Research-based implementation of peer instruction: A literature review.CBE-Life Sciences Education, 14(1), es3.https://doi.org/10.1187/cbe.14-11-0198. Wood, W. (2004). Clickers: A teaching gimmick that works.Developmental Cell,