Surface Roughness Influencing Process Parameters &
Modeling Techniques for Four Stroke Motor Bike
Cylinder Liners during Honing: Review
A.B.N.Tripathi,
B.N.K. Singh,
C.U.K.Vates
A.B.N.Tripathi is Research Scholar, Deptt. of Mech. Engg., ISM Dhanbad India; [email protected]
B.Dr. N.K. Singh is Associate Professor (Workshop) Deptt. of Mech. Engg, ISM Dhanbad India;
C. U.K.Vates is Associate Professor & Head, Deptt. of Mech. Engg., AIMT, Greater Noida, India;
Abstract-- Series of attempt have been made to achieve the most influencing surface roughness (Ra) process parameters of
four stroke motor bike cylinder liner in honing operation. It is also evident that many of the modeling techniques have been used by different research, but Response Surface Methodology (RSM) has been worked out to give very robust model in honing process of the present investigation. RSM based artificial surface texture of bike cylinder liner was generated on a real surface measured with white light interferometer (WLI). It is the best surface measuring techniques used for the honed surface of steel liner. Honing angles between 25−75 degrees were investigated as an optimum condition to give the honed surface very smooth. Fractional factorial Design of Experiment has been used to get different set of experiment. Present studies aimed to find the most effective surface roughness process parameters as honing time, pressure, grit size of abrasive, honed fluids and quality of hone work pieces such as aluminum oxide, silicon carbide, ceramics and cubic boron nitride. The minimum surface roughness can be found by optimal parametric combinations.
Index Term-- RSM, Ra, WLI, ANOVA and FFDE.
INTRODUCTION
Honing is a fine finishing abrasive machining process with a multi-edge cutting tool of bonded grains under constant surface contact between tool and pre-machined components, which offers good geometrical tolerances (Kalpakjian and Schmid, 2003). It is a controlled, low speed sizing and surface finishing process in which stock is removed by the shearing and plugging action. The present study aimed to optimization of the cylinder liner surface roughness influence process parameters during honing. Many more honing processes and its influence parameters were frequently used by industries to perform honing of cylinder liner of four stroke petrol engine, but improvement further desire for more customer satisfaction. Selection of honing stone and grit size depends mainly on the desired rate of metal removal and the required surface finish. Abrasive material of the hone is chosen on the basis of the composition and hardness of the metal being honed and the finish required. The selection of a particular honing machine depends on the size and shape of the work piece, number of pieces to be honed, tolerance requirement,
availability of equipment, and availability of skilled workers. Honing provides a cost effective alternative to other finishing processes like grinding, lapping and super finishing (Leon, 2002). Surface finish of cylinder liner may be measured in terms of different scheme, but the more accurate reading may be observed by Atomic force microscope than other measuring techniques.
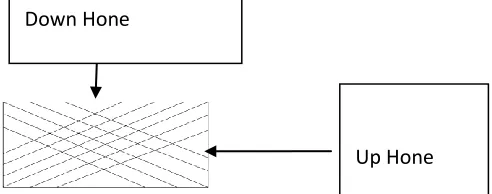
Fig. 1. Surface Texture with honed lines.
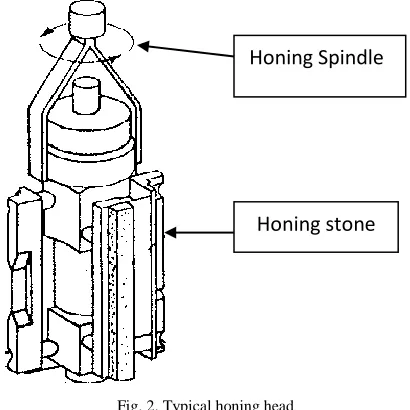
In Fig.1, arrows on the crosshatch show the directions of two perpendicular motions of the honing process. The surfaces of varying crosshatch angle are generated which affect the cycle average coefficient of friction. Friction decreases with decrease in crosshatch angle. On reducing the crosshatch angle from 90º to 20ºthe results reduces in a 25% in the cycle average of coefficient friction (Michail and Barber 1995, and Jocsak 2005). Kumar et al. (2006) described a random base surface roughness profile generated by crosshatch. They defined the surface profile by specifying the probability distribution of the surface heights and the auto correlation function. Fig. 2 is the three dimensional view of a typical hone tool used for honing an internal cylindrical surface. Honing sticks are fixed in the hone head which is connected to the spindle that imparts a rotational motion to the spindle. The concept of honing tool for cylinder liner is illustrated in Fig.2.
Down Hone
Fig. 2. Typical honing head
Feng and Wang (2002) developed empirical models through regression analysis to select cutting parameters in a turning operation on the basis of surface roughness. The empirical model was developed based on metal cutting experiments of factorial design. The various factors were considered as work piece hardness, feed, tool nose radius, spindle speed, and depth of cut. Two levels of each factor were used in the design of experiments. The range of the hardness, feed, nose radius, depth of cut and cutting speed which have been study were HRB 86, 0.254 - 0.102 mm/rev, 6.320 - 0.794 mm, 1.016 - 0.508 mm and 120 – 80 m/min respectively. Lin et al (2003) studied the machining forces and tool-wear relationship during cylindrical turning of an aluminum metal matrix composite using multiple regression analysis. A general equation involving machining conditions, machining forces, and tool wear was proposed. Cylindrical bars of 175 mm × 400 mm long diameter were turned on an infinitely variable speed control lathe. Polycrystalline diamond (PCD) inserts were used on the tool. The range of speed, feed, and depth of cut were 300 - 700 m/min, 0.1 - 0.4 mm/rev and 0.5 mm. Kwak et al. (2005) analyses the power expenditure and the surface roughness of the work piece during external cylindrical grinding of a hardened steel part using response surface methodology. A grinding wheel of diameter 320 mm and width 38 mm was used for conducting experiments on chrome-molybdenum steel which was heat-treated to Rc 60.
The factors considered as affecting the power output and surface finish included rotational speed of the work piece (rpm), depth of cut (µm), and the traverse speed (m/min). It was concluded that the predicted values of the grinding power and surface roughness coincide closely. Surface roughness measurement is required in the range of nanometer because of the fine finishing honing process. AFM is the one of the surface roughness measuring devices which able to measure up to level of nanometers as given in Fig.3.
Fig. 3. Atomic Force Microscope.
The optimum process parameters are essential to achieve better surface finish with adequate material removal rate (MRR). A lot of research techniques have been reported for response optimization but present review approach may achieve the improvement approx more than 28% in surface smoothness under AFM for honing process.
2. EXPERIMENTAL METHODOLOGY
2.1 Grit Size: The requirement of surface finish and rate of material removal are the key factors while selecting a particular grit size. Coarse grits remove high stock of material and are suitable for rough honing (Goetze and Burscheid, 1993). Table 3.2 shows the relationship between grit number and grit particle size (Boothryod and Knight, 1989).
Table I
Grit number and corresponding grit size used in honing
Grit No.
36 54 80 12
0 22 0
32 0
40 0
50 0
60 0 Size
(μm)
710 430 26 6
14 2
66 32 23 16 8
Selection of abrasive: Composition and hardness of the metal being honed and the finish required are the factors considered while selecting an abrasive. The individual grains are bonded together by the bond. Bond and grain make up the honing stone. The hardness of honing stone determines the resistance with which the bond counteracts the breakout of individual grains. The degree of hardness depends on the strength, the layer thickness of the bond between the individual grains and the size of the pore space. Different abrasives used to hone work pieces are aluminum oxide, silicon carbide, ceramics and cubic boron nitride.
Honing time:Honing time also affects the surface finish of the component. Initially surface finish is improved with time but beyond certain time of honing, it starts deteriorating.
The surface roughness Ra of the material may be measured precisely by using AFM surface roughness tester having least count 0.00005m for the travel length of 20 m. The same measuring samples with steep gradients on the surface, was encountered with the relatively steep sides of the honing grooves. The WLI was able to obtain more accurate heights of points on the slope. AFM measurements can have an
Honing Spindle
extremely high resolution compared to stylus profilometry or white light interferometers measurements, often even higher than the scanning electron microscope (SEM) technique. In several studies AFM measurements of a surface are considered the benchmark that other techniques are compared. AFM has been selected to precision measurement of surface of two type honed surfaces, for both result is being optimized with compared with stylus and WLI methods. The honed surface roughness has been given in Fig 4, which measured with AFM.
Fig. 4.The surface of cylinder liner after glide honing and laser honing
2.2Effect of honing parameters on surface finish
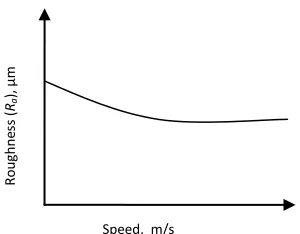
Honing Speed (Vc): As shown in Fig.5, increase in peripheral
speed decreases the value of the surface roughness parameter Ra if other parameters are kept constant.
Honing pressure: Insufficient pressure results in a sub-normal rate of material removal whereas excessive pressure causes increased surface roughness. Abrasives are broken fast in case of excessive pressure, which decreases productivity due to downtime required for replacing stones. Fig.6 shows that increase in pressure initially decreases the roughness but after a certain point, surface finish is not improved.
Honing Fluids: Honing fluids promote cutting action of the hone and prevent it from loading and glazing. Use of a coolant minimizes dimensional inaccuracy through control of work piece temperature on the work-piece. It is more critical in honing than other metal cutting operations. Viscous fluids cause a soft bonded abrasive to lose efficiency and generate heat due to friction.
Honing time: As shown in Fig.7, if the honing time is increased, keeping all the technological factors constant, the surface roughness is decreased in the initial stages. But beyond a certain limit if honing time is further increased, surface roughness is increased.
3 HISTORICAL PERSPECTIVES
The cylinder walls are stressed mechanically by high gas pressure and side thrust of the piston, as well as thermally due the high gas temperatures. Since all these stress induced factors are cyclic in nature, the cylinder liner materials must have good mechanical and fatigue strength, otherwise cylinder bore distortion or early material fatigue failure may take place. Liner assembly stresses are also very high and should not be ignored. They are greater than the firing stresses and the stress due to piston slap. In addition, the tribological properties such as wear and scuff resistance must also be satisfactory because metal-to metal contact between the piston rings and the cylinder liner do occur. However, present review concluded to desirable properties cannot be found in a single material. “Trade-off” between the mechanical and tribological properties must be considered during the selection of the
R
o
u
gh
n
ess
(
Ra
),
µ
m
Time, s
Fig. 7. Effect of honing time on surface roughness (Ra)
Ro
u
gh
n
es
s
(
Ra
),
µ
m
Pressure, N/m2
Fig. 6. Effect of pressure on surface roughness (Ra) P
R
o
ug
hne
ss
(
Ra
),
µ
m
Speed, m/s
appropriate liner material based on the application requirements.
Grey cast iron is widely used as liner material for heavy-duty diesel engines. Three methods to improve the wear resistance of grey cast iron liner are: adding special alloy elements, using surface treatment technique such as induction hardening, gas nit riding, and applying surface coatings. Induction hardened liner and special alloy grey cast-iron liners offer better wear resistance with new and used oil as compared to grey cast iron liners. The preparation of the surface of cylinder bore is a multistage process. Surfaces are typically machined in two steps. First, a rough honing gives the right cylinder city, and engraves deep valleys on the surface (up to 10μm deep).Second, a finish-honing step, also called plateau honing, gives a relatively smooth surface to the plateau. After running in an engine for a relatively short time, a normally honed liner will exhibit a surface profile similar to a plateau honed liner. However, the large number of wear debris generated during the running-in period may damage the engine severely as they act as abrasive particles and get embedded in the liner surface. Plateau honed surface is relatively stable in terms of wear. Therefore, it is thought that initial wear can be controlled by building it into the liner during the manufacturing process thereby relieving the engine of the burden of large initial wear and its associated debris. During the later part of life of the liner, the plateau surface would continue to possess relatively large, smooth plateau, which provide a large bearing area, deep valleys to retain oil for lubrication between the surfaces and provide a relief area for wear particles. Tim Hegemir et al. Examined the effect of plateau honing on both rough and smooth liners and found that smooth plateau liner (Ra) = (0.78μm) offers the best finish with regard to oil consumption, ring wear, liner wear between the ring turnarounds, and volume of liner material lost due to wear. The wear of liner is different at thrust side and anti thrust side and also it is different over the stroke length. Higher wear takes place at TDC in a cylinder liner and there is measurable wear all over the stroke length. It can be seen in Fig 8, higher wear takes place on the anti- thrust side compared to the thrust side.
Fig. 8. Diagram of Typical Cylinder Liner Wear
The piston rings are main cause of wear rather than piston skirt. At TDC, presence of boundary lubrication regime is a major contributor to wear along with other factors, which include: highest contact pressures, thinnest lubricating films, high temperatures, and greatest concentration of acids. The film thickness at the TDC was found to be very small, in the range of 0-30μm, because of the low sliding velocity and high temperatures at this location. The maximum oil film thickness was found at the mid-stroke region because of hydro-dynamic lubrication regime and maximum piston speed. Thus piston rings move in both hydrodynamic and boundary lubrication regimes. Oil cleanliness has a significant effect on ring and liner wear. Used oils contain wear debris and oil degradation products, which may act as third body wear particles between the ring-liner interface, thus accelerating the wear of both ring and liner surfaces. Third body wear particles and external contaminants, if any, can adhere to, or embed them into one material, and may cause grooves in the counter surface that can eventually result in progressive loss of material. The bearing length curve (Abbot’ s curve) is a very important parameter of the roughness profile. It is an important element in the evaluation of the actual contact area, because it defines an approximate value of the actual area between the specific rough surface and the ideal unreformed surface, depending on their proximity.
Cylinder bore surfaces, which show proper shape of Abbot’s curve and optimum surface roughness amplitude parameters ensure rapid running-in and significantly lower wear of the engine, as well as improved engine performance and lower oil consumption. Some roughness parameters can also be found out from Abbot’s curve. The points of maximum and minimum curvature are the limits of the characteristic regions of the curve, the region of individual peaks, the rough core region, and the region of deep scratches. At the flex point, the minimum slope of the curve over the whole region can be determined, which is very important with respect to friction and wear.
Fig. 10. Honed surface roughness, comparison
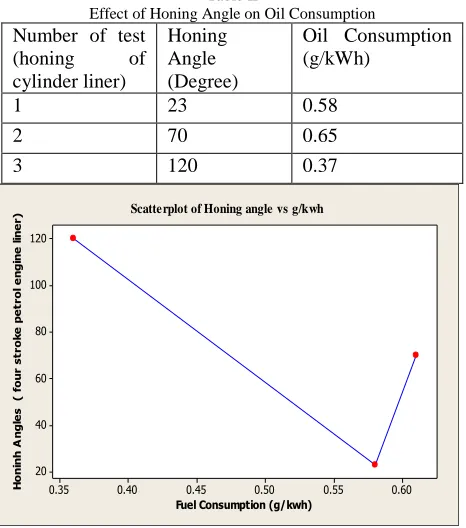
Honing surface is very important for the oil consumption of in the engine for the unit quantity of the power production.
Table II
Effect of Honing Angle on Oil Consumption
Number of test
(honing of
cylinder liner)
Honing Angle (Degree)
Oil Consumption (g/kWh)
1 23 0.58
2 70 0.65
3 120 0.37
0.60 0.55
0.50 0.45
0.40 0.35
120
100
80
60
40
20
Fuel Consumption (g/kwh)
H
o
n
in
h
A
n
g
le
s
(
f
o
u
r
st
ro
ke
p
e
tr
o
l e
n
g
in
e
li
n
e
r) Scatterplot of Honing angle vs g/kwh
Fig. 11. Scatter plot for the optimum honing angle
It has been concluded that fuel consumption may be optimize by reducing the honing angle during machining of cylinder liner.
C%
R
a
(
M
ic
r
o
n
s
)
3.0 2.9
2.8 2.7
2.6 2.1
2.0
1.9
1.8
1.7
1.6
> – – – < 2.0 2.0 2.2 2.2 2.4 2.4 2.6 2.6 Si%
Four stroke petro cylinderl liner:Grey cost Iron- Si% vs Ra, C%
Fig. 12. Surface plot for the optimum honing angle vs Ra
4. USE OF RESPONSE SURFACE METHODOLOGY
ANALYSIS IN SURFACE FINISHING
Feng and Wang (2002) developed empirical models through RSM analysis to select cutting parameters in a turning operation on the basis of surface roughness. The empirical model was developed based on metal cutting experiments of factorial design. The various factors considered were work piece hardness, feed, tool nose radius, spindle speed, and depth of cut. Two levels of each factor were used in the design of experiments. The range of the hardness, feed, nose radius, depth of cut and cutting speed used in the study were HRB 86, 0.254 - 0.102 mm/rev, 6.320 - 0.794 mm, 1.016 - 0.508 mm and 120 – 80 m/min respectively. Many more such honing and EDM process analysis have been utilized for the modeling of the surface roughness using RSM which gives better result than other.
As an important subject in the statistical design of experiments, the Response Surface Methodology (RSM) is a collection of mathematical and statistical techniques useful for the modelling and analysis of problems in which a response of interest is influenced by several variables and the objective is to optimize this response (Montgomery 2005). For example, the growth of a plant is affected by a certain amount of water x1 and sunshine x2. The plant can grow under any combination of treatment x1 and x2. Therefore, water and sunshine can vary continuously. When treatments are from a continuous range of values, then a Response Surface Methodology is useful for developing, improving, and optimizing the response variable. In this case, the plant growth y is the response variable, and it is a function of water and sunshine. First order can be expressed as For example: First order RSM
f
(
x
1,
x
2)
Find the levels of temperature (x1) and pressure (x2) to maximize the yield (y) of a process.
Second order
The RSM is important in designing, formulating, developing, and analyzing new scientific studying and products. It is also efficient in the improvement of existing studies and products. The most common applications of RSM are in Industrial, Biological and Clinical Science, Social Science, Food Science, and Physical and Engineering Sciences. Since RSM has an extensive application in the real-world, it is also important to know how and where Response Surface Methodology started in the history. According to Hill and Hunter, RSM method was introduced by G.E.P. Box and K.B. Wilson in 1951 (Wikipedia 2006). Box and Wilson suggested using a first-degree polynomial model to approximate the response variable. They acknowledged that model is only an approximation, not accurate, but such a model is easy to estimate and apply, even when little is known about the process (Wikipedia 2006). Moreover, Mead and Pike stated origin of RSM starts 1930s with use of Response Curves (Myers, Khuri, and Carter 1989). According to research conducted (Myers, Khuri, and Carter 1989), the orthogonal design was motivated by Box and Wilson (1951) in the case of the first-order model. For the second-order models, many subject-matter scientists and engineers have a working knowledge of the central composite designs (CCDs) and three-level designs by Box and Behnken (1960). Also, the same research states that another important contribution came from Hartley (1959), who made an effort to create a more economical or small composite design. There exist many papers in the literatures about the response surface models. In contrast, 3-level fractional design has limited works. Thus, 3-level fractional design is an open research subject. Fractional Factorial Experiment Design for Factor at 3-Levels (Connor and Zelen 1959) is a helpful resource conducting this kind of design. Many three-level fractional factorial designs and more importantly their alias tables can be found in their study. According to (Myers, Khuri, and Carter 1989), the important development of optimal design theory in the field of experimental design emerged following Word Elfving (1952, 1955, 1959), Chernoff (1053), Kiefer (1958, 1959, 1960, 1962), and Kiefer and Wolfowitz were some of the various authors who published their work on optimality.
One of the important facts is whether the system contains a maximum or a minimum or a saddle point, which has a wide interest in industry. Therefore, RSM is being increasingly used in the industry. Also, in recent years more emphasis has been placed by the chemical and processing field for finding regions where there is an improvement in response instead of finding the optimum response (Myers, Khuri, and Carter 1989). In result, application and development of RSM will continue to be used in many areas in the future.
3. Response Surface Methods and Designs
Response Surface Methods are designs and models for working with continuous treatments when finding the optima or describing the response is the goal (Oehlert 2000).
The first goal for Response Surface Method is to find the optimum response. When there is more than one response then it is important to find the compromise optimum that does not optimize only one response (Oehlert 2000). When there are constraints on the design data, then the experimental design has to meet requirements of the constraints. The second goal is to understand how the response changes in a given direction by adjusting the design variables. In general, the response surface can be visualized graphically. The graph is helpful to see the shape of a response surface; hills, valleys, and ridge lines. Hence, the function f (x1, x2) can be plotted versus the levels of x1 and x2.
5. CONCLUSION
Honing being a complex abrasive process, it is very difficult to develop an analytical model for predicting the effect of process parameters and product performance. So, empirical modeling is the only effective and practical means of analysis for honing process. In this review, a study on the influence of the most significant honing of four stroke petrol engine cylinder liner factors over surface roughness been carried out. Fractional factorial design of experiment has been found as more robust to conducting honing process on cylinder liner. The study has been made of surface roughness of Grey cast iron is widely used as liner material for four stroke petrol engines. Combination of the most surface roughness influencing parameters (Honing pressure, Honing Fluids, Honing Speed, Grit Size and Honing angles etc) may be applied for finding the optimum industrial application where it is needed. Therefore, RSM modeling technique is best fitted for the prediction of surface roughness and is able to successfully minimize Ra by 21.11% with 8.73% decrease in MRR during honing.
REFERENCES
[1] Bawa, H.S., (2004). Manufacturing Process-II, the McGraw Hill Companies, pp.186-187.
[2] Boothroyd, G.; Winston, A.K., (1989). Non-conventional machining processes, in Fundamentals of Machining and Machine Tools, Marcel Dekker, Inc, New York, 491.
[3] Brieman, L. and Spector, P. (1992), “Submodel selection and evaluation in regression: the X-random case,” International Statistics Review, vol.60, pp291-319.
[4] C.Y. Poon and B. Bhushan. Comparison of surface roughness measurements by stylus profiler, AFM and non-contact optical profiler. Wear, 190:76–88, 1995.
[5] D. Vrac, L. Sidjanin and S. Balos: Mechanical Finishing Honing: Honing Regimes and Surface Texture, Industrial Lubrication and Tribology, 63 (2011) pp. 427-435
[6] D. Vrac, L. Sidjanin, P. Kovac and S. Balos: The Influence of Honing Process Parameters on Surface Quality, Productivity, Honing Angle and Coefficients of Friction”, Industrial Lubrication and Tribology, 64 (2012) pp. 77-83
[7] Erzurumlu, O.H., 2007. Comparison of response surface methodology with neural network in determining the surface quality of molded parts. Materials and Design, vol. 28, no. 2, pp. 459–465.
i j
[8] Feng, C-X. and Wang, X. (2002), “Surface roughness predictive modeling Neural Networks vs. regression,” IIE Transactions, vol.35, pp11-27.
[9] Gencay Ramjan, Qi Min. Pricing and bedging., 2001. Derivative securities with neural networks, Bayesian regularization, early stopping and bagging. IEEE Trans
[10] Kalpakjian, S. and Schmid, S.R. (2003), “Manufacturing Processes for Engineering Materials,” 4th edition, Upper Saddle River, NJ:
Prentice Hall.
[11] Kolmogorov, A. (1957), “On the representation of continuous functions of several variables by superposition of continuous functions of one variable and addition,” Dok, vol.114, pp679-681. [12] Kwak, J.S., Sim, S.B. and Jeong, Y.D. (2005), “An analysis of
grinding power and surface roughness in external cylindrical grinding of hardened SCM 440 steel using the response surface method,” International Journal of Machine Tools and Manufacture, vol.46, pp304-312.
[13] Michail, S. and Barber, G. (1995), “The effects of roughness on piston ring lubrication-Part II: The relationship between cylinder wall surface topography and oil film thickness,” Tribology Transactions, vol.38, pp173-177.
[14] Montgomery, D.C. (2001a), Introduction to Statistical Quality Control, 4th edition, New York: John Wiley & Sons.
[15] Montgomery, D.C., 1991. Design and Analysis of Experiments Wiley, Singapore.
[16] Ozel, T. and Karpat, Y. (2005), “Predictive modeling of surface roughness and tool wear in hard turning using regression and neural networks,” International Journal of Machine Tools and Manufacture, vol.45, no4-5, pp467-479.
[17] P.M. Lonardo, H. Trumpold, and L.D. Chiffre. Progress in 3d surface microtopography characterization. CIRP Annals – Manufacturing Technology, 2:589–598, 1996.
[18] Phadke, M.S. (2001), Quality Engineering using Robust design, Prentice Hall Englewood Cliffs, New-Jersey.
[19] Rangwala, S.S. and Dornfeld D.A. (1989), “Learning and optimization of machining operations using computing abilities of neural networks,” IEEE Trans Systems, Man Cybernetics, vol.19, pp299-314.
[20] Sivanandam, S.N, Sumathi, S. and Deepa, S.N. (2008), Introduction to Neural Networks using MATLAB 6.0, 4th reprint,
Tata McGraw Hill Publishing Company Limited, New Delhi, India.
[21] Steward, M. (1992), “Optimizing piston bore surface finish,” SME Technical paper IQ92-155, Dearborn, MI: Society of Manufacturing Engineers.
[22] Tomanik, E. (2008), “Friction and wear bench tests of different engine liner surface finishes,” International Tribology, vol.41, pp1032-1038.
[23] Wang, M.Y. and Chang, H.Y. (2004), “Experimental study of surface roughness in slot end milling,” International Journal of Machine Tools and Manufacture, vol.44, pp51-57.
Mr. B.N.Tripathi
(Research Scholar- ISM Dhanbad, India) Under Supervision: Dr. N.K.Singh Teaching & Research Experience - 15 years Research Publications- 05
………..
Dr. N. K. Singh
Associate Professor ( Head of Workshop)
Department of Mechanical Engineering, ISM Dhanbad Teaching & Research Experience - 27 years
Research Publications - More than 35
………
Mr. U. K. Vates (Associate Professor & Head) Department of Mechanical Engineering, AIMT, Greater Noida, U.P.
Teaching & Research Experience - 11 years Research Publications- More than 17