e-ISSN: 2278-7461, p-ISSN: 2319-6491
Volume 5, Issue 5 [May. 2016] PP: 82-86
An Efficient Visualization and Segmentation of Lung CT Scan
Images for Cancer Detection
Birru Devender
1, Yalavarthi Ramakrishna
2, Bonepalli Uppalaiah
31,2Working as Associate Professor, Computer Science and Engineering, Holy Mary Institute of Technology and
Science/ JNTUH, T.S, India.
3Working as Assistant Professor, Computer Science and Engineering, Holy Mary Institute of Technology and
Science/ JNTUH, T.S, India.
ABSTRACT:- Interpretation of medical images is often difficult and time consuming, even for experienced physicians. The aid of image analysis and machine learning can make this process easier. The medical service has been enriched with a lot of new techniques for diagnostic imaging during the last decades. In recent years the image processing mechanisms are used widely in several medical areas for improving earlier detection and treatment stages, in which the time factor is very important to discover the disease in the patient as possible as fast, especially in various cancer tumors such as the lung cancer, breast cancer. Lung cancer images passed basic three stages to achieve more quality and accuracy in our experimental results : firstly image enhancement stage which is low pre-processing image techniques: Gabor filter using a Gaussian rule in which produced the best resultant enhanced images, then auto-enhancement method then FFT(Fast Fourier Transform) respectively. In the image segmentation stage, thresholding segmentation mechanism by Otsu thresholding algorithm and marker using the gradient magnitude as the segmentation function and computed the watershed transform of the segmentation function. Finally features which help to make a comparison between normal and abnormal images were. PCA and LDA techniques were used to extract the general features from an image and in practical session, two features computed were: black and white pixels percentage of the input image and the second feature is image Masking and labeling.
Keywords – Enhancement, segmentation, thresholding.
I.
NTRODUCTION
The lungs are the organs that help us breathe. They help to give oxygen to all the cells in the body. Cancer cells are abnormal cells. Cancer cells grow and divide more quickly than healthy cells. Some cancer cells may form growths called tumors. Lung cancer occurs when cells in the lung change to become abnormal. Lung cancer cells may travel through the blood or lymph system to another area or organ in the body. This is called metastasis. At present, the specimens of needle biopsies are usually analyzed by experienced pathologists. Since senior pathologists are rare, reliable pathological diagnosis is not always available.[1]During the last decades, along with the rapid developments of image processing and pattern recognition techniques, computer-aided lung cancer diagnosis attracts more and more attention. Lin developed a system based on a parameterized two- level convolution artificial neural network and on a special multi-label output encoding procedure, which was used in the diagnosis of lung cancer nodules found on digitized chest radiographs. Hayashibe proposed an automatic method based on the subtraction between two serial mass chest radiographs, which was used in the detection of new lung nodules. In this project firstly a ct scan image is enhanced to remove the noise or any error occurred during the traveling of image in the network. This enhanced image is then segmented using specific methods and then after performing masking process, we will detect the area of lung where the cancer is present.
II.
METHODOLOGY STEPS
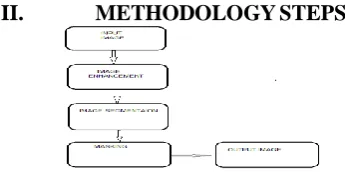
In this project basically three steps are use 1.Image enhancement.
2.Image segmentation. 3.Masking.
Image enhancement
The aim of image enhancement is to improve the interpretability or perception of information in images for human viewers, or to provide `better' input for other automated image processing techniques. To enhance the lung images following techniques have been used and a comparative analysis is done to discover the best enhancement technique.
1 Gabor filter enhancement technique
The image presentation based on Gabor function constitutes an excellent local and multi-scale decomposition in terms of logons that are simultaneously (and optimally) localization in space and frequency domains. Many image analysis applications,e.g. object recognition, tracking, etc., require spatially localized features. Gabor filters are a popular tool for this task of extracting spatially localized spectral features [1]. A Gabor filter is a linear filter whose impulse response is defined by a harmonic function multiplied by a Gaussian function. Because of the multiplication-convolution property (Convolution theorem), the Fourier transform of a Gabor filter's impulse response is the convolution of the Fourier transform of the harmonic function and the Fourier transform of the Gaussian function.
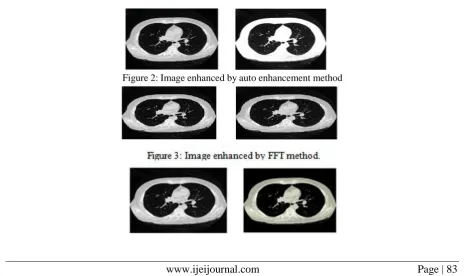
2 Auto Enhancement techniques
Auto enhancement, automatically adjusts and enhances the image (brightness, color and contrast) to optimum levels, and this is clearly observed. This method strongly depends on statistical operations such as mean , variance calculation.
3 Fast Fourier Transform technique
Fast Fourier Transform technique operates on Fourier transform of image The frequency domain is a space in which each image value at image position F represents the amount that the intensity values in image I vary over a specific distance related to F. Fast Fourier Transform ”FFT” is a faster version of the Discrete Fourier Transform (DFT). The FFT utilizes some clever algorithms to do the same thing as the DTF, but in much less time. The Fourier transform is used in a wide range of applications, such as image analysis, image filtering, image reconstruction and image compression. Our interest here in image filtering (enhancement).
Image enhancement techniques
Figure 4: Image enhanced by Gabor filter.
S.no.
Auto Enhancemen
t PSNR(dB)
FFT Enhanceme
nt PSNR(dB)
Gabor Enhanceme
nt PSNR(dB)
Sub1 11.7969 2.0324 16.4880
Sub2 08.9112 7.8653 13.4033
Sub3 13.7055 3.3805 15.2433
Sub4 15.2283 3.9786 14.4634
Sub5 11.6435 7.5149 14.1895
Table 1: Result of enhancement techniques Peak Signal to Noise Ratio (PSNR):
The phrase peak signal-to-noise ratio, often abbreviated PSNR, is an engineering term for the ratio between the maximum possible power of a signal and the power of corrupting noise that affects the fidelity of its representation.
Image segmentation
The goal of image segmentation [3] is to cluster pixels into salient image regions, i.e., regions corresponding to individual surfaces, objects, or natural parts of objects. Segmentation could be used for object recognition, occlusion boundary estimation within motion or stereo systems, image compression, image editing, or image database look-up. The goal of segmentation is to simplify and/or change the representation of an image into something that is more meaningful and easier to analyze. Image segmentation is typically used to locate objects and boundaries (lines, curves, etc.) in images. More precisely, image segmentation is the process of assigning a label to every pixel in an image such that pixels with the same label share certain visual characteristics.
1: Thresholding approach for segmentation Thresholding is a non-linear operation that converts a gray-scale image into a binary image where the two levels are assigned to pixels that are below or above the specified threshold value. Suppose that the gray-level histogram corresponds to an image, f(x, y), composed of dark objects in a light background, in such a way that object and background pixels have gray levels grouped into two dominant modes. One obvious way to extract the objects from the background is to select a threshold„T‟ that separates these modes. Then any point (x, y) for which f(x,y) > T is called an object point, otherwise, the point is called a background point.
2: Marker-Controlled Watershed Segmentation approach
The marker based watershed segmentation can segment unique boundaries from an image or stack of images, however it has no smoothing/ generalization properties. Combining the two approaches results in a segmentation method which both solves the contour initialization and generalization problem .
The strength of watershed segmentation is that it produces a unique solution for a particular image. The placement of internal and external markers into regions of interest can easily cope with the over-segmentation problem.
Ostu Thresholding Watershed Thresholding
Structural content
PSNR Structural content
PSNR
Sub1 2.4163e+004 4.759 1.0332e+003 17.590
Sub2 5.4249e+004 1.099 210.4856 25.443
Sub4 1.8719e+004 6.002 786.7099 7.589
Sub5 2.9662e+004 3.876 1.5408e+003 18.791
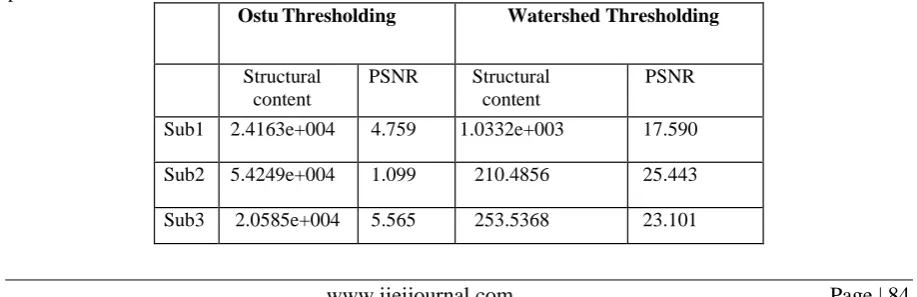
Table 2: Results of segmentation techniques
Images after enhancement are passed through segmentation algorithm. Enhanced images used, are from Gabor filtering method. To get the performance of segmentation technique, two features of segmented images were computed. Structural content shows the ratio of energy content of enhanced image and segmented image. This feature is basically used to check the content of segmented image as compared enhanced image. Second feature, used to analyze the performance of segmentation, is peak signal to noise ratio. Signal content of segmented image can be analyzed with the help of PSNR. Literature shows that the Structural content should be low and PSNR should be high for good segmentation techniques. From table it can be concluded that watershed algorithm as compared to Otsu thresholding, is best suitable technique for segmentation of lung images.
Feature extraction
Feature extraction [5] is an essential stage that represents the final results to determine the normality or abnormality of an image. Two approaches have been used to predict the probability of lung cancer presence; first approach is Binarization and the second is masking, Both of these methods are based on facts strongly related to lung anatomy and related information of lung CT imaging.
1. Binarization method
First method used for facture extraction is Binarization. It depends on the fact that the number of black pixels is much more than white ones in a normal lung image, so that we started to count the black pixels for normal and abnormal images to get the average which will be denoted later as threshold then each image black pixels will be compared to this threshold, whether it is greater, then it is normal, else the opposite.
2. Masking method
The second method which is used is image masking method. This method depends on the fact that the masses are appeared as white connected areas inside ROI (lungs) as they increase the percent of cancer presence increase. Appearance of solid blue color indicates normal case while appearance of RGB masses indicates presence of cancer.
III.
RESULT ANALYSIS
Figure 5: Original image and masked image for normal lung
Figure 6: Original image and masked image for normallung (cont.)
Figure 8: Normal image and Result showing normality
Figure 9: Abnormal image and Result showing abnormality
IV.
CONCLUSION
Five images of lung were used to analyses the enhancement method. Three image enhancement techniques were applied over the lung images (subject).To check the quality of enhanced images, peak signal to noise ratio is computed. As it can be seen from the table 1 that Gabor enhancement techniques gives the highest PSNR value. Hence it can be concluded that Gabor filtering is best suitable for enhancement of CT- images of lung. The purpose of the segmentation of the lung region in the CT image is to achieve a better orientation in the image. To get the performance of segmentation technique, two features of segmentedimages were computed. Structural content shows the ratio of energy content of enhanced image and segmented image. This feature is basically used to check the content of segmented image as compared enhanced image. Second feature used to analyze the performance of segmentation is peak signal to noise ratio. Signal content of segmented image can be analyzed with the help of PSNR. Literature shows that the Structural content should be low and PSNR should be high for good segmentation techniques. Two approaches have been used to predict the probability of lung cancer presence; first approach is Binarization and the second is masking, Both of these methods are based on facts strongly related to lung anatomy and related information of lung CT imaging. It can be concluded that cancer images have more number of white pixels in comparison to black pixels. Location of cancer cannot be determined with this approach. Masking algorithm is applied to find out the location of cancer area.
V.
FUTURE SCOPE OF THE WORK
Exact location of cancer be determined using some robust masking techniques. This algorithm can be applied on a special hardware to detect lung cancer. This algorithm can also be applied with modifications to 3D images and video frames.
REFERENCES
[1] Z. Zhou, Y. Jiang, Y. Yang, S.Chen “Lung Cancer Cell Identification Based on Artificial Neural Network Ensembles”, Artificial Intelligence in Medicine, 2002, vol.24, no.1, pp.25-36. @Elsevier [2] D. J. Gabor, “Theory of communication,”
[3] IEEE,vol. 93, no. 26, pp. 429–457, 1946.
[4] C. Huang, M. Wu ECE 533 Final Project, Fall 2006 University of Wisconsin- Madison” Image Segmentation”,
[5] M. Sikandar H. Khan, and A. BibiComputer Sciences Dept., Fatima Jinnah Women University, Rawalpindi, Pakistan” Modified Watershed Algorithm for Segmentation of 2D ImagesIssues in Informing Science and Information Technology.