340 Abstract—This paper presents an algorithm to automatically determine the number of clusters in a given input data set, under a mixture of Gaussians assumption. Our algorithm extends the Expectation- Maximization clustering approach by starting with a single cluster assumption for the data, and recursively splitting one of the clusters in order to find a tighter fit. An Information Criterion parameter is used to make a selection between the current and previous model after each split. We build this approach upon prior work done on both the K-Means and Expectation-Maximization algorithms. We extend our algorithm using a cluster splitting approach based on Principal Direction Divisive Partitioning, which improves accuracy and efficiency.
Index Terms—clustering, expectation-maximization, mixture of Gaussians, principal direction divisive partitioning
I. INTRODUCTION
The clustering problem is defined as follows : given a set of n-dimensional input vectors {x1 , . . . , xm}, we want to group them into an appropriate number of clusters such that points in the same cluster are positionally coherent. Such algorithms are useful for image compression, document clustering, bio-informatics, data mining, astrophysics and many other fields. A common approach for the clustering problem is to assume a Gaussian Mixture Model. In this model, the input data is assumed to have been generated by selecting any one of k Gaussian distributions, and drawing the input vector from the chosen distribution. Each cluster is thus represented by a single distribution. The Expectation-Maximization algorithm [4] is a well known method to estimate the set of parameters for such a mixture corresponding to maximum likelihood, however, it requires pre-knowledge about the number of clusters in the data (k).
Determining this value is a fundamental problem in data clustering, and has been attempted using Information Theoretic [6], Silhouette based [8], [9] and Goodness-of-fit methods [5], [7]. The X-Means algorithm [11] is an Information Criterion based approach to this problem developed for use with the K-Means algorithm. X-Means works by alternatively applying two operations – The K-Means algorithm (Improve-params) to optimally detect the clusters for a chosen value of k, and cluster splitting(Improve-structure) to optimize the value of k according to Information Criterion.
Department of Computer Engineering, Delhi College of Engineering, India([email protected], [email protected], [email protected])
One of the major problems with X-means is that it assumes an identical spherical Gaussian of the data. Because of this, it tends to over-fit data in elliptical clusters [6], or in an input set with data of varying cluster size. The G-Means and PG-Means algorithms try to solve this problem by projecting the data onto one dimension, and running a statistical goodness-of-fit test. This approach leads to better performance for non-spherical distributions, however, projections may not work optimally for all data sets. A projection can collapse the data from many clusters together, neglecting the difference in density. This requires multiple projections for accuracy [5].
Our algorithm employs a divisive hierarchical approach using Information Criterion, similar to X-Means, however, it differs by considering each cluster to be generated by a general multivariate Gaussian distribution. This allows each distribution to take a non-spherical shapes, and permits accurate computation of the likelihood of the model. We use Expectation-Maximization instead of K-Means for greater accuracy in detection of the parameters. Further, we also use an optimal method for cluster splitting based on Principal Direction Divisive Partitioning (PDDP) [3]. The PDDP algorithm uses Principal Component analysis to identify the direction of maximum variance for the data. By using this information during cluster splitting, we can attain much higher accuracy and performance, as our results show.
II. CONCEPTS AND DEFINITIONS
A. Mixture of Gaussians and Expectation-Maximization In the Gaussian Mixture model the input data set I = {x1 , . . . , xm} where xi ∈ Rn is assumed to be sampled from a set of distributions L = {A1,...,Ak} such that the probability density is given by
Where Aj denotes a Gaussian distribution characterized by mean μj and co-variance matrix Σj. Фj denotes the normalized weight of the jth distribution, and k is the number of distributions.
The likelihood of the data set is given by
The Expectation-Maximization algorithm EM(I,L) maximizes the likelihood for the given data set by repeating the following two steps for all i ∈ {1,...,m} and j ∈ {1,...,k} until convergence [9].
Parameter Selection for EM Clustering Using
Information Criterion and PDDP
341 1) Expectation Step
2) Maximization Step
B. Maximum Likelihood and Information Criterion Increasing the number of clusters in the mixture model results in an increase in the dimensionality of the model, causing a monotonous increase in its likelihood. If we were to focus on finding the maximum likelihood model with any number of clusters, we would ultimately end up with a model in which every data point is the sole member of its own cluster. Obviously, we wish to avoid such a construction, and hence we must choose some criteria that does not depend solely on likelihood. An Information Criterion parameter is used for selection among models with different number of parameters. It seeks to balance the increase in likelihood due to additional parameters by introducing a penalty term for each parameter. Two commonly used Information Criterion are Schwarz Criterion or Bayesian Information Criterion (BIC) [13] and Akaike's Information Criterion (AIC) [1].
BIC is defined as:
Where f is the number of free parameters. A mixture of k Gaussian distributions of dimension d consists of the following free parameters:
(k-1) parameters corresponding to Фj's, keeping in mind that their summation is equal to one.
k*d parameters for each d length mean vector in each distribution.
k*d*(d-1)/2 parameters for each free parameter in the co-variance matrix.
Therefore, we have
Other Information Criterion measures like the Integrated
Completed Likelihood [2] may also be used.
III. ALGORITHM
A. Description of the algorithm
The algorithm functions by alternating Expectation-Maximization and Split operations, as depicted in Figure 1. In the first figure, the EM algorithm is applied to a single cluster resulting in (a). The obtained distribution is split in (b), and the parameters are maximized once again to get (c). This is repeated to get the final set of distributions in (e). A formal version of the algorithm is presented below:
Where,
I is the set of input vectors
S is a set of normal distributions, initially consisting of a single member k, a distribution with random parameters
B is a set of marked or backtracked distributions
PrevNode is the distribution which had been split in the previous iteration.
x is the highest encountered value of IC
SBackup is the set of distributions corresponding to a BIC value of x.
IC is a function which returns either BIC or AIC SPLIT is a function which will be described later
342 Repeat until all members of S are marked
1) Apply Expectation-Maximization on S
2) Compute the Bayesian Information Criterion for L. If it is less than x, backtrack to Sbackup and mark the previously split distribution by adding it to B.
3) Remove an unmarked distribution from L, and apply the SPLIT procedure (described later) to add two new distributions to L.
An instance of Backtracking can be seen in Figure 2. The algorithm splits one of the clusters in (a) and applies the EM algorithm to get (b). However, the BIC in (b) is lesser than in (a), and hence the algorithm backtracks to the three cluster model. The algorithm will try splitting each of the three clusters, and after backtracking from each approach, it will exit with (a) being the final output.
There are two ways to handle B, the list of marked distributions. One way is to clear the list every time a distribution has been split (A backup copy, as in the case of S, needs to be maintained). This is a very accurate method, however, performance is lost because a single cluster may be split multiple times, even when it has converged to its final position. Another approach is to maintain a common list which is continuously appended, as in Figure 3. Although this may give rise to inaccuracy in the case when a previously backtracked distribution is moved, it can improve the convergence time of the algorithm considerably. The splitting procedure, described in the following section, ensures that such cases are rarely encountered.
B. An optimal split algorithm using Principal Direction Divisive Partitioning
The above algorithm does not specify how a chosen cluster must be split. A simple solution would be to randomly introduce two new distributions with a mean vector close to that of the split distribution, and to allow the EM algorithm to correctly position the new clusters.
However, there are a few problems with this approach. Not only does this increase convergence time in case the new
This angle, along with the mean computed earlier, gives us the First Principle Component of the distribution. In case of higher dimensional data sets, this is equivalent to the principle
eigen-vector of the covariance matrix of the input data (normalized to zero mean). Determining the Eigen-vectors for a non-rectangular matrix requires computation of its Singular Value Decomposition (SVD). The paper on Principal Direction Divisive Partitioning [3] describes an efficient technique for this using fast construction of the partial SVD.
In two dimensions, we can represent each Gaussian distribution by an elliptical contour of the points which have equal probability density. This is achieved by setting the exponential term in the density function to a constant C (The actual value of C affects the size and not the orientation of the ellipse, and as such does not make a difference in calculations).
343 A further improvement to this algorithm is made if we use an optimal method to chose the cluster for splitting. One approach to this is presented in [14].
IV. DISCUSSION
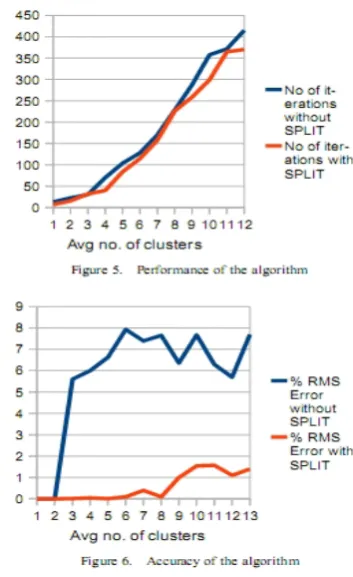
We tested our algorithm on a set of test two-dimensional images generated according to the mixture of Gaussians assumption. The results are shown in Figures 5 and 6. The error in detection was measured as the root mean squared difference between the actual (generated) and detected number of clusters in the data. The average error was very low (under 2%), especially when the optimized split procedure was used. This procedure consistently outperforms a random splitting procedure in both accuracy
and
performance. It's usage improves the average accuracy of our algorithm by more than 90%, over algorithms like X-Means, which split each cluster randomly.
Randomly splitting the clusters often tends to under-fit the data in the case when the algorithm gets stuck in local minima. The optimized split method reduces this problem by placing the new clusters in the vicinity of their final positions. This causes an improvement in accuracy to a remarkable extent. The reduction in number of iterations is less prominent but noticeable.
We also achieve another improvement over X-Means by relaxing the identical spherical distribution assumption. This assumption causes it to over-fit data in elliptical clusters, as shown in Figure 7. Our algorithm allows each distribution to have distinct parameters, properly identifying elliptical clusters, as shown in Figure 8. Improvements in efficiency can be gained by minimizing the time spent in backtracking within our algorithm. Two approaches to this would be to
optimize the cluster selection algorithm, and to allow backtracking before convergence.
S.No. Avg. Points/Clus
ter
Actual no. of clusters
Clusters detected using BIC
Clusters detected using AIC
1 12 2 2 2 2 55 4 4 4 3 86 4 4 6 4 56 5 5 6 5 62 5 5 8 6 14 8 8 8 7 12 10 10 10.4
TABLE 1.COMPARISON OF BIC AND AIC
344 the two approaches is the log|I| term which places a stronger penalty on increased dimensionality. We conclude that the Bayesian Information Criterion has greater accuracy in selecting among different Gaussian Mixture Models. This is supported by prior research [12].
In conclusion, our algorithm presents a general approach to use any Information Criterion to automatically detect the number of clusters during Expectation-Maximization cluster analysis. Although our results and figures are based on a two-dimensional implementation, we have generalized our approach to work with data of any dimensions. Divisive clustering approaches are used widely in fields like Document Clustering, which deal with multi-dimensional data. We believe that our algorithm is a useful method which allows a further automation in the clustering process by reducing the need for human input.
ACKNOWLEDGEMENT
We would like to thank Dr. Daya Gupta and Prof. Asok Bhattacharyya, Delhi Technological University, for providing invaluable guidance and support during our project.
We would like to thank Dan Pelleg and the members of the Auton Lab at Carnegie Mellon University for providing us with access to the X-Means code.
REFERENCES
[1] H. Akaike, "A new look at the statistical model identification," IEEE Transactions on Automatic Control , vol.19, no.6, pp. 716-723, Dec 1974
[2] C. Biernacki, G. Celeux and G. Govaert, "Assessing a mixture model for clustering with the integrated completed likelihood," IEEE Transactions on Pattern Analysis and Machine Intelligence, vol.22, no.7, pp.719-725, Jul 2000
[3] D. Boley, "Principal direction divisive partitioning," Data Min. Knowl. Discov., vol. 2, no. 4, pp. 325-344, December 1998
[4] A.P. Dempster, N.M. Laird and D.B. Rubin, "Maximum likelihood from incomplete data via the em algorithm," Journal of the Royal Statistical Society. Series B (Methodological), vol. 39, no. 1, pp. 1-38, 1977
[5] Y. Feng, G. Hamerly and C. Elkan, "PG-means: learning the number of clusters in data.” The 12-th Annual Conference on Neural Information Processing Systems (NIPS), 2006
[6] E. Gokcay, and J.C. Principe, "Information theoretic clustering," IEEE Transactions on Pattern Analysis and Machine Intelligence , vol.24, no.2, pp.158-171, Feb 2002
[7] G. Hamerly and C. Elkan, "Learning the k in k-means," Advances in Neural Information Processing Systems, vol. 16, 2003.
[8] S. Lamrous and M. Taileb, "Divisive Hierarchical K-Means," International Conference on Computational Intelligence for Modelling, Control and Automation, 2006 and International Conference on Intelligent Agents, Web Technologies and Internet Commerce, vol., no., pp.18-18, Nov. 28 2006-Dec. 1 2006
[9] R. Lletí, M. C. Ortiz, L. A. Sarabia, and M. S. Sánchez, "Selecting variables for k-means cluster analysis by using a genetic algorithm that optimises the silhouettes," Analytica Chimica Acta, vol. 515, no. 1, pp. 87-100, July 2004.
[10] A. Ng, "Mixtures of Gaussians and the EM algorithm" [Online] Available:
http://see.stanford.edu/materials/aimlcs229/cs229-notes7b.pdf [Accessed: Dec 20, 2009]
[11] D. Pelleg, and A. Moore, "X-means: Extending k-means with efficient estimation of the number of clusters," in In Proceedings of the 17th International Conf. on Machine Learning, 2000, pp. 727-734. [12] S. M. Savaresi, D. Boley, S. Bittanti, and G. Gazzaniga, “Choosing
the Cluster to Split in Bisecting Divisive Clustering Algorithms”, Technical Report TR 00-055, University of Minnesota, Oct 2000 [13] G. Schwarz, "Estimating the dimension of a model," The Annals of
Statistics, vol. 6, no. 2, pp. 461-464, 1978.
[14] R. Steele and A. Raftery, "Performance of Bayesian Model Selection Criteria for Gaussian Mixture Models" , Technical Report no. 559, Department of Statistics, University of Washington, Sep 2009