e
-ISSN: 2278-067X,
p
-ISSN : 2278-800X, www.ijerd.com
Volume 5, Issue 7 (January 2013), PP. 30-35
Voltage Stability Margin (VSM) and Maximum Loading
Point (MLP) Of A Multi-Bus System Before and After
Compensation
Sourav Basu
1, Chandramouli Gupta
2, Sumana Chowdhuri
31.2M-Tech Student, Department of Applied Physics University of Calcutta Kolkata, India
3Faculty, Department of Applied Physics University of Calcutta Kolkata, India
Abstract:- The purpose of this paper is to study the reactive power sensitivity as an index for finding out the weakest bus. Voltage Collapse point is also determined from the P-V and Q-V curves of the weakest and next weakest bus. The way of finding out Voltage Stability Margin is also proposed. Finally, a method to compensate the reactive power of the weakest bus to improve its stability is also proposed. Contingency test is also carried out to study at which condition the system is more secured. These techniques are tested on the IEEE-14 bus system and results are given to prove the effectiveness of the proposed methods.
Keywords:- Voltage Stability Margin (VSM), Voltage Collapse Point, (∂Q/∂V) indicator, Maximum Loading Point (MLP), Contingency.
I.
INTRODUCTION
THE increase in power demand and limited sources for electric power has resulted in an increasingly complex interconnected system, forced to operate closer to the limits of stability. Voltage instability is mainly associated with reactive power imbalance. The loadability of a bus in the power system depends on the reactive power support that the bus can receive from the system as the system approaches the voltage collapse point or maximum loading point (MLP). Voltage collapse phenomena in power systems have become one of the important concerns in the power industry over the last two decades, as this has been the major reason for several major blackouts that have occurred throughout the world. Hence, the ability to determine voltage stability before voltage collapse has received a great attention. The only way to save the system from voltage collapse is to reduce the reactive power load or add additional reactive power prior to reaching the point of voltage collapse.
‘Voltage stability’ is concerned with the ability of power system to maintain the steady acceptable voltages at all system buses under normal conditions as well as when the system is being subjected to a disturbance [13]. Power system is voltage stable if voltages after a disturbance are close to voltages at normal operating condition. A power system becomes unstable when voltage uncontrollably decreases due to outage of equipment, increment of load, decrement of production. There are two types of voltage stability based on the time frame of simulation: static voltage stability and dynamic voltage stability. Static analysis involves only the solution of algebraic equations and hence is computationally less extensive than dynamic analysis. Static voltage stability is ideal for the bulk of studies in which voltage stability limit for many cases must be determined. ‘Voltage Security’ is basically related to a degree of minimal probability of blackout and equipment damage [13].
In this work an IEEE standard 14 bus systems is considered and the weakest bus is found out using Newton Raphson Load Flow analysis method and also the weakest bus is compensated by connecting a shunt capacitor to this bus. The after effect on the other buses is also considered.
Voltage Stability Margin (VSM) of the weakest bus as well as of the next weakest bus is calculated for checking the security level of these buses. Voltage Stability Margin (VSM) is the measure of the security level of the bus, if the value of VSM is high then the bus is more secured and vice versa.
“Contingency Analysis” is an essential part of the security analysis. Contingency arises due to scheduled outage, component switching, or unscheduled outage due to fault. Contingency test is also carried out on the weakest bus of the IEEE standard 14 bus system and it is checked out at which condition the bus is more secured[1].
II.
DETERMINATION
OF
THE
WEAKEST
LOAD
BUS
VOLTAGE
COLLAPSE
POINT
AND
VOLTAGE
STABILITY
MARGIN
(VSM)
Newton-Raphson Load Flow analysis is carried out on the IEEE-14 bus system. The basic equation used in Newton-Raphson method is-
1 2
3 4
|
|
J
J
P
J
J
Q
V
……… (1)
Thus, Jacobian Matrix (equation 1) is formed. Jacobian matrix (J) can be subdivided into four sub matrices- J= [J1 J2; J3 J4].
Now, the reactive power is less sensitive to changes in phase angles and is mainly dependent on changes in voltage magnitudes. Similarly, real power change is less sensitive to the change in the voltage magnitude and is most sensitive to the change in phase angle. So, it is quite accurate to set J2 and J3 of the Jacobian matrix to zero.
The diagonal elements of J4 indicate the reactive power sensitivity of i-th bus. ∂Qi/∂|Vi| also indicates the degree of weakness for the i-th bus. The bus corresponding to the maximum value of ∂Qi/∂|Vi| is the strongest bus and the bus corresponding to the minimum value of ∂Qi/∂|Vi| is the weakest bus [1]. In this way weakest load bus of any multi bus system can be found out.
In static voltage stability, slowly developing changes in the power system occur that eventually lead to a shortage of reactive power and declining voltage. This phenomenon can be seen from the plot of power transferred versus the voltage at receiving end. The plots are popularly referred to as P-V curve or “Nose” curve. It is seen that as the power transfer increases, the voltage is decreased (keeping reactive power constant). Similarly, Q-V curve can be obtained by keeping P constant and gradually increasing the reactive power (Q). Now, identification of voltage collapse point is obtained using this conventional P-V and Q-V curves. There is a critical point beyond which there is no load flow solution and the load flow method will not converge. Such a load point represents the “knee” point of the P-V and Q-V curve. This is the point at which the voltage collapse occurs.
“Voltage Stability Margin” of a power system is a measure to estimate the available power transfer capacity, net power transfer capacity or total power transfer capacity. Voltage stability margin (VSM) is the measure of the security level of the bus, if the value VSM is high then the bus is more secured and vice versa [1]. Voltage stability margin (VSM) is a straightforward, widely accepted and easily understood index of voltage collapse.
This is a difference or a ratio between the operation and voltage collapse points according to a key parameter (loading, line flow, etc).So, voltage stability margin can be calculated in the following manner-
( ) ( )
( )
w base w critical
w critical
V
V
VSM
V
……….. (2)
In equation 2, VW (base) = bus voltage of the weakest bus of the system at normal operating
condition.
VW (critical) = bus voltage of the weakest bus of the system at voltage collapse point.
III.
SIMULATION
AND
RESULTS
Fig-1 shows the IEEE standard 14 bus system.
Newton Raphson Load Flow Method is applied on this system. The diagonal elements of J4 matrix as obtained in the test is given in the table-1 below-
Table 1:Diagonal Elements of J4 Matrix Load
Bus No.
Diagonal Elements of J4 System Bus No.
1 32.9706 4
2 28.6156 5
3 18.5629 7
4 22.5711 9
5 13.8719 10
6 8.2876 11
7 5.4054 12
8 10.4986 13
9 4.9687 14
So, for IEEE standard 14 bus system the weakest bus is 14th bus and the next weakest bus is 12th bus without the connection of any compensating device.
IV.
DETERMINATION
OF
VOLTAGE
STABILITY
MARGIN
(VSM)
OF
THE
WEAKEST
BUS
AND
NEXT
WEAKEST
BUS
WITHOUT
ANY
COMPENSATION
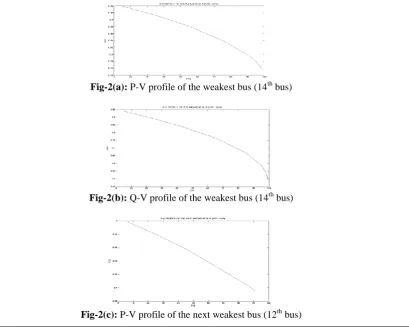
Now, the voltage collapse point is determined, P is increased keeping Q constant and P-V curve is plotted for the weakest and next weakest bus. Also Q is increased keeping P constant and Q-V curve is plotted for the weakest bus and next weakest bus. The P-V and Q-V curve of the weakest and next weakest bus is shown in the fig-2(a), fig-2(b), fig-2(c) and fig-2(d).
Fig-2(a): P-V profile of the weakest bus (14th bus)
Fig-2(b): Q-V profile of the weakest bus (14th bus)
Fig-2(d): Q-V profile of the next weakest bus (12th bus)
For IEEE standard 14 bus system the Voltage stability margin as obtained in our test is shown in the table below-
Table 2:VSM of 12TH and 14TH bus
V.
CONNECTION
OF
REACTIVE
POWER
COMPENSATING
DEVICE
TO
THE
WEAKEST
BUS
Now inspection of the system is done by connecting a capacitor of 97.78uF in between the weakest bus and ground thus increasing the shunt charging admittance (Fixed capacitor modeling). The diagonal elements of J4 become as per table 3.
Table 3: Diagonal Elements of J4 Matrix (After Compensation) Load
Bus No.
Diagonal Elements of J4 System Bus No.
1 34.8920 4
2 29.5384 5
3 23.1008 7
4 30.6101 9
5 18.9546 10
6 9.7780 11
7 5.8352 12
8 12.0663 13
9 6.0877 14
Now, it is seen that bus no 12 is now the weakest bus and bus no 14 is the next weakest bus.
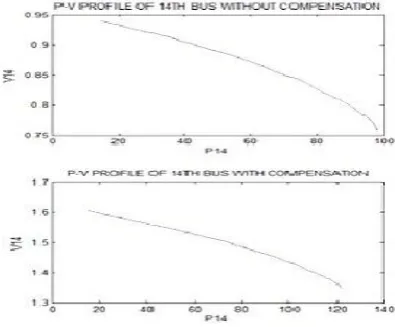
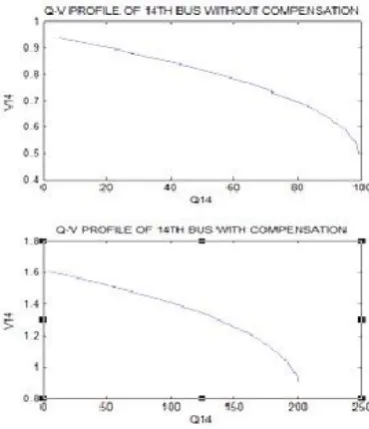
For the sake of comparison the P-V and Q-V profile of the compensated and uncompensated 14th bus is shown in the figure below where the P-V profile is shown in fig-3(a) and the Q-V profile is shown in fig-3(b).
Fig-3(a): P-V profile of the 14th bus with and without compensation
Bus No. VSM(P) VSM(Q)
Fig-3(b):Q-V profile of the 14th bus with and without compensation
The change in the voltage stability margin (VSM) with the addition of shunt capacitor is shown in the table-4 below-
Table 4: Modified VSM of the 12th and 14th bus
Bus No. VSM(P) VSM(Q)
12(Weakest Bus) 0.2379 0.8873
14 (Next Weakest Bus) 0.1905 0.7853
VI.
CONTINGENCY
TEST
Contingency test have been done on 14th bus (weakest bus) by tripping the line connected to it and corresponding VSM is calculated.
CASE-1 (TRIPPING LINE 13-14)
Line connecting the bus 13 and 14 is tripped. Now keeping Q constant, P is increased of the 14th bus and corresponding value of V is noted. VSM (P) is calculated.
Now, keeping P constant, Q of the 14th bus is increased and the corresponding V is noted. VSM (Q) is calculated.
VSM(P) VSM(Q)
0.5827 0.9147
CASE-2 (TRIPPING LINE 9-14)
Line connecting the bus 9 and 14 is tripped. Now keeping Q constant, P is increased of the 14th bus and corresponding value of V is noted. VSM (P) is calculated.
Now, keeping P constant, Q of the 14th bus is increased and the corresponding V is noted. VSM (Q) is calculated.
VSM(P) VSM(Q)
0.5285 0.8509
Now, voltage stability margin (VSM) is the measure of the security level of the bus, if the value of VSM is high then the bus is more secured and vice-versa [1].
In case -1, i.e. when the line connecting 13 and 14 bus is tripped then the value of VSM is higher than the other two cases (tripping line 9-14 and no trip condition) , that means in that case bus number 14 is more secured.
VII.
CONCLUSION
compensated 14th bus than the uncompensated 14th bus, i.e., the maximum loading point (MLP) is increased after compensation.
Also, if we compare the graph showing the Q-V curve of the uncompensated 14th bus with the graph showing the Q-V curve of the compensated 14th bus, it seen that the reactive power at which the voltage collapse occur is larger in case of compensated 14th bus than the uncompensated 14th bus.
ACKNOWLEDGMENT
We are extremely grateful to the Applied Physics Department, University of Calcutta and for extending all its facilities. We humbly extend our sense of gratitude to our faculty members, laboratory staffs, library staffs and administration of this institute for providing us their valuable help and time in congenial working environment.
REFERENCES
[1]. Kabir Chakraborty and Sangita Das Biswas “An Offline Simulation Method to Identify the Weakest Bus and Its Voltage Stability Margin in a Multi-bus Power Network”, Proceeding of International Conference MS’07, India, December 3-5,2007, pp. 1-5.
[2]. An Analytical Investigation of Voltage Stability of an EHV Transmission Network based on Load Flow-A. Chakrabarti and P. Sen, Journal of Electrical Engg., Institution of Engg. (I, Vol.-76, May 1995].
[3]. P. Kessel and H. Glavitsch “Estimating the Voltage Stability of Power System” IEEE Trans. On Power delivery, Vol. PWRD-1, No.3 July/1986, pp. 346-354.
[4]. H.K. Clark “New Challenges: Voltage Stability” IEEE Power ENG. Rev., April 1990, pp. 33-37. [5]. Y. Tamura, H. Mori and S. Lwanoto “Relationship between voltage instability and multiple load flow
solution in electrical system” IEEE Trans. Vol. PAS-102, pp. 115-125.
[6]. Crisan and M. Liu “Voltage collapse prediction using an improved sensitivity approach”, Electrical power system research, 1984, pp. 181-190.
[7]. C.K. Chanda, S. Dey, A. Chakrabarti and A.K. Mukhopadhyay; Determination of Bus Security Governed by Sensitivity Indicator in a Reactive Power Constrained LPS System. Journal of Engg. and Material Science, India, Vol. IX August 2002.
[8]. S. Dey, C.K. Chanda and A. Chakrabarti; Development of a Global Voltage Security Indicator and Role of SVC on it in LPS System. Journal of Electric Power System Research, USA, Vol.68 2004. [9]. C.W Taylor, Power System Voltage Stability, McGraw-Hill, 1994.
[10]. R.J Koessler, Voltage instability/ Collapse-An overview, IEE Colloquium on voltage collapse, Digest No. 1997/101, 1997, pp. 1/6-6/6.
[11]. Abhijit Chakraborty, Sunita Halder, “Power System Analysis Operation and Control”, Prentice-Hall India, 2006.
[12]. Hadi Saadat, Power System Analysis, TATA McGRAW-HILL, 2004.
[13]. Abhijit Chakrabarti, D.P. Kothari, A.K. Mukhopadhyay, Abhinandan De “An Introduction to Reactive Power Control and Voltage Stability in Power Transmission Systems, PHI Learning Private Limited, 2010.