The Model Development of Gas Diffusion Layer for
PEM Fuel Cell
Dahiyah Mohd Fadzillah, Chin Lee Nee & Masli Irwan Rosli*
Fuel Cell Institute, Universiti Kebangsaan Malaysia, Bangi, MalaysiaDepartment of Chemical and Process Engineering, Universiti Kebangsaan Malaysia, Bangi, Malaysia
Abstract-- Gas diffusion layer (GDL) is a crucial component of
a proton-exchange membrane fuel cell (PEMFC) that participates in the transport of reactant gases and removes water from the system. In this research, a two dimensional (2D) model was developed and simulated to determine the effects of porosity and thickness of GDL on PEMFC performance by using MATLAB. The GDL model presented the contour profiles illustrating the distribution of oxygen mass fraction in the cathode GDL. The model also well agreed with experimental results available in literature. In the simulation of GDL model, higher-porosity GDL showed higher cell performance because of the numerous void spaces that enhanced the diffusion of oxygen to the catalyst layer. Simulation results further showed that a thicker GDL produced a lower-performance cell. All these factors contributed to the lower oxygen concentration near the catalyst layer and GDL interface and thus the lower cell performance. Through the GDL model, the optimum porosity and thickness of GDL were found to be 0.8 and 130 µm, respectively.Index Term--
GDL; PEMFC; MATLAB; porosity; thickness
I. INTRODUCTIONProton-exchange membrane fuel cell (PEMFC), also known as polymer electrolyte membrane fuel cell, is an electrochemical device that converts the chemical energy of hydrogen and oxygen into electricity and heat with water as a byproduct. PEMFCs operate at low temperature and high current density [1]. PEMFCs are applied mainly in the automotive industry and occasionally in stationary power generators [2]. PEMFCs are a potential area for research because they are attractive alternative energy sources for electric-power generation, primarily for automotive applications. PEMFCs are unique compared with other fuel cells and have thus become research hotspots because of the increasing demand for PEMFC commercialization.
Gas diffusion layer (GDL) is a thin layer in a PEMFC that plays an important function in improving PEMFC performance. The most important function of GDL is to distribute hydrogen and oxygen to the catalyst layer and remove the water out of the fuel cell. In addition, GDL provides mechanical support to the membrane and a conductive path between the catalyst layer and the current collector [3]. Therefore, GDL characteristics such as thickness, porosity, and permeability that affect PEMFC performance must be examined. In recent years, researchers have worked to achieve progress in the development of cost-effective fuel cell technology.
PEMFC operation is affected by GDL. Therefore, accurate prediction of the characteristics of an effective transportation is important in understanding fuel-cell performance. The experimental of PEMFC performance evaluation has been widely studied. Moreover, applying the modeling techniques for better understanding the effective parameters in designing and optimizing the fuel cell has advantages, for the purpose of improving fuel cell technology [4]. Many modeling studies have been done to investigate the transport phenomena in GDL.
poor gas diffusivity. Whereas, a very thin GDL gives high electronic resistance and causes voltage losses in the cell.
Table I
The range of values for the porosity and thickness of GDL Parameter
Study Porosity (%) Thickness (µm)
Shokuhfar et al. [4] 40 – 60
Inamuddin et al. [5] 40 – 70
Zamel et al. [11] 40 – 90
Jang et al. [12] 30 – 60
Yan et al. [13] 30 – 60
Inamuddin et al. [5] 400 – 600
Jang et al. [12] 200 – 600
Youssef et al. [14] 260 – 360
Chun et al. [15] 200 – 500
Final range 40 – 90 200– 600
II. METODOLOGY
A two-dimensional (2D) GDL model was developed and subsequently used for simulation based on two
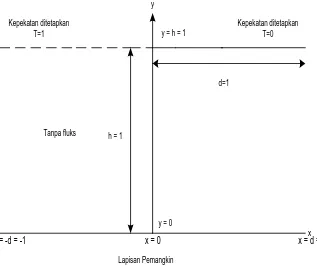
parameters: porosity and thickness. The 2D model was built based on schematic by Benziger et al. [16] in Figure 1.
Kepekatan ditetapkan T=1
Kepekatan ditetapkan T=0 y
y = h = 1
d=1
y = 0
x
Lapisan Pemangkin
Positif fluks haba, positif fluks wap,negatif fluks oksigen,tanpa air, tanpa kecerunan tekanan h = 1
Tanpa fluks
x = -d = -1
x = 0
x = d =1
Fig. 1. The schematic diagram of 2D model [12]
A complete set of algorithms was developed by using relevant equations for GDL modeling and simulation. The physical parameters and the dimensions of the domain were obtained through literature study. The model was based on
Fickian equation in Equation 1. To relate the porosity and GDL thickness, the equation below [17] was used:
Where,
̌ = Velocity of gas phase
̃ = Oxygen concentration = Oxygen diffusion coefficient
= Volume fraction of water
Effective oxygen diffusivity coefficient is associated with porosity, and ε is through Bruggeman correlation [5].
(2)
To relate the porosity and GDL thickness, the equation below [17] was used:
(3)
Where,
= Actual weight (g/cm2),
= Density of gas phase (g/cm3),
= Thickness of GDL (cm2)
Subsequently, a 2D model of GDL for PEMFC was developed using MATLAB software. Through this model,
oxygen concentration and power in each case were obtained. Figure 1 shows a schematic of the cross-section of the cathode GDL as presented by Benziger et al. [16]. The dotted line illustrates the gas line, and the bottom layer of the GDL is the catalyst layer. At the top of the channel, gas is fed into the system; at the bottom, the gas outlet is channeled to the catalyst layer where the reaction occurs. Given that the half of the upper boundary of GDL is a solid cathode material and the other half is an open channel, the boundary conditions are mixed. Benziger suggested that Neumann boundary conditions should be used in a cathode without flux, whereas Dirichlet boundary conditions should be used in a cathode without liquid water.
To simplify the model equations and reduce the complexity of writing GDL algorithm, four assumptions were made: (1) without liquid state, (2) without convection, (3) steady flux, and (4) steady pressure. The modeling process using MATLAB is execute by grid meshing, determination of boundary condition and calculation of interior domain.
I. RESULT AND DISCUSSION
Model Validation
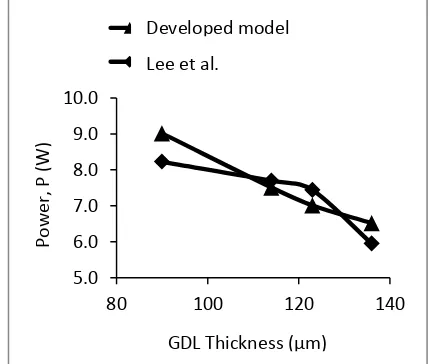
Figure 2 displays the results of the comparison curve obtained from these studies with the experimental model of Lee et al. [6]. This comparison is conducted at a voltage of 0.7 V and a surface area of 25 cm2 GDL.
Fig. 2. Comparison curve for model validation based on GDL thickness
Through comparison data from the model study with the experimental data, the data generated from GDL model shows a similar curve patterns. With increased GDL thickness, current density and fuel-cell power decrease. At thicknesses of 114 and 123 m, model results well agree with experimental data. However, at thicknesses of 90 and 136 m, the data from the model show little difference from experimental data, with an error of 8.7%. For GDL with 90 m thickness, the model
result for power is higher that experimental data; the opposite is observed for 136 m thickness.
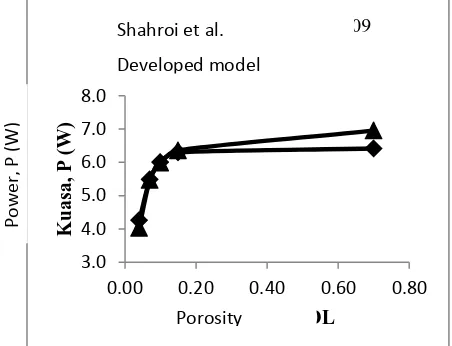
Figure 3 shows the results of comparison curves for the developed model and model of Sahraoui et al. based on GDL porosity. This comparison is conducted at a voltage of 0.7 V and a surface area of 25 cm2 GDL.
5.0 6.0 7.0 8.0 9.0 10.0
80 100 120 140
K
ua
sa
,
P
(W)
Ketebalan GDL, µm
Model Kajian
Ujikaji Lee et al. 2004
Developed model
Lee et al.
GDL Thickness (μm)
Po
w
er,
P
Fig. 3. Comparison curve for model validation based on GDL porosity
Through comparison data for the both models, both of these data have similar pattern of curves that shows increasing fuel-cell power with increased GDL porosity. The porosity of GDL is 0.04–0.15. The developed model contains an error of less than 1%.Therefore, the model results are consistent with data from the Sahraoui model. However, at a higher porosity such as 0.7, data from the model study demonstrate an error of 7.7%. Although the developed model does not show 100% consent with the literature review, but it managed to generate data that are close and similar to the study of Lee et al. and Sahraoui et al.. Thus, the model in this study can be considered as a model that could be used for further research. .
Result of GDL Modelling for Porosity
The values of porosity (ɛ) of the simulated GDL are 0.05, 0.1, 0.2, 0.4, 0.6, and 0.8. These values are based on the range of porosity values obtained in the study that are listed in Table 1. Figure 4 shows the curve of power against the porosity of GDL at a voltage of 0.7 V. The simulation results show that the increasing porosity contributes to the higher PEMFC performance. This result is due to the fact that GDL with higher porosity contains more empty spaces that facilitate the absorption of oxygen or air by the catalyst layer, resulting in more reaction sites and thus improving PEMFC performance [18]. Therefore, PEMFC performance is highest at a porosity of 0.8 and lowest at 0.05.
Fig. 4. Power versus porosity of GDL AT 0.7 V
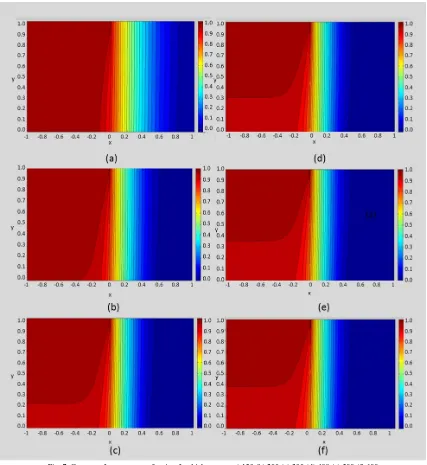
Contour of Oxygen Mass Fraction Distribution at Different Porosity
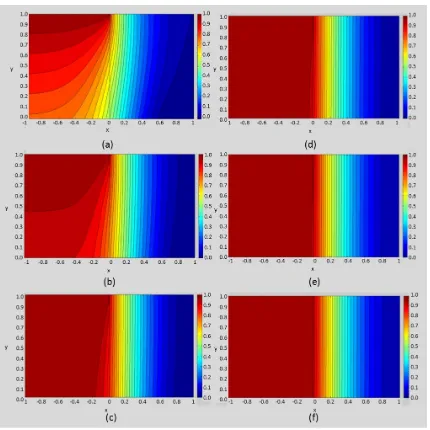
Figure 5 shows a contour of oxygen mass fraction distribution in the cathode GDL that is based on different GDL porosity values. With regard to the contour, in the
GDL, the distribution of the mass fraction of oxygen is higher, which is in the range of 0.5–1.0. Whereas in the GDL, the distribution of the mass fraction of
oxygen is lower, which is 0–0.7. Such contours is due to the part of GDL which is an open channel in which oxygen or air is diffused into the GDL, whereas at the GDL
, it is a solid cathode material. Different colors in the contour illustrate the differences in oxygen concentration gradients in the GDL. The results show that the mass flux of oxygen decreases as porosity of the GDL increases. Therefore,
3.0 4.0 5.0 6.0 7.0 8.0
0.00 0.20 0.40 0.60 0.80
K
ua
sa
,
P
(
W)
Keliangan GDL
Model Sahraoui et al. 2009
Model kajian
4.0 4.5 5.0 5.5 6.0 6.5 7.0 7.5
0.0 0.5 1.0
K
ua
sa
,
P
(W)
Keliangan GDL, ε
Developed model Shahroi et al.
Porosity
Po
w
er,
P
(W)
Porosity
Po
w
er,
P
diffusion of oxygen into the GDL increases as the porosity increases.
Fig. 5. Contour of oxygen mass fraction for porosity, ɛ = (a) 0.05 (b) 0.1 (c) 0.2 (d) 0.4 (e) 0.6 (f) 0.8
Result of GDL Modelling for Thickness
Based on the range of thickness in Table 1, the values of GDL thickness (t) for the simulation are 130 m, 200, 300, 400, 500, and 600 µm. Figure 6 shows the curve of power against the thickness of GDL at a voltage of 0.7 V. The simulation results show that PEMFC performance decreases when the GDL thickness decreases. This result is due to the higher resistant of the gas diffusion in thicker GDL, and to seep into the reaction zone takes longer time [15]. Hence, oxygen concentration on the surface of the catalyst layer decreases and contributes to power reduction and follows by a decline in the PEMFC performance. Therefore, fuel-cell performance is highest at a thickness of 130 µm and lowest at 600 µm.
Fig. 6. Power versus thickness of GDL
Contour of Oxygen Mass Fraction Distribution at Different Thickness
Contour of the mass fraction distribution of oxygen in the cathode GDL based on the GDL thickness is shown in Figure 7. With regard to the results of the current study, the
5.0 6.0 7.0
100 300 500 700
K
ua
sa
,
P
(W)
Ketebalan GDL, µm
Thickness (μm)
Po
w
er,
P
contour differences at the different thickness values are more pronounced in the GDL where it is an open channel for the oxygen diffusion. At lower thickness, the oxygen mass flux increases leading to the increase of oxygen mass fraction. This phenomenon can be observed in the
increased contour profile for the mass fraction of 0.9–1.0 which is represented by the red color, and the reduction of the mass fraction contour profile of 0–0.1 is represented in blue in Figure7.
Fig. 7. Contour of oxygen mass fraction for thickness, t = a) 130 (b) 200 (c) 300 (d) 400 (e) 500 (f) 600
II. CONCLUSION
The developed 2D model of GDL cathode can generate a contour distribution of the mass fraction of oxygen. The model was validated, and results well agreed with experimental data. In a simulation study of GDL porosity, the studied porosity values were 0.05, 0.1, 0.2, 0.4, 0.6, and 0.8. Simulation results showed that increasing the porosity of GDL improved PEMFC performance, and that fuel-cell power was highest at a porosity value of 0.8. Moreover, in a simulation study of GDL
thickness, the studied values were 130, 200, 300, 400, 500, and 600 µm. Results showed that increasing the GDL thickness decreased PEMFC performance. Therefore, PEMFC performance was highest at a thickness of 130 µm.
III. ACKNOWLEDGEMENT
REFFERENCES
[1] Wang, Y., Chen, K. S., Mishler, J., Cho, S. C. & Adroher, X. C. 2011. A Review of Polymer Electrolyte Membrane Fuel Cells: Technology, Applications, and Needs on Fundamental Research. Applied Energy 88(4): 981-1007.
[2] Wee, J. H. 2007. Applications of Proton Exchange Membrane Fuel Cell Systems. Renewable and Sustainable Energy Reviews 11(8): 1720-1738.
[3] Spiegel, C. 2008. Chapter 8 - Modeling the Gas Diffusion Layers. Dlm. Spiegel, C. (pnyt.). Pem Fuel Cell Modeling and Simulation Using Matlab, hlm. 197-241. Burlington: Academic Press.
[4] Shokuhfar, A., Nejadseyfi, O. & Zolriasatein, A. 2013. A Numerical Study of the Influence of Gas Diffusion Layer Porosity on Cell Performance of Counter Flow Proton Exchange Membrane Fuel Cells. Iranica Journal of Energy and Environment (IJEE) 4(2): 126-129.
[5] Inamuddin, Cheema, T. A., Zaidi, S. M. J. & Rahman, S. U. 2011. Three Dimensional Numerical Investigations for the Effects of Gas Diffusion Layer on Pem Fuel Cell Performance. Renewable Energy 36(2): 529-535.
[6] Lee, H. K., Park, J. H., Kim, D. Y. & Lee, T. H. 2004. A Study on the Characteristics of the Diffusion Layer Thickness and Porosity of the Pemfc. Journal of Power Sources 131(1–2): 200-206.
[7] Sahraoui, M., Kharrat, C. & Halouani, K. 2009. Two-Dimensional Modeling of Electrochemical and Transport Phenomena in the Porous Structures of a Pemfc. International Journal of Hydrogen Energy 34(7): 3091-3103.
[8] Walter, L. 2008. Towards a Model Concept for Coupling Porous Gas Diffusion Layer and Gas Distributor in Pem Fuel Cells. nstitut f•ur Wasserbau, Universit•at Stuttgart.
[9] Bazylak, J. H. a. A. 2011. Pem Fuel Cell Gas Diffusion Layer Modelling of Pore Structure and Predicted Liquid Water Saturation ASME 2011 9th Fuel Cell Science, Engineering and Technology Conference, hlm.
[10] Larbi, B., Alimi, W., Chouikh, R. & Guizani, A. 2013. Effect of Porosity and Pressure on the Pem Fuel Cell Performance. International Journal of Hydrogen Energy 38(20): 8542-8549. [11] Zamel, N. 2011. Transport Properties of the Gas Diffusion Layer
of Pem Fuel Cells. Tesis Doctor of Philosophy in Mechanical Engineering, University of Waterloo.
[12] Jang, J. H., Yan, W. M. & Shih, C. C. 2006. Effects of the Gas Diffusion-Layer Parameters on Cell Performance of Pem Fuel Cells. Journal of Power Sources 161(1): 323-332.
[13] Yan, W. M., Soong, C. Y., Chen, F. & Chu, H. S. 2004. Effects of Flow Distributor Geometry and Diffusion Layer Porosity on Reactant Gas Transport and Performance of Proton Exchange Membrane Fuel Cells. Journal of Power Sources 125(1): 27-39. [14] Youssef, M. S., Khalil, M. H. & Al-Nadi, K. E. 2010. Neural
Network Modeling for Proton Exchange Membrane Fuel Cell (Pemfc). Advances in Information Sciences and Service Sciences 3(2): 61-66.
15] Chun, J. H., Park, K. T., Jo, D. H., Kim, S. G. & Kim, S. H. 2011. Numerical Modeling and Experimental Study of the Influence of Gdl Properties on Performance in a Pemfc. International Journal of Hydrogen Energy 36(2): 1837-1845.
[16] Benziger, J., Chia, E., Karnas, E., Moxley, J., Teuscher, C. & Kevrekidis, I. G. 2004. The Stirred Tank Reactor Polymer Electrolyte Membrane Fuel Cell. AIChE Journal 50(8): 1889-1900.
[17] Zhang, J. 2008. Pem Fuel Cell Electrocatalysts and Catalyst Layers. 1. Springer.