Sunil Kumar Tiwari*, Archi Dubey**
Referred Journal of CMR College of Engineering & Technology January-March 2019, Volume 8, No. 1, pp 58-68
ISSN: 2277-6753 (Print) ISSN: 2322-0449 (Online) http://cmrcetmba.in/sumedha/
Structural Equation Modeling for Academic Performance
Confidence Affecting Factor
Sunil Kumar Tiwari*, Archi Dubey**
* (Research Scholar, MSMSR Dep't, MATS University, Raipur Chhattisgarh. [email protected]) **(Research Supervisor, MSBS Dep't MATS University Raipur Chhattisgarh. [email protected])
Abstract
Institution provide better educational effort to nurture student studying in their institution. But institution never think what actually student has opinion about that institution because institution is an abstract person. Number of person and material make institution a living object who is accountable for providing good education. Number of studies are conducted in different discipline and find factors responsible for academic performance. Researchers use structural equation modeling (SEM) to build complex model for structural relationship among latent factors or construct. Structural equation modeling used in this study examines student responses on certain factor which are responsible for building confidence of academic performance in student.
Keywords: Keywords: Education, General, Analysis of Education, Returns to Education, Other.
JEL Classification: I2, I20, I2, I26, I29.
PUBLISHING CHRONOLOGY PAPER SUBMISSION DATE : OCTOBER 13, 2018 ;
PAPERSENTBACKFOR REVISION : NOVEMBER 9, 2018;
PAPER ACCEPTANCE DATE : DECEMBER 10, 2018
Reference to this paper should be made as follows:
Sunil Kumar Tiwari, Archi Dubey (2019),
Sunil Kumar Tiwari*, Archi Dubey**
I
NTRODUCTIONAny nation's development is directly related with education. In this scenario dropping out is one of major concern in the education. Dropout in education is defined in literature as "when student withdraw before completing a course of program. Latif A et.al. (2015) conducted a comparative study on economic effects of student dropout.
Educational institutions are meant for providing education to students. Performing confidence is very important for any student. It gives enthusiasm to engage student in academic activity. Academic performance confidence is one of the most important drive to continue the education in the institution. Several studies organized on prediction of student performance using data mining techniques. These studies also explored factors responsible for poor performance of student at the time of performance. But what is relationship among these factors are not answered.
Behavioral science use statistical modeling techniques to develop model named structural equation modeling (SEM). SEM often work on theoretical constructs knows as latent factor represented by the path showing relationship between these constructs. SEM include multivariate procedures for factor analysis, discriminant analysis, regression analysis etc. The path diagram of model is visualization of statistical model.
In this study impact of school physical environment, guardian interest, study satisfaction and teacher student relationship on academic performance confidence is studied using structural equation modeling.
L
ITERATUREREVIEWStructural equation modeling (SEM) is famous for causal model data analysis. Educational data analysis also using
In a research Lee H W (2011) concluded that traditional approach of data study finds effectiveness of interventions but not psychological construct which affect learners. Thus, latent variable structural equation modeling has advantage over traditional statistical tool. Camgoz-Akdag H et.al. (2012) "introduced a conceptual model of student satisfaction with higher education experience based on the identification of the variable determinants of student perceived quality and the impact of those variables on student satisfaction and/or dissatisfaction with the overall student experience". The model used exploratory and confirmatory factor analysis for strengthens of model.
Sunil Kumar Tiwari*, Archi Dubey**
Kocakaya S et.al. (2014) conducted study "to propose a model for elementary school student from science and mathematics achievements in their school and in Level Determination Exam (SBS) depend on the number of teacher and expert teacher in their school". In the model they used three construct school achievement, SBS achievement and Teacher factor.
Dubey Archi (2018) did a study on higher secondary school teachers morale. In her research she examined affecting factor for morale of the higher secondary which will help government and policymaker for defining the teaching policies construct.
Pawar I A and Lavuri R (2018) conducted a study to understand the relationship between Customer-based brand equity and demographic variable, identifying the determinants of customer-based brand equity and influence of brand in context of banking industry. In their study they concluded that "multiple regression results showed that brand verdict, brand feeling and brand performance have significant influence on the banking customers".
M
EASURESOFF
ITStructural equation modeling literature mention variety of viewpoints and recommendation for a good model. Some of them are:
• Chi Square or CMIN is related with discrepancy function. It is, differ measure of implied moments and sample moments. Higher chi square value indicates poor fit.
• DF is degree of freedom obtained by subtracting sample moments and distinct parameter
• CMIN/DF is ratio of chi square and degree of freedom. Value of CMIN/DF near to 1 indicate correct model. Variety of literature accept different values for acceptable level. Hair [8] mention the threshold of CMIN/DF less than 3 as ideal, 3 to 5 acceptable, above it is not good.
• NFI or normed fit index represents discrepancy between discrepancy value of hypothesized and null model. NFI greater than 0.95 indicates good fit [9].
• TLI or Tucker Lewis Index or non-normed fit index(NNFI) resolves issues of negative bias. The value greater than 0.95 indicate good fit [9].
• CFI or Comparative Fit Index compare proposed model performance with null or baseline model performance which has no correlation between observed variable. CFI value greater than 0.95 is very good fit
• RMSEA or root mean square error of approximation is population discrepancy function. RMSEA value less than 0.05 indicate good fit and 0.05 to 0.1 moderately fit.
Sunil Kumar Tiwari*, Archi Dubey**
• AGFI or adjusted goodness of fit index, adjust GFI using degree of freedom with saturated model [10]. The acceptable value for AGFI is greater than 0.9. [11]
• PRATIO or parsimony ratio represents ratio between number of constraints evaluated with fraction of constraint in the independence model.
R
ESEARCHM
ETHODOLOGYSURVEY INSTRUMENT
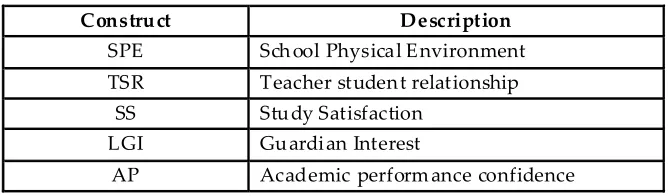
A detailed literature survey studied to find the various factor responsible for academic performance. In this regard faculty, student, parents, educationist and other relevant people's opinion is also taken for the study purpose. Out of the many factor 5 factors are considered for the study. Table shows the list of the variable and description.
Table 1: Construct used for study and their description
Construct Description
SPE Sch ool Physical Environment TSR Teacher student relationship
SS Study Satisfaction
LGI Guardian Interest
AP Academic performance confidence
Source : complied data
To record the responses Likert's scale is used. To measure the all variables 7-point scale is used, where 1 represents "Strongly Disagree" and 7 represents "Strongly Agree".
R
ESEARCHD
ESIGNANDH
YPOTHESISDuring the month of Nov 2017, primary data collected from the student studying at higher secondary school from two District Baloda Bazar (Government Higher Secondary School Lawan, Government managed) and Raipur (Disha college of higher secondary studies, Kota, Raipur, Privately managed) of Chhattisgarh. The survey includes 500 student responses in completing the self-administered questionnaire. Out of these 461 questionnaires were found for the research purpose.
Sunil Kumar Tiwari*, Archi Dubey**
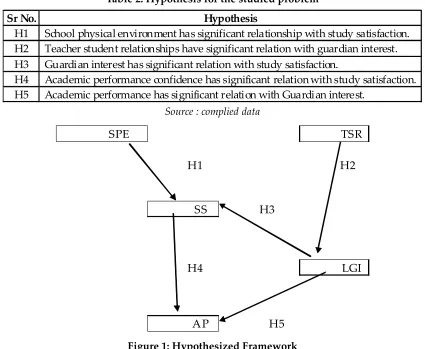
Table 2: Hypothesis for the studied problem
Sr No. Hypothesis
H1 School physical environment has significant relationship with study satisfaction. H2 Teacher student relationships have significant relation with guardian interest. H3 Guardian interest has significant relation with study satisfaction.
H4 Academic performance confidence has significant relation with study satisfaction. H5 Academic performance has significant relation with Guardian interest.
Source : complied data
SPE TSR
H1 H2
SS H3
H4 LGI
AP H5
Figure 1: Hypothesized Framework
A
NALYTICALTOOLANDM
EASUREMENTMODELCollected data analyzed using AMOS 20.0 software and SPSS 20.0. Measurement tool includes AVE, CR, Cronbach's alpha, Chi square, Degree of Freedom(DF), CMIN/DF, NFI etc.
Sunil Kumar Tiwari*, Archi Dubey**
R
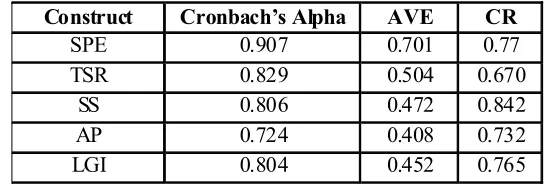
ESULTANDDISCUSSIONFornell C.L. (1981) suggested commonly used criterion to test the latent variables of the model. In the studied constructs the value of Cronbach's alpha is greater than 0.7 that indicates the reliability of the scales. Composite reliability of each construct is greater than 0.7 for each construct. Average variance extracted should be more than 0.5, so in the studied construct only SPE construct. Because of composite reliability is greater than 0.6, average variance extracted up to 0.4 is acceptable (C. Fornell et.al., 1981; C Huang et.al. 2013). Hox J J et.al. (1998) mentioned that ". . a value of at least 0.90 is required to accept a model……However these are just rules of thumb". Thus, all construct fulfills the minimum requirement for the model analysis. The values of the Cronbach's alpha, average variance extracted and composite reliability is shown in table 3.
Cronbach's alpha, average variance extracted and composite reliability for the study has significant value. All the values are above the minimum threshold value. AVE value for SS, AP and LGI below 0.5 but composite reliability is above 0.6, so it is also acceptable (C. Fornell et.al., 1981; C Huang et.al. 2013) for further study.
Path diagram is started with initial relation according to hypothesis and modified by defined method of modification. Initial model had very high chi square value, degree of freedom, CMIN/ DF and other values are far from the significant level. By observing the residual covariance moments and modification indices the model is modified by removing the observed variable which are problematic. The final model gave significant values for the developed model. Threshold value, initial model and final model values are shown in the table 4.
Table 3: Cronbach's Alpha, Average Variance extracted and composite reliability of Latent Variables
Construct Cronbach’s Alpha AVE CR
SPE 0.907 0.701 0.77
TSR 0.829 0.504 0.670
SS 0.806 0.472 0.842
AP 0.724 0.408 0.732
LGI 0.804 0.452 0.765
Source : complied data
Sunil Kumar Tiwari*, Archi Dubey**
Table 4: Initial and final model fit statistics comparison
Parameter of model fit Accepted Threshold Value Initial model Final model
Chi Square Low Chi square 1306.2 328.685
DF - 318 158
CMIN/DF < 3 good and 3 to 5 oderate 4.108 2.08
NFI >0.90 0.783 0.92
TLI >0.90 0.807 0.95
CFI >0.90 0.825 0.96
GFI >0.90 0.806 0.93
RMSEA <0.07 0.082 0.048
AGFI >0.8 0.769 0.91
PRATIO - 0.906 0.83
Source : complied data
F
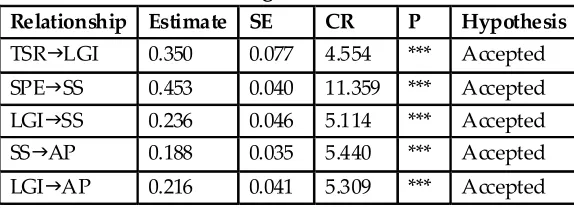
INDINGSThe path analysis result is shown in the table 5. In the study School physical environment and Study satisfaction has path coefficient 0.350, the school physical environment has significant and positive influence on study satisfaction, thus hypothesis H1 is established. In the studied architecture teacher student relationship and guardian interest path coefficient is 0.453, the teacher student relationship has significant and positive influence on guardian interest, thus hypothesis H2 is established.
Guardian interest and study satisfaction has path coefficient 0.236 in the studied model, the guardian interest has significant and positive influence on study satisfaction, Thus, hypothesis H3 is established.
Study satisfaction and academic performance confidence path coefficient is 0.188, the study satisfaction has significant and positive influence on academic performance confidence. Thus, hypothesis H4 is established
Guardian interest and academic performance path coefficient is 0.216, the guardian interest has significant and positive influence on academic performance. Thus, hypothesis H5 is also established in the studied architecture.
Table 5: Path test significant in final model
Relationship Estimate SE CR P Hypothesis
TSRLGI 0.350 0.077 4.554 *** Accepted
SPESS 0.453 0.040 11.359 *** Accepted
LGISS 0.236 0.046 5.114 *** Accepted
SSAP 0.188 0.035 5.440 *** Accepted
LGIAP 0.216 0.041 5.309 *** Accepted
Sunil Kumar Tiwari*, Archi Dubey**
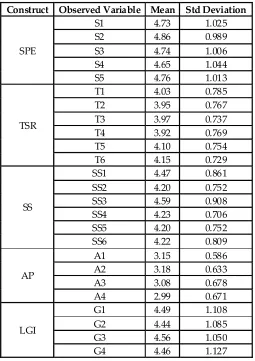
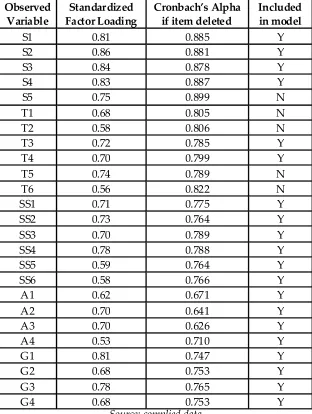
Table 6 contains the observed variable's mean, standard deviation. Table 7 shows the standardized factor loading of observed variable, Cronbach's alpha value if deleted and status of inclusion in the model. These observed variables are used to construct the latent variable. Observed variables S5, T1, T2, T5 and T6 is removed from the study as their factor loading is not significant for the model.
Table 6: Observed variable mean, Standard deviation
Construct Observed Variable Mean Std Deviation
SPE
S1 4.73 1.025
S2 4.86 0.989
S3 4.74 1.006
S4 4.65 1.044
S5 4.76 1.013
TSR
T1 4.03 0.785
T2 3.95 0.767
T3 3.97 0.737
T4 3.92 0.769
T5 4.10 0.754
T6 4.15 0.729
SS
SS1 4.47 0.861
SS2 4.20 0.752
SS3 4.59 0.908
SS4 4.23 0.706
SS5 4.20 0.752
SS6 4.22 0.809
AP
A1 3.15 0.586
A2 3.18 0.633
A3 3.08 0.678
A4 2.99 0.671
LGI
G1 4.49 1.108
G2 4.44 1.085
G3 4.56 1.050
G4 4.46 1.127
Sunil Kumar Tiwari*, Archi Dubey**
Table 7: Standardized factor loading and Cronbach's Alpha value if deleted, Latent variable and inclusion status in the model.
Observed Variable
Standardized Factor Loading
Cronbach’s Alpha if item deleted
Included in model
S1 0.81 0.885 Y
S2 0.86 0.881 Y
S3 0.84 0.878 Y
S4 0.83 0.887 Y
S5 0.75 0.899 N
T1 0.68 0.805 N
T2 0.58 0.806 N
T3 0.72 0.785 Y
T4 0.70 0.799 Y
T5 0.74 0.789 N
T6 0.56 0.822 N
SS1 0.71 0.775 Y
SS2 0.73 0.764 Y
SS3 0.70 0.789 Y
SS4 0.78 0.788 Y
SS5 0.59 0.764 Y
SS6 0.58 0.766 Y
A1 0.62 0.671 Y
A2 0.70 0.641 Y
A3 0.70 0.626 Y
A4 0.53 0.710 Y
G1 0.81 0.747 Y
G2 0.68 0.753 Y
G3 0.78 0.765 Y
G4 0.68 0.753 Y
Source: complied data
L
IMITATIONSOFTHESTUDYSunil Kumar Tiwari*, Archi Dubey**
C
ONCLUSIONOFTHESTUDYPath diagram shown in the figure 1 reflects causal connection among variable. In this paper 5 hypothesis are considered for the study using structural equation modeling, in the table 5 path significant values are shown. All paths estimate and p value are significant and model is fit, so all the hypothesizes are accepted.
It is concluded from the above discussion that, on the student academic performance confidence; school physical environment, teacher student relationship, study satisfaction and guardian interest play a significant role. Thus, an institution, which wants to build academic performance confidence among the students, give attention on school physical environment, teacher-student relationship, study satisfaction and guardian interest.
F
UTUREWORKThis study focused on causal relationship among attribute. In this study behavioral intention used. This intention may change when moderating factors (like gender, age group, family education etc. In future these moderating factors will study to make appropriate policy for education.
R
EFERENCES[1]. Reynaldo, J.A. and Santos, A. (1999) Cronbach's Alpha: A Tool for Assessing the Reliability of Scales. Journal of Extension, 37, 1-4.
[2]. Shrout P.E. and Fleiss J.L. (1979), "Intraclass correlations: uses in assessing rater reliability," Psychological bulletin, vol. 420, no. 2.
[3]. Nunnally J. (1978), Psychometric methods, New York: McGraw, 1978.
[4]. Gefen D, Straub D.W. and Boudreau M.C. (2000), Structural equation modeling and regression: Guidelines for research practice Vol 4 Article 7.
[5]. Fornell C. and Larcker D F (1981), "Evaluating Structural Equation Models with Unobservable Variables and Measurement Error," Journal of Marketing Research, Vol. 18, No. 1, 1981, pp. 39-50. doi:10.2307/ 3151312.
[6]. Huang C, Wang Y, Wu T and Wang P (2013), "An Empirical Analysis of the Antecedents and Performance Consequences of Using the Moodle Platform", International Journal of Information and educational Technology, Vol. 3, No. 2 April 2013 pp 217-221.
[7]. Hair, J. B. (2006). Multivariate data analysis (6th ed.). Uppersaddle River, N.J: Pearson Prentice Hall. [8]. Hu L & Bentler P MPeter M. Bentler (1999): Cutoff criteria for fit indexes in covariance structure analysis: Conventional criteria versus new alternatives, Structural Equation Modeling: A Multidisciplinary Journal, 6:1, 1-55 http://dx.doi.org/10.1080/10705519909540118.
[9]. Tabachnick, B.G. and Fidell, L.S. (2007), Using Multivariate Statistics (5th ed.). New York: Allyn and Bacon.
[10]. Joreskog, K.G. & D.Sorbom (1989) "Liserel 7: A guide to the program and applications", Chicago:SPSS. [11]. Hox J J and Bechger T M (1998), "An Introduction to Structural Equation Modeling", Family Science
Review, 11, 354-373.
Surya Narayana Reddy*, Narayana Reddy**, Viswanatha Reddy***
[13]. Camgoz-Akdag H, Zaim S (2012), "Education: A comparative structural equation modeling study", Procedia - Social and Behavioral Sciences 47, 878.
[14]. Ravens-Sieberre U, Freeman J, Kokonyei G, Thomas C A and Erhart M (2009), "School as a determinant for health outcomes- a strutural equation model analysis", Health Education Vol. 109 No. 4 PP 342-256 ISSN 0965-4283 DOI 10.1108/09654280910970910.
[15]. Kocakaya S and Kocakaya F (2014), "A structural Equation Modeling on Factors of How Experienced Teachers Affect the Students's Science and Mathematics Achievements", Education Research International Volume Article ID 490371 DOI 10.1155/2014/490371.
[16]. Lee H W (2011), "An Application of Laten Variable Structural Equation Modeling For Experimental Research In Educational Technology", The Turkish Online Journal Of Educational Technology, Vol 10 Issue 1 , PP 15-23.
[17]. Dubey, Archi (2018), "What Shape Up Teacher's Morale? A Study among Higher Secondary School Teachers in Balodabazar District of Chhattisgarh", SUMEDHA Journal of Management, Vol. 7 No.1 January-March PP 23-33.