Abstract— The Neural Network based technique has become a most imaginably assertable, a very appealing and an accrual beneficial trend in the recent development of the power system. The objective of this paper is to predict the secure or the insecure state of the power system network using a hybrid technique which is a combination of Artificial Neural Network (ANN) and voltage stability indexes. A Transference Index (TI) has been formulated from the equivalent two-bus network of a multi-bus power system network, which has been tested on a standard IEEE 30-bus system and the result is validated with a standard Fast Voltage Stability Index (FVSI). FACTS devices in the critical bus have been considered for the improvement of the voltage stability of the system. An ANN based supervised learning algorithm has been conferred in this paper alongside Contingency Analysis (CA) for the prediction of voltage security in an IEEE 30 - bus power system network which is very essential from the viewpoint of a power system operator. The proposed scheme can be easily embedded in the master computer of Energy Control Centre (ECC) to predict the current operating condition of the network in terms of voltage security.
Index Term— Feed forward neural networks, load flow, power system stability, static VAr compensators, Smart grids.
I. INTRODUCTION
THE OPERATION of the power utilities can achieve its efficiency and reliability if the following objectives are satisfied [1] :
• Minimization of the reactive power flow so that the resistive and reactive losses are reduced.
• The stability of the system should be enhanced so as to maximize the utilization of the transmission system.
• The terminal voltage of all the equipments in the system should be within the acceptable limits.
The above objectives ensure that the power system network mainly operates for active power. An increase in the load demand or decrease in generation or transmission facilities causes voltage drop, which further reduces the reactive power from the capacitor and line charging, which further reduces the
G..Saha is with Tripura Institute of Technology, Department of Electrical, Narsingarh, Tripura, India (e-mail: [email protected]).
K. Chakraborty, is with Tripura Institute of Technology, Department of Electrical, Narsingarh, Tripura, India, (e-mail: [email protected]).
voltage causing a voltage collapse of the power system network. Thus by controlling the reactive power the voltage profile of the system can be maintained within the acceptable limits which can reduce the transmission losses.
This can be done by the installation of Flexible AC Transmission System (FACTS) devices in the weakest regions of the system which reduces the power flow in heavily loaded lines, improving the stability of the system with reduced production cost [2].A review of the literature imparts that there is a continuous investigation for developing various voltage stability indices by the power system researchers to investigate the various aspects of static load flow analysis and to assess the proximity to voltage collapse of a power system network [3]-[6].
Because of their pattern classification and object recognition capability ANN has been successfully applied in many power engineering problems. Because of the ability of ANN to handle non –linear dependencies ANN has attained increasing importance in the system securities stability assessment. ANN can be applied to problems, for which analytical methods do not yet exist and the networks are easy to maintain.
The objective of the present work is to develop a hybrid technique comprising of Artificial Neural Network (ANN) by a supervised learning algorithm and voltage stability indexes for the prediction of voltage stability state of a power network. For this purpose a new and efficient voltage stability index termed as the Transference Index (TI) has been developed. The effectiveness of the proposed index has been is compared with a standard voltage stability indicator known as Fast Voltage Stability Index (FVSI) [7]. The paper is catalogued as follows: The first stage comprises of the formulation of the proposed Transference Index (TI) and it is used for the voltage stability assessment of a standard IEEE 30-bus system considering contingencies. Ordinarily, in Modern Energy Management Systems (EMS) the well known function is the Contingency Analysis which gives information about the static security of the system to the power system operator [8],[9]. Further FACTS
P. Das is with the Electrical Engineering Department, National Institute of Technology, Agartala, Indis (e-mail: [email protected]).
A Direct Method for Voltage Stability Prediction
on Power Networks using Supervised Learning
Algorithm in Smart Grid Scenario
G. Saha,
Associate Professor, Tripura Institute of Technology, Tripura, India,K. Chakraborty,
Assistant Professor, Tripura Institute of Technology, Tripura, India andP. Das,
Associate Professor, National Institutedevices have been incorporated in the critical bus and its effect on the overall system stability has also been shown in the study. The second stage includes the application of Artificial Neural Network (ANN) to the system for prediction of voltage stability state of the system for any unknown loading patterns of the system [10]-[15]. In the present work multilayer Feed Forward Neural Network (FFNN) i.e. we have used a supervised learning algorithm to estimate the FVSI and TI for various loading configurations of the system. The network was trained using error back propagation learning algorithm i.e. training of the input data set for exploitation by the ANN pattern recognition engine to predict the voltage stability margin. The proposed work can be easily integrated with Energy Control Centre (ECC) so that the operator in the central Energy Management System can be aware of the current status of the network in terms of voltage security.
II. INDICES FORMULATION
A. Formulation of Transference Index (TI)
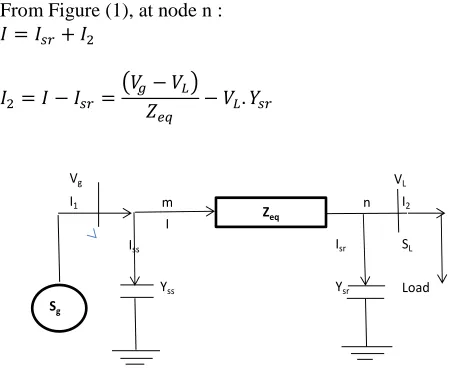
In the proposed equivalent π model of 2-bus network the generated power of slack bus is denoted as Sg = Pg+jQg and that of load bus is SL = PL+jQL. The slack bus voltage is Vg and the power transmission receiving end voltage is VL. The equivalent impedance of the line is Zeq and the power angle in radian is δ. The shunt branch current at the sending end and at the receiving end are Iss and Isr respectively.
From Figure (1), at node n :
𝐼 = 𝐼𝑠𝑟+ 𝐼2
𝐼2= 𝐼 − 𝐼𝑠𝑟=
(𝑉𝑔− 𝑉𝐿)
𝑍𝑒𝑞 − 𝑉𝐿. 𝑌𝑠𝑟
Fig. 1. Equivalent π model of 2-bus network for the proposed methodology
Again, 𝐼2=𝑆𝑉𝐿
𝐿
∴ 𝑆𝐿 𝑉𝐿=
(𝑉𝑔− 𝑉𝐿)
𝑍𝑒𝑞 − 𝑉𝐿. 𝑌𝑠𝑟
⇒ 𝑆𝐿=
1
𝑍𝑒𝑞. 𝑉𝐿. (𝑉𝑔− 𝑉𝐿) − 𝑉𝐿 2. 𝑌
𝑠𝑟
⇒ −𝑉𝐿2. 𝑌𝑠𝑟+𝑍1
𝑒𝑞. 𝑉𝐿. (𝑉𝑔− 𝑉𝐿) − 𝑆𝐿= 0 (1)
Arranging (1) gives the quadratic equation for the receiving end bus which is given by,
−𝑉𝐿2. (𝑌𝑠𝑟+𝑍1
𝑒𝑞) +
1
𝑍𝑒𝑞. 𝑉𝑔. 𝑉𝐿− 𝑆𝐿= 0 (2) In order to maintain real roots of 𝑉𝐿 , the discriminant of (2)
must be greater than or equal to zero. Equation (2) is in the form of ax2+bx+c=0, hence b2-4ac ≥ 0. After rearranging the equation is given as
𝑉𝑔2
𝑍𝑒𝑞2 − 4𝑆𝐿.
(𝑌𝑠𝑟.𝑍𝑒𝑞+1)
𝑍𝑒𝑞 ≥ 0 (3)
𝑉𝑔2≥ 4𝑆𝐿. (𝑌𝑠𝑟. 𝑍𝑒𝑞+ 1)𝑍𝑒𝑞 (4)
𝑇𝐼 =4𝑆𝐿.(𝑌𝑠𝑟.𝑍𝑒𝑞+1)𝑍𝑒𝑞
𝑉𝑔2 ≤ 1 (5)
Taking j as the receiving end bus and i as the sending end bus the Transference Index for any transmission line is given by,
𝑇𝐼𝑖𝑗=
4𝑆𝑗.(𝑌𝑠𝑟(𝑖𝑗).𝑍𝑖𝑗+1)𝑍𝑖𝑗
𝑉𝑖2 ≤ 1 (6)
where 𝑌𝑠𝑟(𝑖𝑗)= 𝑗 ( −𝑋𝑖𝑗
𝑅𝑖𝑗2 +𝑋𝑖𝑗2)
2
and R , X, Z are the resistance, reactance and impedance of the transmission line respectively. Ysr is the equivalent line charging susceptance.
Accordingly (6) exhibits that if the Transference Index(𝑇𝐼𝑖𝑗 )
for any transmission line is close to 1.0 then that particular line will be approaching towards instability point which may lead to system violation. Hence, in order to retain the stability of the system, TI should be maintained less than unity.
B. Fast Voltage Stability Index (FVSI)
The line stability index FVSI was first introduced by Dr. Ismail Musirin (et al) in 2002 which is based on two-bus equivalent network [7]. The calculation is done from the concept of power flow through a transmission line and is formulated as given below
𝐹𝑉𝑆𝐼𝑖𝑗 = 4𝑍2𝑄𝑗
𝑉𝑖2.𝑋 ≤ 1 (7)
where Z and X are the impedance and reactance of the line respectively. 𝑉𝑖 is the sending end voltage and 𝑄𝑗 is the
receiving end reactive power flow. Modeling of Static VAr Compensator
A Static VAR Compensators a set of electrical devices for providing fast acting reactive power of high voltage electricity transmission networks. SVC’s are part of the Flexible AC Vg
I1 m n I2
I
Isr SL
Yss Ysr Load
VL
Iss
Sg
Transmission system (FACTS) device family, which provides fast regulation of voltage and power factor, also provides voltage support during contingency events which would otherwise exhaust the voltage for an eloquent period of time. The SVC is also helpful in damping of power swings and reduction in transmission losses by reactive power control. The modelling of SVC is done with the help of reactors and capacitors which are controlled by thyristor valves in parallel with a fixed capacitor bank. In a transmission line it is connected in parallel through a shunt transformer. The first use of static var compensators in EHV/UHV transmission started in the 1960s and was based on saturated reactors. The first switched compensators were installed in the late 1970s. Since that time the use of SVC has become very popular to replace synchronous compensation (using synchronous phase modifiers).
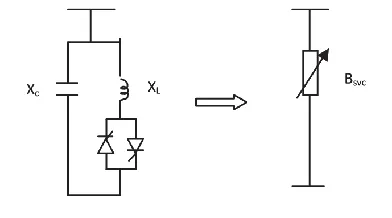
Fig. 2. SVC firing angle model
Fig. 2 represents the SVC firing angle model [16]. In practice the SVC can be seen as an adjustable reactance with either firing angle limits or reactance limits. The equivalent circuit of the SVC is used to derive the SVC non-linear power equations and the linearized equations required by Newton’s Method.
The magnitude of the SVC susceptance 𝐵𝑆𝑉𝐶 [16] is a function of the firing angle α and is obtained as
𝐵𝑆𝑉𝐶 =
2𝜋 − 2𝛼 + 𝑠𝑖𝑛2𝛼 𝜋𝑋𝑠 𝑓𝑜𝑟 0
°≤ 𝛼 ≤ 90°
Accordingly 𝐵𝑆𝑉𝐶 is controllable using SVC at any node of
the power network. The current drawn by the SVC is given by
𝐼𝑆𝑉𝐶= 𝑗𝐵𝑆𝑉𝐶. 𝑉𝑘
Assuming the SVC being connected at the kth bus. The reactive power drawn by the SVC injected at bus k is obtained as
𝑄𝑆𝑉𝐶 = −𝑉𝑘2. 𝐵𝑆𝑉𝐶
Where 𝑉𝑘 is the kth bus voltage. The changing susceptance represents the total SVC susceptance necessary to maintain the nodal voltage magnitude at the specified bus. Once the level of compensation is computed, then the thyristor firing angle can be calculated. However, the additional calculation requires an iterative solution because the SVC susceptance and the thyristor firing angle are non-linearly related. The reactive power is a function of the square of the bus voltage. Hence, with the decrease in the voltage the generated reactive power also decreases.
The SVC impedance is initialized at the resonance point i.e. XTCR = XC when QSVC = 0 which corresponds to a firing angle of 108o and the parameters adopted are X
L = 0.0129 p. u and XC = 0.0406 p. u. Thus the maximum reactive power which the SVC can inject is 0.246 p .u. i.e. 24.6 MVar.
III. AMALGAMATION OF THE PROPOSED METHODOLOGY WITH SMART GRID SCENARIO
In modern Smart Grid Scenario, Energy Control Centre (ECC) forms an intrinsic part which promotes an appropriate way to monitor and share the ANN database with the supervising control and data acquisition system within the Energy Management System for online applications [17]-[18].
Fig. 3. Framework of ECC
Fig. 3 shows the framework of Energy Control Centre (ECC) incorporating the ANN based monitoring system. Thus whenever there exists any voltage issue within the system, the ANN based module will immediately contact the Intelligent Controller to generate a response that would attenuate the problem to power system operators for taking necessary remedial actions. Henceforth, the ECC will send control signals to various reactive power capable devices for recuperative control action against forthcoming voltage instability, voltage collapse problem and large scale blackouts.
IV. SIMULATION AND DISCUSSION
The proposed Voltage stability Indices have been tested on a standard IEEE 30-bus system. The static power flow analysis is done by the Newton Raphson method in Matlab software to identify the weakest, weaker and the weak bus of the system using 𝑑𝑄𝑖
𝑑𝑉𝑖 (reactive power sensitivity) indicator which is shown
in Table I.
TABLEI STABILITY RANKING OF BUSES
Bus No. dQi/dVi value Ranking
13 1.7207 Weakest
2 2.8623 Weaker
5 3.4766 Weak
Control signals Input informations
from Power Network
Substation
RTU's SCADA
Energy Management System
Proposed ANN based voltage stability assessment
Table I indicates that bus no. 13 is the critical bus of the system with the smallest value of 𝑑𝑄𝑖
𝑑𝑉𝑖 and the next smaller value
is of bus no.2 which is the weaker bus and bus no.5 is the weak bus of the system. Since low value of dQ/dV means dV/dQ will be high, indicating large change in voltage for variation of the reactive power of the bus.
A. Interpretation of TI and FVSI on IEEE 30-bus system The proposed Transference Index (TI) is now coordinated to the various transmission lines of the IEEE 30-bus system and its performance are compared with the standard Fast Voltage Stability Index (FVSI). From (6) and (7) it is clear that the transmission lines having values of TI and FVSI close to unity will be more recumbent to instability than those having lesser values. Consequently, based on the maximum values of TI, the ranking of different transmission lines has been made under heavy loading of the critical bus i.e. bus no. 13 and concealing the other buses fixed at their respective base loads. The effect on the value of TI with the embodiment of SVC in the critical bus has also been depicted. The ranking of different transmission lines is then compared with the standard FVSI values under heavy loading condition of the critical bus. The values of TI with and without the placement of SVC in the critical bus for various transmission lines have also been compared with the values of FVSI . The comparison has been depicted in Table II and Table III.
Table II demonstrates the values of TI and FVSI for a particular transmission line when the critical bus is heavily loaded without any inclusion of SVC. It depicts that the values of both the indexes (TI and FVSI) are higher for the transmission line 38 which shows that line 38 is more vulnerable to voltage collapse in the system. When the proposed TI is compared with the standard FVSI it shows that the ranking of the transmission lines are similar to both the indexes which justifies the feasibility of the proposed TI.
TABLEII
RANKING OF TRANSMISSION LINES WITHOUT SVC FOR HEAVILY LOADED
CRITICAL BUS 13 Loadin
g at critical bus 13
Line From To TI FVSI Rank
P = 0.35 Q = 0.023
38 11 2 0.3748 0.0685 1 39 5 2 0.2957 0.0540 2 20 14 15 0.1120 0.0461 3 27 10 21 0.0784 0.0424 4 37 11 5 0.0614 0.0234 5 26 10 17 0.0445 0.0223 6 19 12 16 0.0381 0.0175 7 4 3 4 0.0134 0.0028 8
Table III demonstrates the effect on the values of TI and FVSI by placing an SVC at the critical bus. It is observed that for the same loading on the critical bus the stability of the system with both the proposed TI and FVSI has improved as there is a decrease in the values of TI and FVSI for the respective transmission lines. Again the expediency of the proposed Transference Index (TI) has been established.
A study has been made on how the index values change with the change in load. This is done by changing the active load on the critical bus no. 13, keeping the load on other buses fixed at their respective base loads. Initially the test is started from the base value of P or active load and is gradually increased in steps of 5% of the base value for line 39 until the system fails to converge and the values of TI and FVSI are computed. Line no. 39 has been chosen as it comprises of both the weaker and the weak bus. The steps are being repeated by connecting an SVC in the critical bus 13.
TABLEIII
RANKING OF TRANSMISSION LINES WITH SVC FOR HEAVILY LOADED
CRITICAL BUS 13 Loadin
g at critical bus 13
Line From To TI FVSI Rank
P = 0.35 Q = 0.023 with SVC
38 11 2 0.3533 0.0646 1 39 5 2 0.2528 0.0462 2 20 14 15 0.1100 0.0451 3 27 10 21 0.0746 0.0403 4 37 11 5 0.0579 0.0222 5 26 10 17 0.0424 0.0210 6 19 12 16 0.0366 0.0168 7 4 3 4 0.0133 0.0028 8
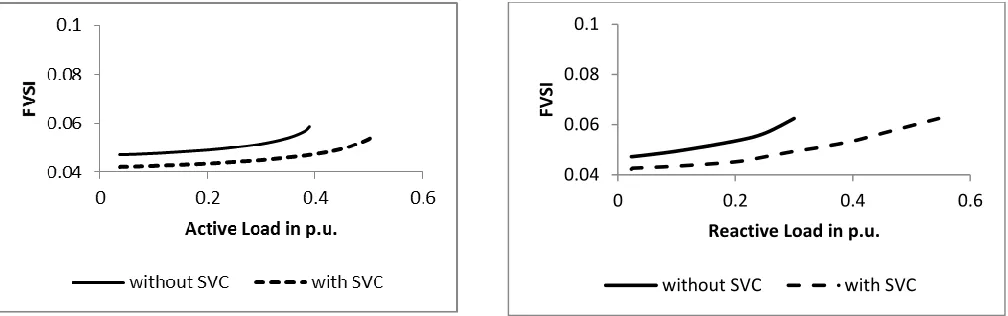
Fig. 5. Plot of FVSI against active power loading for line39 Fig. (4) and Fig. (5) divulges the plotting of proposed TI and FVSI with and without the incorporation of SVC at bus 13 against active or P loading in bus 13 for transmission line 39.
If a comparison is being made between Fig. (4) and Fig. (5) it can be manifested, that the value of FVSI is reduced by a small amount with the application of SVC whereas the value of the proposed TI is greatly reduced with the application of SVC. Moreover it can be concluded that the stability margin of the system can be easily diagnosed from the values of the proposed TI and FVSI. Since in the proposed methodology the effect of line charging susceptance has been considered through π model of the equivalent circuit, the efficiency and stability of the system increases by reducing the power losses. Also the power factor of the system improves which reduces the KVA drawn from the supply.
Fig. 6. Plot of TI against reactive power loading for line 39
Fig. 7. Plot of FVSI against reactive power loading for line 39
Similarly, the proposed TI and FVSI values can be computed by increasing the Q or reactive power loading of bus 13 keeping the P load fixed at the base value till the system collapses. Fig. (6) and Fig. (7) shows the variation of the proposed TI and FVSI against Q loading of critical bus 13 with and without the application of SVC at bus 13.
TABLEIV
CHANGES IN THE CRITICAL VALUES FOR IEEE30– BUS SYSTEM DUE TO SVC
Critical
Parameters Without SVC With SVC
Pcri 0.39 0.51
Qcri 0.3 0.546
Table IV shows that the P loading and Q loading of the system has increased due to placement of SVC at the critical bus 13. The active power loading has been increased by 0.12 p .u. and the reactive power loading has been increased by 0.246 p .u.
V. ANN ARCHITECTURE
A Feed Forward Neural Network (FFNN) was the first and simplest type of Artificial Neural Network (ANN) improvised. In this network the information moves unidirectionally in the forward direction starting from the input nodes through the hidden nodes and finally to the output nodes [17] – [21]. Fig. 8 shows the architecture of Feed Forward Neural Network (FFNN).
0.2 0.4 0.6 0.8 1
0 0.2 0.4 0.6
Tr
an
fer
e
n
ce
In
d
e
x(TI)
Reactive Load in p.u.
without SVC with SVC
0.04 0.06 0.08 0.1
0 0.2 0.4 0.6
FV
SI
Reactive Load in p.u.
Fig. 8. Architecture of FFNN
A. Supervised Learning Algorithm
The FFNN uses a supervised learning algorithm. The learning comprises of a pattern presented at the inputs which gets transformed in its passage through the layers of the network till it reaches the output layer. The outputs of the network are then compared with the outputs as they ideally would have been if this pattern were classified correctly. In this paper multilayer FFNN learning algorithm has been used which uses the technique of back propagation. Often we use the term back propagation because the differences between the actual and the idealized outputs are back propagated from the top to the lower layers to compute some predefined error function. After performing many epochs and at the termination of the learning phase, the neural network will be able to generalize and classify correctly any unknown pattern conferred to it and the network has learned a certain target function.
B. ANN Training and Exploitation
The process of finding a set of weights such that for a given input the network produces the desired output is called training. The network was trained with “error back propagation” supervised learning algorithm. The trained network is exploited to predict the Transference Index indicator value. “Tansig” and “purelin” transfer functions were used during training of network. In this study the training of the input data set is done on different configurations of the system based on the base configuration of the system and heavy loading on the weaker sections of the system. It also includes single and double outages of transmission lines, generator outages, placement of SVC in the critical bus and the corresponding TI and FVSI values were calculated under all the probable loading and system patterns. This has come up with the generation of 15 different system topologies, 20 different combinations of bus loading and altogether 2100 samples of data. Each data having its own topology code, active and reactive power loading and the correspondent TI and FVSI values.
After the termination of training, learning algorithm of the data set, the ANN architecture is finally optimized for 7 input layer neurons i.e. the voltage of the weak bus, P loading and Q loading of the weak, weaker and weakest buses, 4 hidden layer neurons and 2 output layer neurons using the target TI and FVSI data. Table V shows some sample data set both for target and input neurons used for training. The classification capability of the proposed ANN is checked into thoroughly by using 350 epochs. The execution of the ANN was tested on IEEE 30-bus system for 10 unknown loading patterns by computing the error for every testing pattern. The error is fabricated by correlating the actual values of TI and FVSI with the ANN generated values of TI and FVSI and the enumerated test results are given in Table VI.
TABLEV
SAMPLE DATA SET FOR TRAINING
Target Input
TI FVSI V P13 Q13 P2 Q2 P5 Q5
0.2532 0.0462 0.9768
-0.0350 -0.0230
-0.1060 -0.0 190 -0.0240 -0.0 090
0.2589 0.0473 0.9659
-0.0350 -0.0230 -0.1060 -0.0 190 -0.0240 -0.0 090
0.2319 0.0423 1.0207
-0.0350 0.2230 -0.1060 -0.0 190 -0.0240 -0.0 090
0.2573 0.0470 0.9689
-0.0350 -0.0230 -0.1060 -0.0 190 -0.0240 -0.0 090
0.2365 0.0432 1.0106
-0.0350 0.2230 -0.1060 -0.0 190 -0.0240 -0.0 090
0.2318 0.0421 1.0208
-0.0350 0.2230 -0.1060 -0.0 190 -0.0240 -0.0 090
0.2956 0.0540 0.9040
-0.3500 -0.0230 -0.1060 -0.0 190 -0.0240 -0.0 090
0.3081 0.0562 0.8855
-0.3500 -0.0230 -0.1060 -0.0 190 -0.0240 -0.0 090
0.2549 0.0465 0.9734
-0.0350 -0.0230 -0.1060 -0.0 190 -0.0240 -0.0 090
0.2560 0.0468 0.9713
-0.0350 -0.0230 -0.1060 -0.0 190 -0.0240 -0.0 090 TABLEVI
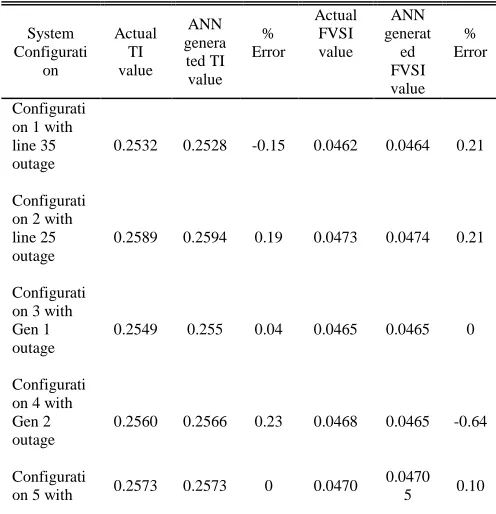
ACCURACY OF THE PROPOSED ANNPATTERN ENGINE
System Configurati on Actual TI value ANN genera ted TI value % Error Actual FVSI value ANN generat ed FVSI value % Error Configurati on 1 with line 35 outage
0.2532 0.2528 -0.15 0.0462 0.0464 0.21
Configurati on 2 with line 25 outage
0.2589 0.2594 0.19 0.0473 0.0474 0.21
Configurati on 3 with Gen 1 outage
0.2549 0.255 0.04 0.0465 0.0465 0
Configurati on 4 with Gen 2 outage
0.2560 0.2566 0.23 0.0468 0.0465 -0.64
Configurati
on 5 with 0.2573 0.2573 0 0.0470
line 11 & 22 outage
Configurati on 6 with SVC in critical bus
0.2319 0.2314 -0.22 0.0423 0.0422 -0.24
Configurati on 7 with SVC in the critical bus and line 14 outage
0.2365 0.2365 0 0.0432 0.0432 3 0.07
Configurati on 8 with SVC in the critical bus and line 23 outage
0.2318 0.232 0.09 0.0421 0.0422 0.23
Configurati on 9 with heavy load in the critical bus and line 23 outage
0.2956 0.2953 -0.10 0.0540 0.0540 0
Configurati on 10 with heavy load in the critical bus and Gen 2 outage
0.3081 0.3076 -0.16 0.0562 0.0561 -0.19
From Table VI it is observed that the most contingent configured is No. 10, i . e, the configuration10 with heavy load on the critical bus when Generator 2 is tripped because in this condition both the values of TI and FVSI is maximized. While the minimum values of TI and FVSI are at Configuration 8 with SVC in the critical bus and line 23 outage, which is least contingent configuration. Table VI also demonstrates the accuracy and reliability of this ANN based pattern recognition engine. From Table VI it is experienced that the error in estimation lies between +0.23 to -0.64, which is brilliant and sufficient for this purpose.
VI. CONCLUSION
A methodology for monitoring and predicting of voltage stability state of a multi bus power system network has been conferred in this paper using ANN based pattern classification engine. The proposed Transference Index (TI) has been formulated from a two bus equivalent network and tested on IEEE-30 bus system. Simulation results also show that embodiment of a compensating device at the critical bus dynamizes the overall system stability. Further ANN has been exploited to anticipate the voltage security state of the system with the aid of the proposed index. The proposed technique has
been tested on IEEE 30-bus system and its workability are shown in both learning and training stages of ANN. The procedure depicted in this paper has shown a high degree of factualness between the targeted and the ANN output. After training only a few seconds are required to predict the output during the verification stage. The proposed approach has thus proved to be efficient, precise and fast for the computation of the TI i. e the stability state of the system for any unknown loading patterns and contingencies which will help the power system operator.
The main advantage of the proposed method is that, in real time for a particular operating condition when the input information are provided to the proposed ANN based network it will immediately give the output i.e. the indicator Transference Index (TI) value from which the system operator would be conscious about the system condition and accordingly he/she will take necessary action if required.
VII. REFERENCES
[1] I. O. Akwukwaegbu , O. Gerald Ibe, “Concepts of Reactive Power Control and Voltage Stability Methods in Power System Network”, IOSR Journal of Computer Engineering ,Vol .11,Issue 2(May-June.2013), pp.15-25 [2] G. Saha, K. Chakraborty and P .Das , “Detection of Proximity to Voltage
Collapse of Multi-Bus Power Network using Transmission Line Voltage Stability Indicator.” , ARPN Journal of Engineering and Applied Sciences, vol. 11, no. 17, September 2016, pp. 10689-10694.
[3] J. G .Singh, S .N .Singh and S. C. Srivastava, “Placement of FACTS controllers for enhancing power system load ability”, IEEE Trans. on Power delivery,Vol.12, No.3, July2006
[4] P. Pourbeik, P. Kundur and C. W. Taylor, “The anatomy of a power grid blackout – Root causes and dynamics of recent major blackouts,” IEEE Power and Energy Magazine, pp.22-29, Sept.-Oct.2006
[5] P. Kundur, “Power System Stability and Control ” , New York:McGraw-Hill,1994
[6] P. A. Lof, G. Anderson and D. J. Hill, “Voltage Stability Indices for stressed power systems”, IEEE Trans. Power Syst.,Vol.8 No.1, pp.326-335, 1993
[7] A. Chakraborty, S. Dey and C.K. Chanda ,“Development of Unique network equivalencing technique for determining voltage stable states in a multi-bus longitudinal power system using load flow analysis”, IE(I) Journal EL,Vol.85,pp.196-202,March2005
[8] I. Musirin and T. K .A. Rahman ,“Novel Fast Voltage Stability Index(FVSI) for voltage stability analysis in Power Transmission System”,2002 Student Conference on Research and Development Proceedings, Shah Alam,Malasia,July2002
[9] T. Mandloi and A. K Jain ,“A Study of Power System Security and Contingency Analysis”, IJSRET, Vol.3, Issue4,July2014
[10] A. naaz, L. Sayyed, P. M. Gadge and R. U. Sheikh, “Contingency Analysis and Improvement of Power System Security by locating FACTS Devices “TCSC and TCPAR” at Optimal Location”, IOSR Journal of Electrical and Electronics Engineering , p- ISSN : 2320-3331, pp.19-27,2014
[11] K. Chakraborty and G. Saha, “Off-Line Voltage Security Assessment of Power Transmission Systems using UVSI through Artificial Neural Network.”, 2016 IEEE, vol. 978-1-5090-2638-8/16, pp. 159-163. [12] K. Chakraborty, A. Chakrabarti and A. De, “A combined ANN-IVSI
approach for assessment of voltage stability in a power system.” IJMRAE, Vol.3, No. I (January 2011), pp.197-212
[13] S. Kanalaasadan , A. K .Srivastava and D. Tukaram , “Novel Algorithm for Online Voltage Stability Assessment based on Feed Forward Neural Network”, IEEE Trans. On Power Engineering Society General Meeting, pp.1-7, 2006.
voltage stability indicators.” Journal of Electrical Systems 6-4(2010):517-529
[15] O. P. Rahi , A. Kr Yadav , H. Malik, A. Azeem and B. Kr,“ Power system voltage stability Assessment through Artificial Neural Network.” ELSEVIER Procedia Engineering Vol. 30(2012), pp. 53-60
[16] K. Chakraborty, A. De and A. Chakraborty , “Voltage Stability Assessment in Power Network using Self Organizing Feature Map and Radial Basis Function”, Computers and Electrical Engineering, Elsevier, Vol.-38, No. – 4, pp. 819-826, July 2012.
[17] K. Chakraborty, A. Chakraborti and A. De, “Integrated Voltage stability indicator based Assessment of voltage stability and application of ANN.” Iranian Journal of electrical and Computer Engineering, Vol.10, No.2,Summer-Fall 2011.
[18] J Zhu, D Hwang and A Sadjadpour ,“Real Time Congestion Monitoring and Management of Power Systems,” IEEE/ PES Transmission and Distribution Conference & Exhibition, Asia and Pacific Dalian, China, 2005.
[19] VS Vankayala and ND Rao, “Artificial Neural Networks and their applications to power systems-a bibliographical survey,” Electric Power Systems Research, 1993, pp. 67-19.
[20] P Kessel and H Glavitch, “Estimating the voltage stability of a power system,” IEEE Transactions on Power Delivery, 1986, PWRD-1(3), pp. 346-354.
[21] A.M.A. Haidar, M. Azah and H. Aini,“ Vulnerability Assessment of a Large Sized Power System using Neural Network Considering Various
Feature Extraction Methods,” Journal of Electrical Engineering and Technology, Vol. 3, pp. 167-176, 2008.