e-ISSN: 2278-067X, p-ISSN: 2278-800X, www.ijerd.com
Volume 11, Issue 10 (October 2015), PP.06-15
Effect of Hydrogen as a fuel source in IC Engines
Manasa Tripuraneni
1, K.Bogeshwaran
2, K.Viswanath
31Assistant Professor, Department of Mechanical Engineering, Chalapathi Institute of Technology, Guntur. 2Assistant Professor, Department of Petroleum Engineering, Dhaanish Ahmed College of Engineering, Chennai
.3Chalapathi Institute of Technology, Guntur
Abstract:- Hydrogen is the next targeted alternate fuel in the upcoming decade. Being available abundantly, it can prove to be a potential resource in combustion engines to produce useful work with less impact compared to conventionally used fuels that pollute our environment. This study enumerates in short, the different ways to produce hydrogen from conventional methods and more importantly the use and effect of hydrogen in Internal Combustion Engines. Fuel properties and emission analysis have been discussed. Properties like Thermal efficiency, Start Of Combustion (SOC), Volume efficiency are studied briefly. This study would give an overall comparison of Hydrogen effect on combustion engines.
Keywords:- H2 fuel, emission of H2 fuel, H2 performance in IC engines, zero COX emission, less SOI & SOC
I.
INTRODUCTION
Hydrogen is the most abundant element in the universe and it is the third most abundant element on the surface of the globe. It can be used as a major source of energy. Hydrogen is an energy carrier that can be used in IC engines. Hydrogen production has been directed largely towards the petrochemical industries, oil refineries (production of methanol), or basic chemical industry (production of ammonia). With the need to find an alternative energy to replace, at least partially and progressively to fossil fuels in the near future, hydrogen is emerging as the most viable and advantageous option among those that are available, although not without complications. In recent years, we have witnessed a dramatic increase in research activity focused on the development of economically viable technologies for hydrogen production, driven by the possibility of incorporating hydrogen as fuel in electric vehicles called by "fuel cells", have experimented a strong technological evolution in the recent past, and its efficiency has ceased to be the main obstacle for development in the near future of hydrogen-powered commercial vehicles. In this sense the problems are more focused on the handling and storage of Hydrogen, than the vehicles themselves. When combustion takes place, no green house gases will be emitted. Different methods like steam reforming, solar hydrogen systems are available for hydrogen production.
The advantages of hydrogen as an energy source, not only reside in the fact that virtually inexhaustible raw material, the heat of combustion with oxygen (14.19 × 10⁴ kJ / kg) is far superior to traditional fossil fuels such as gasoline ( 4.5 × 10⁴ kJ / kg) but water vapour, making it an ideal candidate for reducing the "greenhouse effect".
II.
PROPERTIES
OF
HYDROGEN
The physical, chemical and thermodynamic property of hydrogen has been listed below. A. Physical Properties of Hydrogen
Table I. Physical Properties of Hydrogen
B. Chemical Properties of Hydrogen
Hydrogen is not exceptionally reactive, although hydrogen atoms react with all other elements with the exception of noble gases. Hydrogen oxidizer release electronegative elements and reduces more Electro negative ones. The strength of the H – X bond in covalent hydrides depends on the Electro negativity and size of the element X. The strength decreases in a group with increasing atomic number and generally increases across any period. The most stable covalent bond are those formed between two hydrogen atoms, or with hydrogen, oxygen carbon and nitrogen.
PROPERTY HYDROGEN
Melting point / K 13.96
Boiling point/ K 20.39
Density / gL–1 0.09
Compressibility Factor Z= at 0 C 1.0005
Adiabatic Compressibility at 300K , Mpa 7.03
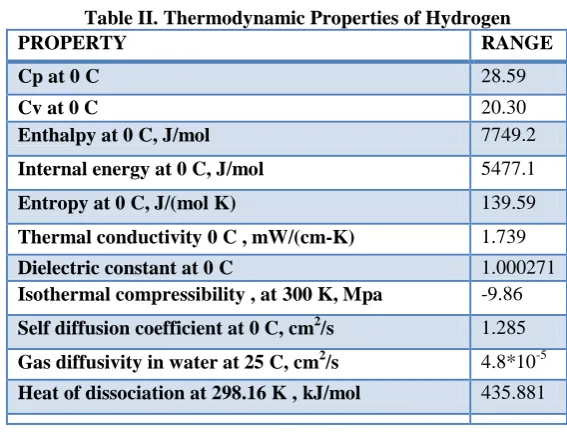
C. Thermodynamic Properties of Hydrogen
Table II. Thermodynamic Properties of Hydrogen
PROPERTY RANGE
Cp at 0 C 28.59
Cv at 0 C 20.30
Enthalpy at 0 C, J/mol 7749.2
Internal energy at 0 C, J/mol 5477.1
Entropy at 0 C, J/(mol K) 139.59
Thermal conductivity 0 C , mW/(cm-K) 1.739
Dielectric constant at 0 C 1.000271
Isothermal compressibility , at 300 K, Mpa -9.86
Self diffusion coefficient at 0 C, cm2/s 1.285
Gas diffusivity in water at 25 C, cm2/s 4.8*10-5
Heat of dissociation at 298.16 K , kJ/mol 435.881
Combustive Properties of Hydrogen
Hydrogen has a wide Range of Flammability, Low Ignition Energy, Small Quenching Distance, High Auto ignition Temperature, High Flame Speed, High Diffusivity, Low Density.
III.
HYDROGEN
PRODUCTION
METHODS
The method of producing Hydrogen has been tabulated in table III.
Table III. Methods of Hydrogen production
Method Process Implementation Advantages Disadvantages
Steam reforming of methane gas
In presence of nickel catalyst & at 700 – 1100 °C:
CH4(g) + H2O(g) = CO(g) + 3H2(g)
Next reaction at lower temperature: CO(g) + H2O(g) = CO2(g) + H2(g)
Current major source of hydrogen
65 – 75% efficiency, Economical (least expensive method), Established infrastructure Nonrenewable resource produces CO2
emissions
Hydrogen from coal (Gasification)
At high temperature and pressure: Coal + H2O(g) + O2(g) = syngas
Syngas = H2 + CO + CO2 + CH4
Current method of mass hydrogen production
Large supplies of coal in US. Inexpensive resources
Produces CO2
emissions. Carbon sequestration would raise costs 45% efficiency
Electrolysis of water
Electric current passed through water:
2H2O(l) = 2H2(g) + O2(g)
Not in widespread use due to cost of electricity
Depend on electricity source
Input into production may require more energy than released. Produces CO2
emissions if coal is energy source
Solar – Hydrogen system
Electric current passed through water:
2H2O(l) = 2H2(g) + O2(g)
Not in widespread use due to cost of renewable energy sources
No emissions 65% efficiency
Expensive
IV.
HYDROGEN
EFFECTS
IN
INTERNAL
COMBUSTION
ENGINES
A. Influence of LPG-reformate and H2 on a dual fuelled engine
The engine is a single cylinder research diesel engine as given in the table IV.
Table IV. Engine specification Engine specification Data
No. of cylinders 1
Bore / Stroke 98.4 mm / 101.6 mm
Connecting rod length 165 mm
Displacement volume 773 cm3
Compression ratio 15.5:1
Rated power (kW) 8.6@2500 rpm
Peak torque (Nm) 39.2@1800 rpm
Injection system Three hole direct injection
Engine piston Bowl-in-piston
An electric dynamometer with a motor, Kistler 6125B with Kistler 5011 transducer along with LabVIEW based software is used as described [1]. Thermocouples, pressure gauges and engine test bed safety features were also included. IMEP , %COV, ROHR have been analysed.
Analysis techniques used: Horiba MEXA 7100DEGR emissions analyser (CO2) , NDIR(CO) , magneto-pneumatic detection (O2), chemiluminescence detection(oxides of N2) , flame ionization detector / multigas 2030 FTIR (HC), AVL 415S smoke meter(soot content), SMPS (particle size distribution) techniques were used to analyse the components present.
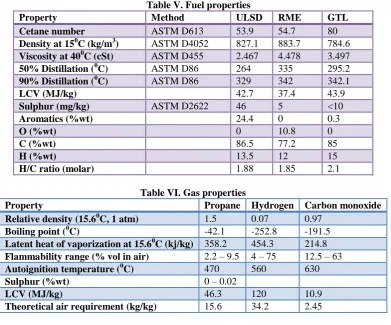
Fuels used & their properties: Ultra low sulphur diesel(ULSD), rapeseed methyl ester (RME) and gas-to-liquid (GTL), Bottled gaseous fuels (i.e. LPG, H2, and CO) were used to simulate LPG-reformed gas. The LPG composition used was 100% propane (C3H8)
Their properties are tabulated in Table V and VI.
Table V. Fuel properties
Property Method ULSD RME GTL
Cetane number ASTM D613 53.9 54.7 80
Density at 150C (kg/m3) ASTM D4052 827.1 883.7 784.6
Viscosity at 400C (cSt) ASTM D455 2.467 4.478 3.497
50% Distillation (0C) ASTM D86 264 335 295.2
90% Distillation (0C) ASTM D86 329 342 342.1
LCV (MJ/kg) 42.7 37.4 43.9
Sulphur (mg/kg) ASTM D2622 46 5 <10
Aromatics (%wt) 24.4 0 0.3
O (%wt) 0 10.8 0
C (%wt) 86.5 77.2 85
H (%wt) 13.5 12 15
H/C ratio (molar) 1.88 1.85 2.1
Table VI. Gas properties
Property Propane Hydrogen Carbon monoxide
Relative density (15.60C, 1 atm) 1.5 0.07 0.97
Boiling point (0C) -42.1 -252.8 -191.5
Latent heat of vaporization at 15.60C (kj/kg) 358.2 454.3 214.8
Flammability range (% vol in air) 2.2 – 9.5 4 – 75 12.5 – 63
Autoignition temperature (0C) 470 560 630
Sulphur (%wt) 0 – 0.02
LCV (MJ/kg) 46.3 120 10.9
Engine is maintained at 3 and 5 bar IMEP at 1500rpm. 0.2, 0.5, 1% concentrations of LPG has been fed of the total volumetric intake to form reformate.
B. Effect of Hydrogen-diesel fuel co-combustion
A Single cylinder, direct injection, compression ignition research engine with the below tabulated specification was used, table 7. Kistler 6056A pressure transducer with Kistler 5018 charge amplifier. Druck piezoresistive pressure transducer along with LabVIEW program has been used. Air supply to the engine was measured by positive displacement volumetric flow meter, Delphi DFI 1.3 servo-hydraulic solenoid valve fuel injector along with Emtronix engine control system (EC-GEN 500). H2 is supplied using Bronkhorst thermal
mass flow controller. Exhaust particulate mass were measured using differential mobility spectrometer. Engine specifications is shown in Table VII.
Table VII. Engine specification
Bore 86 mm
Stroke 86 mm
Swept volume 499.56 cm3
Compression ratio (geometric) 18.3:1
Maximum in-cylinder pressure 150 bar
Piston design Central bowl in piston
Fuel injection pump Delphi single-cam radial-piston pump
High pressure common rail Delphi solenoid controlled, 1600 bar max.
Diesel fuel injector Delphi DFI 1.3 6-hole solenoid valve injector
Experimentation was done at 1200 rpm, 900 bar, injection timing of 10 CAD BTDC. 99.995% H2 was
used. H2 supplied is gradually increased at constant speed. Different injection period used has been tabulated in Table VIII.
Table VIII. Test parameters used Diesel fuel
injection period (μs)
Diesel fuel flow per engine cycle (x 10-3 ml / engine cycle)
Diesel fuel-air equivalence ratio (φD)
Engine load with no H2
addition (bar IMEP)
H2 flow rate
injected in inlet manifold (x10-3 L / engine cycle)
H2 – air
equivalence ratio (φH)
250 1.58 0.08 0.00 0 to 31.3 0 to 0.40
325 2.94 0.20 1.50 0 to 25 0 to 0.31
350 3.93 0.23 2.20 0 to 21.3 0 to 0.26
400 5.30 0.29 3.25 0 to 17.5 0 to 0.21
Second set of experiments have been done with 325 μs and 10, 25, 40 CAD ATDC and the effect of pressure is studied.
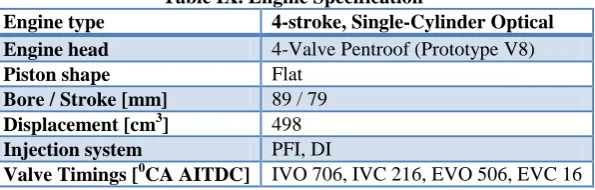
C. Flame chemiluminescence and OH LIF imaging in a hydrogen-fuelled spark-ignition engine
Single –cylinder research engine with 89 mm bore, 79 mm stroke and 7.5 compression ratio was used. Geometric specification has been tabulated below in Table IX.
Table IX. Engine Specification
Engine type 4-stroke, Single-Cylinder Optical
Engine head 4-Valve Pentroof (Prototype V8)
Piston shape Flat
Bore / Stroke [mm] 89 / 79
Displacement [cm3] 498
Injection system PFI, DI
Valve Timings [0CA AITDC] IVO 706, IVC 216, EVO 506, EVC 16
Fuel Supply system
The engine has Port fuel injection and direct injection system. H2 was injected using Keihin KN3-2 gas
injector for PFI with pressure swirl atomizer at 450. DI engine injector nozzle consists of a 6 – hole arrangement. H2 was supplied at 70 bar for DI and 4 bar for PFI. The fuel system comprises of back-flash arrestor,
micrometric in-line filter and a mass flow controller with a piezo-electric pressure transducer (Kistler 6041A) and Lab VIEW.
D. Effects of simultaneous H2 and N2 addition on the emissions and combustion of a diesel engine
The ford puma HSDI diesel engine with 4 cylinders, 2.0L, 16 valves, water cooled fuelled by ULSD, bore 86 mm, stroke 86 mm, compression ratio 18:2:1 was used for experimentation. Schenk eddy current dynamometer connected to engine’s output shaft, Kistler 6125A pressure transducer with Kistler 5001 charge amplifier crank angle was recorded using LabView software. Equivalent quantity of H2 & N2 is delivered through the intake air. Four parameters namely engine speed(1500 – 2500 rpm), load(2.5 & 5 bar), SOI(3-12 CAD BTDC), H2 & N2 mixture(4-16%) have been experimented.
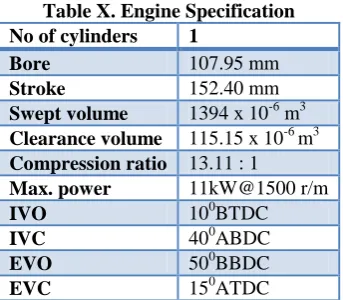
E. Performance and specific emissions of hydrogen-fueled compression ignition engine with diesel and RME pilot fuels
A standard test rig engine is used for study. The components are 4 stroke single cylinders, direct injection Gardner 1L2 compression ignition engine. Two pilot fuels H2 and Rape methyl ester (RME) is used.
H2 is supplied from 20 MPa compressed tank of 99.995% purity. Platon glass variable area flow meter.
Table X. Engine Specification No of cylinders 1
Bore 107.95 mm
Stroke 152.40 mm
Swept volume 1394 x 10-6 m3
Clearance volume 115.15 x 10⁻⁶ m3
Compression ratio 13.11 : 1
Max. power 11kW@1500 r/m
IVO 100BTDC
IVC 400ABDC
EVO 500BBDC
EVC 150ATDC
Signal 4000 VM chemiluminescence analyser, rotork analysis model 523 (FID) analyser, Servomex 4210C were used to analyse NOX, HC, Carbon emissions respectively.
Diesel – H2 fuel:
The pressure and the rate of energy released is found to be more in H2 duel fuelled engine rather than
single fuelled engine.
F. Near-zero NOx Emission, Hydrogen-fuelled, Direct Injection Engines
A gasoline engine is used in this experimentation. The engine specification is given in Table XI.
Table XI. Engine specifications
Engine type Water cooled, 3 cylinder 4 stroke, DOHC, Direct injection
Displacement 658[cc]
Bore X Stroke 68 x 60.4 [mm]
Compression Ratio 9.1
Allowable Max.Pressure 7[MPa]
Combustion Chamber shape Pent roof
Injector type Electro-Magnetic, Current controlled, Single hole
Swirl ratio 0
Tumble ratio 1.2
Intake air pressure was adjusted using pressure regulator. H2 was fed at 0.4 MPa for pre-mix operation.
For direct injection H2 is injected at 7 MPa. Flow control valve, dynanamometer, piezo electro transducers was
used. The experiment was carried at 2000 rpm engine speed, ignition timing was at minimum advance at best torque and cooling water temperature at 800C. Compression ratios were 9.1, 10.5, 12.5.
V.
DISCUSSIONS
A. Influence of LPG-reformate and H2 on a dual fuelled engine
Combustion with 1% LPG with reformate and H2 show more significant results. The reformate and H2
addition reduces the ignition delay, increases the combustion rate and in-cylinder pressure. Further shorter liquid fuel injection duration, easily ignite and less combustion duration has been observed which reduces the heat loss. The brake thermal efficiency has been improved. From the results achieved, reformate and H2 can compensate
some ill effects of LPG.
Fig.1. Combustion duration Fig.2.Thermal efficiency
Emission analysis :
With H2 addition, HC and CO emissions has been reduced. HC are mainly produced due to reforming
gas addition during duel fuelling and are volatile with less than 3 Carbon atoms. They are directly proportional to the in-cylinder pressure. H2 addition to LPG-diesel dual fuelling reduces the harmful formaldehyde that is
produced. LPG reduces soot effects and when H2 is added they are clearly reduced as discussed[1].
Effect of liquid fuels:
Addition of H2 in LPG-RME dual fuelling increased the start of combustion(SOC). Since they have
low calorific value, high pilot fuel quantity which contain more H2 contribute to low SOC. In LPG-GTL dual
fuelling, its lower density and bulk modulus provide poor SOC and affect engine out emissions. NOX formation rate is less comparatively. LPG-GTL dual fuel along with reformate and H2 addition will decrease the NOX
reductions that is comparatively high with other fuel mixtures.
B. Effect of Hydrogen-diesel fuel co-combustion
Ignition delays because of H2 addition but at high engine loads it reverses. pHRR decreases with
increase in H2. Thermal efficiency seem to decrease in H2 fuelled engine rather than diesel engine. This effect
Fig.3. IMEP Vs thermal efficiency (%)
When H2 has been added at different injection levels, CO,THC, CO2 in the exhaust are analysed. As the
load increases, at high diesel-H2 fuel mixture, complete combustion occurs. CO and THC level decreases but
CO2 level shows some increase due to complete combustion. As the engine loads increase NOX emission
increases comparatively with diesel. Keeping diesel injection period constant, increasing the H2 addition causes
decrease in the particulate emissions upto 5.5 Bar IMEP.
Fig.4. Exhaust emissions of total particulate mass at various engine loads
C. Flame chemiluminescence and OH LIF imaging in a hydrogen-fuelled spark-ignition engine
Crank –angle resolved flame development images for H2 PFI and DI at part load. Injection timing for
DI to SOI = 2200 CA ATDC to 3600 CA ATDC for PFI gasoline and 00 CA ATDC for PFI H2 . DI pressure
was 70 bar for H2 and 100 bar for gasoline. AFR was investigated in the range φ = 0.5 – 0.83. Significant
images have been reported for φ = 0.83 and 0.67 in DI H2 injection, φ = 0.5-0.83 for PFI and has been discussed [3]. For gasoline peaks were formed at φ = 0.83 – 1.
Fig.5.Flame radius: Gasoline, Spark Advance 350CA Fig.6.Flame growth speed: Gasoline, Spark Advance 350CA
Fig.7.Flame radius: Hydrogen, Spark Advance 150 CA Fig.8.Flame growth speed: hydrogen, Spark Advance 150 CA
Flame radii and expansion speeds for H2 at different equivalence ratios with DI and PFI are plotted. DI
and PFI flame is peaks at 5-60 and 11-120 CA AIT. H Flame stretch was in the range 5000 – 10000 s-1 for early flames upto 5 mm radius.
D. Effects of simultaneous H2 and N2 addition on the emissions and combustion of a diesel engine
NOX – Bosh Smoke Number (BSN):
Addition of H2 and N2 reduces the emission effects of diesel engine at low speed low load operations.
From the experimental results 4% (H2 + N2) admission and more shows almost 70% reduction in NOX and BSN compared to diesel engine in NOX formation under low speed low load operations. Less NOX-BSN emission is found at unequal H2 + N2 mixture. NOX emission is found high over 8% of gas mixture. Soot is reduced at all gas mixtures[4].
Combustion analysis
The effect has been analyzed at 1500 rpm and medium load, 2500 rpm and 5 bar BMEP and SOI is same at 6 CAD BTDC. NOX increase – BSN reduction is found from (8% - 12% H2 + N2) whereas 12% and
16% H2 + N2 did not affect their values which are discussed briefly[4]. Increase of gas mix fractions at low
speed does not affect the Mass Fraction Burned(MFB). 50 and 90% MFB showed shorter combustion period and release more NOX emissions, increasing the thermal efficiency. Maximum NO2 emissions are found at low
Fig.9. NOX emissions with different fuel ratios
N2O reduces on increase in H2 + N2 fraction. Zero ammonia is recorded on both the fuels using FTIR
analysis. 12% at low speed, 8% at high speed H2 + N2 fraction reduces CO emissions upto 273% and 77%
respectively. The engine is more thermal efficient under low speed (1500 rpm) compared to high speed (2500 rpm).
E. Performance and specific emissions of hydrogen-fueled compression ignition engine with diesel and RME pilot fuels
Thermal efficiency and volume efficiency:
Contours had been plotted and the results show that as the speed of the engine increases the thermal efficiency also increases. The efficiency increases as H2 is added to the diesel fuel and the maximum enthalpy
fraction is 29%. Enthalpy fraction of H2 when increased beyond 25% the thermal efficiency increases for all
speeds but high speeds. H2 compromises volumetric efficiency by 5% but at lower speeds 1.6% increase is
achieved.
Fig.10. Brake power Vs Vol. efficiency – diesel Fig.11.Brake power Vs Vol. efficiency – diesel+H2
NOX:
As the engine operating speed increases NOX emissions increases and then decreases when residence time decreases with increasing rev/min. Compared to the diesel engine the dual H2 fuelled diesel engine shows
increase in NOX emissions. Range of NOX values are between 2.8 and 3.2 g/MJ. Lowest HC emissions are found in higher thermal efficiency contours and high HC emissions for less thermal efficiency. When the H2
fraction is 22% and 29%, a decrease of 12.5% and 35% CO2 is found.
RME:
The thermal efficiency contours are almost similar for both diesel and RME but RME is slightly higher. Maximum enthalpy fraction for H2 is 33%. Thermal efficiency, specific NOX for different enthalpy fraction
Table XII. Performance comparison of diesel and RME
Pilot fuel Load / speed Enthalpy fraction of H2 Thermal efficiency Specific NOX
Diesel Lower medium / all 10% <1.5% >3.3%
Medium/ low to medium 22% <3.2% >16%
High/ low to medium 29% >1.5% >31%
High / High 29% >3.2% >27%
RME Lower medium / all 15% <4.5% >4%
Medium / all 27% <6% >7%
High / all 33% <4.5% >23%
The HC emissions with RME single fuelling and RME piloted dual fuelling of H2 is analogous to that
of base diesel and diesel – H2 fuelled system.
F. Near-zero NOx Emission, Hydrogen-fuelled, Direct Injection Engines
It is found that the NOX emission is independent of the intake air pressure, rather dependent on the air excess ratio. As the intake air pressure increases the NOX decreases at same power output, BMEP.The maximum brake thermal efficiency of 34% was observed at intake air pressure of 200 kPa. Coefficient of variation(COV) in indicated mean effective pressure(IMEP) and HC in the exhaust were small. [6]
Compression ratio:
The engine operating at pressure above 135kPa showed severe knocking. Effects of different
compression ratios were obtained and found that IMEP decreases with increase in compression ratio and only at supercharging pressure 135kPa the IMEP increases with increase in compression ratio. The larger the maximum combustion chamber pressure becomes, the more the IMEP increases.
VI.
CONCLUSIONSHydrogen which is abundantly available has been experimented on different engines. It can be satisfactory used as a substitute or as an addition to the existing fuels with some slight modifications to the existing engine. Greenhouse gases and other hydrocarbon emissions have been reported low by these studies except for NOX emissions. Under restricted conditions NOX emissions can also be controlled. Using Hydrogen in engines can reduce the ill effects to the environment and is a suitable replacement for conventional fuels. Fine technologies can utilize Hydrogen potential to the fullest.
REFERENCES
[1]. Hendry S. Tira, José M. Herreros, Athanasios Tsolakis , Miroslaw L. Wyszynski, “Influence of the addition of LPG-reformate and H2 on an engine dually fuelled with LPG–diesel, –RME and –GTL Fuels”, Fuel,118(2014)73–82.
[2]. Midhat Talibi*, Paul Hellier, Ramanarayanan Balachandran, Nicos Ladommatos, “Effect of hydrogen-diesel fuel co-combustion on exhaust emissions with verification using an in-cylinder gas sampling technique”, International journal of Hydrogen energy 39 (2014) 15088 – 15102.
[3]. P.G. Aleiferis*, M.F. Rosati, “Flame chemiluminescence and OH LIF imaging in a hydrogen-fuelled spark-ignition engine”, International journal of hydrogen energy 37 (2012) 1797-1812
[4]. Fanos Christodoulou*, Athanasios Megaritis, “Experimental investigation of the effects of simultaneous hydrogen and nitrogen addition on the emissions and combustion of a diesel engine”, International journal of hydrogen energy 39 (2014) 2629-2702.
[5]. Shahid Imran a,b,*, D.R. Emberson a, Amjad Hussain c,Hassan Ali d, Balazs Ihracska f, T.Korakianitis e, “Performance and specific emissions contours throughout the operating range of hydrogen-fueled compression ignition engine with diesel and RME pilot fuels”, Alexandria Engineering Journal (2015) 54, 303–314.