DETECTION OFDIABETIC RETINOPATHY USING ADVANCE
GENETIC ALGORITHM AND LOCAL BINARY PATTERN
S. M. Deshmukh, Juee Tatte
1. INTRODUCTION:
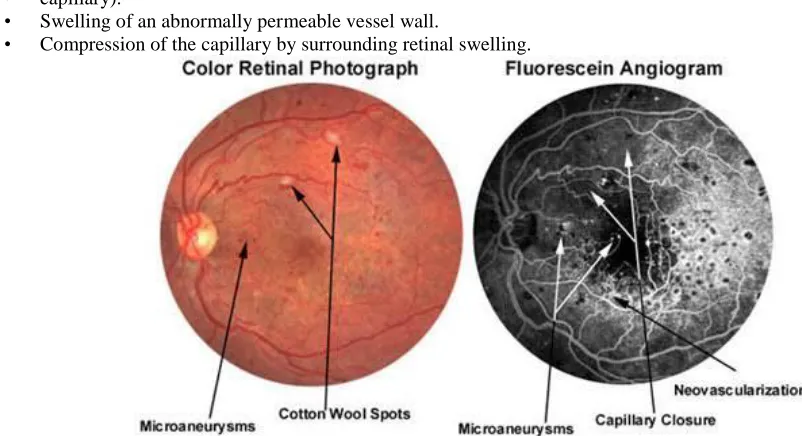
Diabetic retinopathy is damage to the retina caused by complications of diabetes mellitus, which can eventually lead to blindness. It is an ocular manifestation of systemic disease which affects up to 80% of all patients who have had diabetes for 10 years or more. The detection of hemorrhages is one of the important factors in the early diagnosis of diabetic retinopathy (DR). The existence of hemorrhages is generally used to diagnose DR or hypertensive retinopathy by using the classification scheme, [9]. Diabetic retinopathy (DR) remains the commonest cause of blindness in the working age population of the developed world. Effective treatment is available if the condition is detected early, before visual symptoms occur. The need for a comprehensive DR screening programme has long been recognized and it is now feasible,[8]. It is a silent disease and may only be recognized by the patient when the changes in the retina have progressed to a level, that treatment is complicated and nearly impossible,[13]. This disease can be prevented from developing into blindness if it is treated at an early stage. Fundus photographs obtained by the fundus camera are used to diagnose DR. Background Diabetic Retinopathy is the result of two major processes affecting the retinal blood vessels: vessel closure and abnormal vessel permeability.
1.1 Retinal Blood Vessel Closure:
The earliest vessel closures in diabetic retinopathy are usually the capillaries. These small
vessels are critical to the health of the retina, since they are needed to deliver oxygen and nutrients to the area and to carry away carbon dioxide and other waste products. The source of this capillary closure is not completely understood. Theories as to why these vessels close off include:
Clumping of blood cells or other blood elements.
• Abnormality or damage to the endothelium (the cells lining the inner wall of the • capillary).
• Swelling of an abnormally permeable vessel wall.
• Compression of the capillary by surrounding retinal swelling.
Fig 1.1: Retinal capillary closure
DOI: http://dx.doi.org/10.21172/1.141.14
e-ISSN:2278-621X
1.1.1 Abnormal Vessel Permeability:
Retinal blood vessels are different from vessels elsewhere in the body. Most blood vessels are fenestrated, meaning that they have tiny openings that allow fluid to pass through the
vessel wall. The openings are small enough to prevent the egress of larger blood elements such
as blood cells and large proteins, but large enough to allow water and small molecules such as ions to pass. Retinal blood vessels, on the other hand, have tight junctions between the cells of the blood vessel wall, so all fluid and molecules exiting the vessel have topass through the cells. This lack of fenestration helps keep the retina relatively dehydrated, which is necessary for proper function. In diabetic retinopathy, the vessels become more permeable. Water, blood cells, proteins, fats, and other large molecules may leak out into the surrounding retinal tissue. Accumulation of this fluid in the central region of the retina (the macula) is called macular edema or diabetic maculopathy. Diabetic Maculopathy is the most common cause of decreased vision in patients with background or non-proliferative diabetic retinopathy. It is visible on examination as a thickening and slight graying of the retina, and is often associated with exudates (yellow clumps or spots within the retina). Exudates are the result of fats and proteins leaking out of the permeable vessels along with water. The water can be quickly reabsorbed into the vessels or into the tissue under the retina, but the fatty material is absorbed only very slowly. These fatty exudates are left behind like a "bathtub ring", often in a ring-like shape surrounding the leakage site.
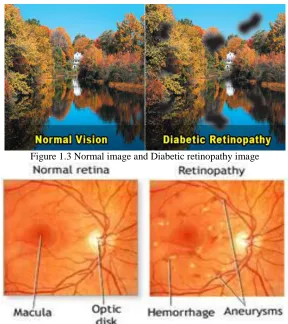
Fig 1.2: multiple micro aneurysms
Figure 1.3 Normal image and Diabetic retinopathy image
1.1.2 Fundus Images:
The human eye is structurally organized similar to a camera. Light that passes through the iris is focused onto the retina through a lens. Retina is the sensory membrane that lines most of the large posterior chamber of the vertebrate eye. The visual information is encoded in the retina, and transmitted to the brain through the optic nerve.
The human eye has a circular opening called the pupil through which light enters the eye and reaches the retina. Fundus imaging systems use this opening to capture the image of the retina. The main structures that can be visualized on a fundus photo are the central and peripheral retina, optic disc and macula.
Analysis for detecting DR
Ophthalmologists can visually examine a patient’s retina using a small portable instrument called an ophthalmoscope. It consists of a set of lenses and a light source, permitting the ophthalmologist to view regions of the patient’s retina.
Digital fundus photography thus opens the possibility of large scale DR screening, where diabetic patients can be routinely checked for DR. The screening process can significantly reduce the workload of the ophthalmologists and the health costs in the diabetic retinopathy screening.
Further, the manual analysis may be augmented by using computer-based tools. For example, an image analysis system that automatically determines if microneurysms, hemorrhages and exudates are present, can reduce the work load of ophthalmologists, by showing them only those cases which are abnormal, and directly archiving the normal cases.
1.2 Contributions:
The thesis documents the following contributions:
The histogram equalization for image processing is applied for the analysis of the fundus images, then advance genetic algorithm is used for images segmentation, and fuzzy rules are applied on the processed image to classify in different stages is discussed broadly.
It also includes datasets of various fundus images of eyes captured with the help of fundus camera. The systems are conceptualized as the core of an automated Diabetic Retinopathy screening solution.
1.3. focus of the thesis
This thesis aims to demonstrate the use of advance genetic algorithm and fuzzy logic by applying them for the detection of diabetic retinopathy in fundus images of retina.
The advance genetic algorithm is used for image segmentation. A fuzzy logic is to perfectly classify an image into different stages of retinal diseases. The designed system and algorithms are a step towards achieving automated screening as a support tool for clinicians and medical practitioners.
2. LITERATURE SURVEY:
A handful of researches have been presented in the literature for Diabetic Retinopathy using various methods. Recently, the use of automation method using fundus images for DR has received a great deal of attention among researchers. A brief review of some recent researches is presented here.
Aliaa Abdel-Haleim Abdel-RazikYoussifet al [2] stated that the Optic disc (OD) detection was a main step while developing automated screening systems for diabetic retinopathy. They present a method to automatically detect the position of the OD in digital retinal fundus images. The method starts by normalizing luminosity and contrast throughout the image using illumination equalization and adaptive histogram equalization methods respectively. The OD detection algorithmis based on matching the expected directional pattern of the retinal blood vessels. Hence, a simple matched filter was used to roughly match the direction
of the vessels at the OD vicinity. The retinal vessels were segmented using a simple and standard 2-D Gaussian matched filter.
V.VijayaKumari and N.SuriyaNarayanan [3] indicated that Diabetic retinopathy was the cause for blindness in the human society. Early detection of it prevents blindness. Image processing techniques can reduce the work of ophthalmologists and the tools used automatically locate the exudates. Early detection helps the patients to aware of the seriousness of the disease. In that paper they present a method which was automatic and involves two steps: optic disk detection and exudates detection. The extraction of optic disk was done using propagation through radii method. Exudates detection was done using feature extraction, template matching and enhanced MDD classifiers and the methods were compared.
AkaraSopharak et al [5] indicated that the Microaneurysms was the first clinical sign of diabetic retinopathy. The number of micro aneurysms was used to indicate the severity of the disease. Early microaneurysm detection can help reduce the incidence of blindness. That paper investigates a set of optimally adjusted morphological operators used for microaneurysm detection on non-dilated pupil and low-contrast retinal images. The detected micro aneurysms were validated by comparing with ophthalmologists’ hand-drawn ground-truth. As a result, the sensitivity, specificity, precision and accuracy were 81.61, 99.99, 63.76 and 99.98%, respectively.
dark scale and revolution invariant surface grouping in light of neighborhood parallel examples and nonparametric separation of test and model dispersions.
KjerstiEngan et al. [7], Detection of diabetic retinopathy and age-related macular degeneration from fundus images through local binary patterns and random forests, This paper centers around investigating the execution of Local Paired Pattern (LBP) as a surface descriptor for retinal pictures to separate amongst neurotic and sound pictures. In spite of the fact that LBP has been generally used to order surfaces, not much is accounted for on the investigation of the retina surface.
3. SYSTEM ARCHITECTURE
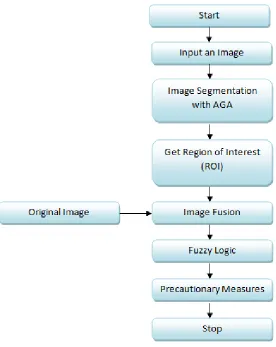
3.1 Data flow diagram:
Figure 3.2: Data flow diagram.
Figure 3.2 shows the process flow of methodology adopted to carry out the present work. Subsequent subsections describe the processing of fundus images for detection of Diabetic retinopathy.
3.2 Objective
To develop a system that will able to identify patients with Diabetic Retinopathy from fundus image obtained from the retina of the patient.
And to perfectly classify an image into different stages of retinal disease using fuzzy logic.
3.3 Motivation :
The main reason behind choosing the topic for our thesis is that we live in a developing country where there is always shortage of resources to overcome any problem. Therefore, we want to raise an awareness that diabetic retinopathy can be very dangerous if it is not treated properly in its early stages. Our country has a population of 1.37 billion and 63 million people have diabetes.
Therefore, using automated detection technique we are going to train our dataset to give the best possible outcome to ophthalmologist. So, that they can worry less about the detection of diabetic retinopathy, and focus more on the proper treatment of the patients.
4. PROPOSED METHODOLOGY:
4.1 Image processing:
Preprocessing refers to convert the image of eye into a form from which the desired features can be extracted and used for identification of an individual. Image preprocessing is the preliminary stage of iris recognition system. The purpose of preprocessing is to isolate the iris region from an eye image. In this step, noise in the iris region due to reflection, illumination and occlusion because of eyelids or eyelashes is also minimized. A good number of algorithms have been proposed by different researchers for image processing. In this section we are using Histogram equalization, which is used on probability density function. The histogram equalization is a technique for adjusting image intensities to enhance contrast. Histogram is a graphical representation of the intensity distribution of an image. In simple terms, it represents the number of pixels for intensity value considered. Histogram equalization is a computer image processing technique used to improve contrast in images. It accomplishes this by effectively spreading out the most frequently intensity values, i.e. stretching out the intensity range of the image. This method usually increases the global contrast of images when its usable data is represented by close contrast values. This allows for areas of local contrast to gain a higher contrast. A color histogram of an image represents the number of pixels in each type of color component. Histogram equalization cannot be applied separately to the Red, Green and Blue components of the image as it leads to dramatic changes in the image’s color balance. However, if the image is first converted to another color space, then the algorithm can be applied to the luminance or value channel without resulting in changes to the saturation of the image.
After extracting or removing the non-region of interest from the input fundus image there are large intensity variations in the image and one can see that veins and other eye features are not clearly seen there. For making intensity variations uniform I applied histogram equalization to the image. Histogram equalization is technique which identifies various intensity variations in the given image and increases its global contrast. Histogram equalization is the most basic technique that equalizes an image by mapping the narrow range of intensity levels to the wider range of intensity levels available. This technique highly improves the radiance of the image. The main advantage of this technique is that it preserves the mean of the enhanced image approximately equal to that of the original image besides suppressing annoying artifacts giving more realistic images.
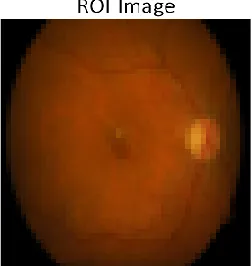
4.2 ROI:
The ROI algorithm helps us to find the region of interest from the fundus image. As the image is made up of number of pixels and the pixels are composed of red, green and blue components.
Px=∫f(R,G,B)
The total number of pixels present in image are calculated by;
Ptotal=
And hence image value can be calculated by;
I=
In this section we are setting threshold. If the value of pixels means value of all the components red, green and blue ranges between threshold value ,then it comes under non-region of interest which is darken and shown in result by red color. Otherwise, if value is greater than threshold value then it is considered as region of interest.
4.3 Advance Genetic Algorithm:
In the computer science field of artificial intelligence, a genetic algorithm (GA) is a search heuristic that mimics the process of natural evolution. Genetic algorithms belong to the larger class of evolutionary algorithms (EA), which generate solutions to optimization problems using techniques inspired by natural evolution, such as inheritance, mutation, selection and crossover.
In the standard GA process First, a population of chromosomes is created. Second, the chromosomes are evaluated by a defined fitness function. Each chromosome in the population will be evaluated by a defined fitness function. The better chromosomes will return higher values in this process. The fitness function to evaluate a chromosome in the population can be written as fitness. Third, some of the chromosomes are selected for performing genetic operations. Forth, genetic operations of crossover and mutation are performed.Crossover, It is the process in which two chromosomes (strings) combine their genetic material (bits) to produce a new offspring which possesses both their characteristics. Mutation, it is the process by which a string is deliberately changed so as to maintain diversity in the population set.
4.3.1 Why use Genetic Algorithm?
Genetic algorithms are a stochastic search algorithm, which uses probability to guide the search. It can find the near global optimal solution in a large solution space quickly. It has been used extensively in many application areas, such as image processing, pattern recognition [27], feature selection, and machine learning. Its power comes from its ability to combine good pieces from different solutions and assemble them into a single super solution.
The advantage of the GA approach is the ease with which it can handle arbitrary kinds of constraints and objectives; all such things can be handled as weighted components of the fitness function, making it easy to adapt the GA scheduler to the particular requirements of a very wide range of possible overall objectives.
4.4 Local Binary Pattern:
Local binary pattern is a simple yet very efficient texture operator which labels the pixels of an image by thresholding the neighborhood of each pixel and considers the result as a binary number. Due to its discriminative power and computational simplicity, LBP texture operator has become a popular approach in various applications. It can be seen as a unifying approach to the traditionally divergent statistical and structural models of texture analysis. Perhaps the most important property of the LBP operator in real-world application is its robustness to monotonic gray-scale changes caused, for example, by illumination its computational simplicity, which makes it possible to analyze images in challenging real-time settings. Computation of the LBP descriptor from an image is a four-step process and is eexplained below.
For every pixel (x,y) in an image, I, choose P neighboring pixels at radius R.
Calculate the intensity difference of the current pixel(x,y) with the P neighboring pixels.
Threshold the intensity difference, such that all the negative differences are assigned 0 and all the positive differences are assigned 1, forming a bit vector.
Convert the P-bit vector to its corresponding decimal value and replace the intensity value at (x,y) with this decimal value. Thus, the LBP descriptor for every pixel is given as
LBP(P,R)=∑P=0P-1f(gp-gc)2p
Where gc and gp denote the intensity of the current and neighboring pixels choosen at a radius R.
4.5 Fuzzy Disease Prediction:
Fuzzy rules are the rules when we applied we get frequency of occurrence of disease. If count is equal to 1 then display disease with maximum no. of occurrence of frequency or display disease name with all max frequency of occurrence.
Result:
Figure 4.3: (a) Input image,(b) pre-processed image, (c) GA- segmented image, (d) infected region
Output of LBP:
4.6 Result after applying fuzzy rules:
5. REFERENCES:
[1] B. Wu, W. Zhu, F. Shi, S. Zhu, and X. Chen, “Automatic detection of microaneurysms in retinal fundus images,” Computerized Medical Imaging and
Graphics, vol. 55, pp. 106–112, 2017.
[2] Aliaa Abdel-Haleim Abdel-RazikYoussif, AtefZakiGhalwash, and Amr Ahmed Sabry Abdel-Rahman Ghoneim," Optic Disc Detection From
Normalized Digital Fundus Images by Means of a Vessels’ Direction Matched Filter," IEEE TRANSACTIONS ON MEDICAL IMAGING, VOL. 27, NO. 1, Jan 2008.
[3] V.VijayaKumari and N.SuriyaNarayanan," Diabetic Retinopathy-Early Detection Using Im-age Processing Techniques," International Journal on
Computer Science and Engineering Vol. 02, No. 02, , 357-361, 2010.
[4] BalintAntal and AndrasHajdu," Improving Micro aneurysm Detection in Color Fundus images by using an optimal combination of preprocessing
methods and candidate extractors," In Proc. of the 18th European Signal Processing Conference held in denmark, pp. 1224-1228, Aug 2010.
[5] AkaraSopharak, BunyaritUyyanonvara, Sarah Barman and Tom Williamson," Automatic Microaneurysm Detection from Non-dilated Diabetic
Retinopathy Retinal Images," In Proc. of the World Congress on Engineering, Vol 2, Jul 2011.
[6] T. Ojala, M. Pietikinen, and T. Menp “A generalized local binary pattern operator for multiresolution gray scale and rotation invariant texture
classification”. in Advances in Pattern Recognition, 2nd International Conference on, 2001, pp. 397–406.
[7] Sandra Morales, KjerstiEngan, Valery Naranjo, Adri´anColomer “Detection of diabetic retinopathy and age-related macular degeneration from fundus
images through local binary patterns and random forests”.
[8] R. Maher, S. Kayte, and D. M. Dhopeshwarkar, “Review of automated detection for diabetes retinopathy using fundus images,” International Journal
of Advanced Research in Computer Science and Software Engineering, vol. 5, no. 3, pp. 1129–1136, 2015.
[9] D. J. Browning, Diabetic retinopathy: evidence-based management. Springer Science & Business Media, 2010.
[10] R. Maher, S. Kayte, D. Panchal, P. Sathe, and S. Meldhe, “A decision support system for automatic screening of non-proliferative diabetic
retinopathy,” International Journal of Emerging Research in Management and Technology, vol. 4, no. 10, pp. 18–24, 2015.\
[11] R. S. Maher, S. N. Kayte, S. T. Meldhe, and M. Dhopeshwarkar, “Automated diagnosis non-proliferative diabetic retinopathy in fundus images using
support vector machine,”International Journal of Computer Applications, vol. 125, no. 15, pp. 7–10, 2015.
[12] Michael D. Abràmoff, Joseph M. Reinhardt, Stephen R. Russell, James C. Folk, Vinit B. Mahajan, MeindertNiemeijer and GwénoléQuellec,"
Automated Early Detection of Diabetic Retinopathy," American Academy of Ophthalmology, pp. 1147-1154, 2010.
[13] I.B. Styles, A. Calcagni, E. Claridge, F. Orihuela-Espina, J.M. Gibson," Quantitative analysis of multi-spectral fundus images," Medical Image
Analysis, Vol. 10, pp. 578–597, 2006.
[14] R S B Newsom, A Clover, M T J Costen, J Sadler, J Newton, A J Luvs and C R Canning," Effect of digital image compression on screening for
diabetic retinopathy," British Journal of Ophthalmology, Vol. 85, pp. 799–802, 2001.
[15] Michael Goldbaum, Saied Moezzi, Adam Taylor, Shankar Chatterjee, Jeff Boyd, Edward Hunter, and Ramesh Jain," Automated diagnosis and image
understanding with object extraction, object classification, and inferencing in retinal images," In Proc of the International Conference on Image Processing, Vol.3, Sep 1996.
[16] D. Usher, M. Dumsky , M. Himaga , T. H. Williamson , S. Nussey and J. Boyce," Automated detection of diabetic retinopathy in digital retinal images:
a tool for diabetic retinopathy screening," journal of the British Diabetic Association, Vol. 21, No.1, pp. 84-90, 2004.
[17] B. Wu, W. Zhu, F. Shi, S. Zhu, and X. Chen, “Automatic detection of microaneurysms in retinal fundus images,” Computerized Medical Imaging and
Graphics, vol. 55, pp. 106–112, 2017.
[18] R. Maher, S. Kayte, and D. M. Dhopeshwarkar, “Review of automated detection for diabetes retinopathy using fundus images,” International Journal
of Advanced Research in Computer Science and Software Engineering, vol. 5, no. 3, pp. 1129–1136, 2015.
[19] D. J. Browning, Diabetic retinopathy: evidence-based management. Springer Science & Business Media, 2010.
[20] R. Maher, S. Kayte, D. Panchal, P. Sathe, and S. Meldhe, “A decision support system for automatic screening of non-proliferative diabetic
retinopathy,” International Journal of Emerging Research in Management and Technology, vol. 4, no. 10, pp. 18–24, 2015.
[21] R. S. Maher, S. N. Kayte, S. T. Meldhe, and M. Dhopeshwarkar, “Automated diagnosis non-proliferative diabetic retinopathy in fundus images using
support vector machine,” International Journal of Computer Applications, vol. 125, no. 15, pp. 7–10, 2015.
[22] B. Singh and K. Jayasree, “Implementation of diabetic retinopathy detection system for enhance digital fundus images,” International Journal of
advanced technology and innovation research, vol. 7, no. 6, pp. 874–876, 2015.
[23] N. Thomas and T. Mahesh, “Detecting clinical features of diabetic retinopathy using image processing,” International Journal of Engineering Research
& Technology (IJERT), vol. 3, no. 8, pp. 558–561, 2014.
[24] M. Gandhi and R. Dhanasekaran, “Diagnosis of diabetic retinopathy using morphological process and SVM classifier,” in Communications and Signal
Processing (ICCSP), 2013 International Conference on. IEEE, 2013, pp. 873–877.
[25] E. M. Shahin, T. E. Taha, W. Al-Nuaimy, S. El Rabaie, O. F. Zahran, and F. E. A. El-Samie, “Automated detection of diabetic retinopathy in blurred
digital fundus images,” in Computer Engineering Conference (ICENCO), 2012 8th International. IEEE, 2012, pp. 20–25.
[26] Dhongbo Zhang, et al. "Robost Hemorrhage Detection in Diabetic Retinopathy Image.", IEEE transactions, 2011.
[27] Ardesan Rocha, et al., ―Points of Interest and Visual Dictionaries for Automatic Retinal Lesion Detection‖ , IEEE transactions onBiomedical
Engineering, 8 August, 2012, vol. 59, pg. 2244-2253.
[28] A. D. Fleming, et al., ―Automated Microaneurysm detection using local contrast normalization and local vessel detection‖, IEEETransaction on
Medical Imaging, 2006 Vol. 25, pp. 1223-1232.
[29] O. Faust, et. al., ―Algorithms for Automatic detection of Diabetic Retinopathy using Digital Fundus images: A Review‖, J. Med,Syst., Vol. 36, pp.
[30] B. Antal, et. al., ―Evaluation of a grading performance of an ensemble-based Micro aneurysm detector‖, in Proc. Intl. Conf. IEEEEng. Med. Biol. Soc., 2011, pp. 5939-5942.
[31] A. D. Fleming, et. al., ―The role of Exudates and Hemorrhage in automatic grading of Diabetic Retinopathy ‖, Br. J. Ophthalmol.,vol. 94, pp. 706 –
711, 2010.
[32] M.D. Abramoff, et. al., ―Evaluation of Computer Aided diagnosis system for diabetic retinopathy screening on public data”,InvestOphthalmol. Vis.
Sci., Vol. 52, pp. 4866-4871, Jul. 2011.
[33] D. Welfer, et. al., ―A coarse to fine strategy for automatically detecting exudates in colour eye fundus images‖, Comput. Med. Imag. Graph, Vol. 34,
pp. 228-235, 2010.
[34] Osareh, A.; Mirmehdi, M.; Thomas, B.; Markham, R. 2002 Comparative Exudate Classification using Support Vector Machines and Neural Networks.
In Internat.Conf. on Medical Image Computingand Computer-Assisted Intervention, pp. 413-420.
[35] Dunn, J.C. 1973 A Fuzzy Relative of the ISODATA Process and Its Use in Detecting Compact Well- Seperated Clusters. J. Cyber. 3, 32-57.
[36] C. Sinthanayothin, J.F. Boyce, H.L. Cook, T.H. 1999 Williamson, Automated Localization of the Optic Disc, Fovea, and Retinal Blood Vessels from