Application of Switched Capacitor banks for Power Factor Improvement and Harmonics Reduction on the Nigerian Distribution Electric Network
Oodo Ogidi Stephen , Liu Yanli and Sun Hui
Abstracts
The Distribution System in Nigeria is faced with low voltage and high loss, these two problems of voltage drop and losses in the distribution network varies with the pattern of loading on the distribution network. Voltage regulation on the distribution network becomes an important issue due to the presence of many industrial loads which vary their demand for reactive power. These industrial loads having lagging power-factor; they absorb reactive power which can deteriorate the quality of supply on the distribution network. This paper which to examine an integrated for an optimal cost effective approach to improve the power factor and harmonic issue by the use of Switched capacitor banks to provide a controllable and variable amount of reactive power precisely according to the requirement of the load to such that power factor is improved and harmonics are reduced on the distribution network , losses are within limits and also satisfy the statutory voltage limits at customers premises. Capacitor Bank and Reactors devices with mechanical time control switch can be connected in parallel to the distribution network to supply the type of reactive power or current needed to counteract the out of phase component of current required by the inductive load to eliminate or reduce to an acceptable limit the voltage regulation. These conventional compensators can be switched in and out of the system by mechanical switches based on the system loading as it varies throughout the day. The objective shall be achieved by an evaluation of the operational requirement for power factor requirement and voltage profile on a typical Nigerian distribution Network
Keywords: Distribution System, Voltage regulation, Power factor, Switched
Capacitor bank, Mechanical Switches.
Introduction.
Voltage Drop in a Distribution System
A basic overview on voltage drop in a distribution system is shown in a one line diagram in Figure 1. The current
I
as a function of the load complex apparent powerL L
S =P jQ and the load voltage
U
2will be [26]2 2
L L
P jQ
S I
U U
−
U0 U1 I U2
XTX RLN,XLN
Grid
Substation Feeder
Load PL,QL
U1
U2
I IRLN
jIXLN
Fig. 1-One line diagram and corresponding phasor diagram for an illustration of the voltage drop in a distribution system
The voltage drop on the feeder is given by U1−U2 = I R( LN + jXLN)
2
(R PLN L X QLN L) j X( LNPL R QLN L) U
+ − −
= (1)
For a small power flow, the voltage angle
δ
between U and 2 U in (3-2) is small, and the 1 voltage drop ∆ =U U1−U2 can be approximated by
2 LN L LN L
R P X Q
U
U
+
∆ ≈ (2)
It can be seen from equations (1) and (2) that the load always causes voltage drop. This voltage is decreasing towards the end of the distribution System.
For a small power flow, the voltage angle
δ
between U2and U1in (2) is small, and the voltage drop ∆ =U U1−U2 can be approximated by2 LN L LN L
R P X Q
U
U
+ ∆ ≈
1.2 Reactive Power Control with Switched Shunt Capacitors
Shunt capacitors inject reactive power to the system according to [26] 2
, c C rat C
Q
=
Q
U
where
QCis the reactive power injected by the capacitor in Mvar QC rat, is the Mvar rating of the capacitor
UCis the voltage in pu (relative to the capacitor voltage rating).
2
( )
LN L LN L C
R P X Q Q
U
U
+ −
∆ ≈
Which indicates that the capacitor reduces the voltage drop. Further, when the capacitor properly compensates the reactive power demand, the capacitor will decrease the feeder current. Theis will in turn decrease the feeder losses PLoss,
2 2
2
( )
L L C
P Q Q
I
U
+ −
=
2 Loss LN
P =I R
In order to properly compensate the reactive power demand that changes from minimum to maximum and to be switched off at the load minimum. When the load varies during the day, the switched capacitors should be properly controlled. Different conventional controls can be used to control switched capacitors, such as time, voltage and reactive power. Time controlled capacitors are especially applicable on feeders with typical daily load profiles in a long term, where the time of the switching-on and off of the shunt capacitor can be predicted. The main disadvantage of this control is that the control has no flexibility to respond to load fluctuation caused by weather, holidays, etc. voltage controlled capacitors are most appropriate when the primary role of the capacitor is for voltage support and regulation[ 25]. Reactive power controlled capacitors are effective when the capacitor is intended to minimize the reactive power flow.
2. Effect of Voltage Variation on Nigerian Distribution System
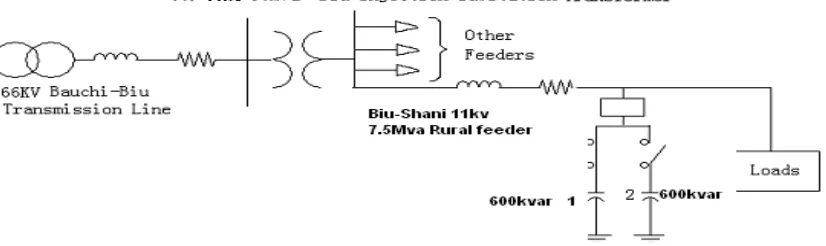
The Voltage profile, system loading, and reactive power control presented in this paper is tested on an 11 kv 7.5Mvar distribution System fed from a 33kv 30Mva injection Substation Shown in Fig 2, With its detail specification presented in Table 1, the daily load profile is adapted from a graph of measurement at the distribution grid of the network in Nigeria [25]. This feeder experiences peak loading period which affects the voltage stability on the system [22].
Fig. 2-.A Typical Nigeria 33kv /30MVa Distribution Network(33kv line)
3 Load Assessment of a The 11 kv Feeder
observed for the system lagging reactive loads and the determined values where plotted on a curve as indicated in Fig.3 below. The Curve indicated that the minimum reactive
power demand of 600 Kvar on the system occurs at light load period around 3am when the system load is 3333kw, then there is a gradually raise in the demand for the reactive power up to around 7pm in the night and is maximum of 2980 kvar at peak load of 5667 kW.
Fig. 3- Daily load profile of System under study
3.1 Load Flow Studies
The load flow studies stimulated 2 varied conditions: 1— Lightly loaded Network
2— Peak Loaded Network.
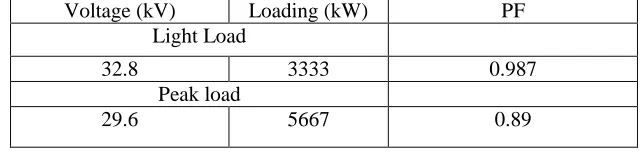
The load flow indicated the voltage level on the feeder for the network at light and peak load period which occurs during the early hours of the morning around 4am and at night around 7-8 pm respectively. The load flow for the 2 period is as indicated in table 1 below:
Voltage (kV) Loading (kW) PF
Light Load
32.8 3333 0.987
Peak load
29.6 5667 0.89
Table 1 Load flow of a 33 kv network
The Q-T curve in Fig 3 and the Load flow analysis in Table 1 indicate the Voltage and Voltage Change quantities that determine the optimum control set point which can be explain as follows. The reactive power demand progressively increase due to the system loading, the system voltage and power factor begins to drop and the voltage under peak load was noticed to be about 29.6 kV, this was regarded as voltage instability. The system voltage and power factor is best at the lightly load period around 5am. Where the power factor is given by [25]:
power Apparent
power Active
PF= (3)
PF
=
3333
/
5667
2+
600
2=
0
.
987
;This also corresponds to a voltage level of 32.89 kV at the feeder, and corresponds to a drop of about 1.5% drop in the feeder voltage. he PF of the peak load period is given by:
89 0 2800 5667
5667
PF= / 2 + 2 = . .
And this corresponds to a voltage level of 29.6 kV which represents about a 12% drop in voltage from the nominal level and this occurs around 7 to 7pm in the night.
4 Distribution Network Performance Analysis
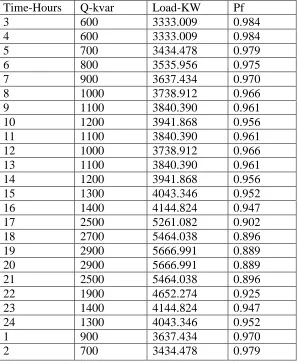
Power factor Analysis and sizing of the capacitor are performed using the Power point and Matlab Software to determine the daily fixed and varying reactive power requirement. It was observed that the size required was 600kvar for the fixed .The 2380 kvar which is varying with time remaining will be met by switched capacitors. Capacitors were selected to match the remaining load characteristics from hour to hour. Matalab software was used to determine the Size of the switched capacitors
Time-Hours Q-kvar Load-KW Pf
3 600 3333.009 0.984
4 600 3333.009 0.984
5 700 3434.478 0.979
6 800 3535.956 0.975
7 900 3637.434 0.970
8 1000 3738.912 0.966
9 1100 3840.390 0.961
10 1200 3941.868 0.956
11 1100 3840.390 0.961
12 1000 3738.912 0.966
13 1100 3840.390 0.961
14 1200 3941.868 0.956
15 1300 4043.346 0.952
16 1400 4144.824 0.947
17 2500 5261.082 0.902
18 2700 5464.038 0.896
19 2900 5666.991 0.889
20 2900 5666.991 0.889
21 2500 5464.038 0.896
22 1900 4652.274 0.925
23 1400 4144.824 0.947
24 1300 4043.346 0.952
1 900 3637.434 0.970
2 700 3434.478 0.979
5 55
5.... Capacitor bank selection
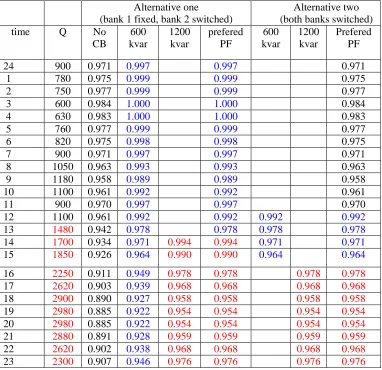
Sizing of the capacitor banks using MATLAB: at the peak load, the PF raised from 0.889 to 0.95 with total 1200 kvar reactive power switched on by the capacitor banks.
If the capacitor banks are designed in two sets and switched on separately, there are two banks with two alternatives as indicated in table 3 below
Fig. 3-The Biu Shani Distribution network Single line Diagram with Capacitor Banks
Alternative one
(bank 1 fixed, bank 2 switched)
Alternative two (both banks switched)
time Q No
CB
600 kvar
1200 kvar
prefered PF
600 kvar
1200 kvar
Prefered PF
24 900 0.971 0.997 0.997 0.971
1 780 0.975 0.999 0.999 0.975
2 750 0.977 0.999 0.999 0.977
3 600 0.984 1.000 1.000 0.984
4 630 0.983 1.000 1.000 0.983
5 760 0.977 0.999 0.999 0.977
6 820 0.975 0.998 0.998 0.975
7 900 0.971 0.997 0.997 0.971
8 1050 0.963 0.993 0.993 0.963
9 1180 0.958 0.989 0.989 0.958
10 1100 0.961 0.992 0.992 0.961
11 900 0.970 0.997 0.997 0.970
12 1100 0.961 0.992 0.992 0.992 0.992
13 1480 0.942 0.978 0.978 0.978 0.978
14 1700 0.934 0.971 0.994 0.994 0.971 0.971
15 1850 0.926 0.964 0.990 0.990 0.964 0.964
16 2250 0.911 0.949 0.978 0.978 0.978 0.978
17 2620 0.903 0.939 0.968 0.968 0.968 0.968
18 2900 0.890 0.927 0.958 0.958 0.958 0.958
19 2980 0.885 0.922 0.954 0.954 0.954 0.954
20 2980 0.885 0.922 0.954 0.954 0.954 0.954
21 2880 0.891 0.928 0.959 0.959 0.959 0.959
22 2620 0.902 0.938 0.968 0.968 0.968 0.968
1 5 1 0 1 1 1 2 1 3 1 4 1 5 1 6 1 7 1 8 1 9 2 0 2 1 2 2 2 3 2 4 0
6 0 0 7 6 0 9 0 0 1 1 0 0 1 2 0 0 1 4 8 0 1 7 0 0 1 8 5 0 2 2 5 0 2 6 2 0 2 9 8 0
p f i m p ro ve m e n t
t i m e
Q
l
a l t e r n a t i ve 1
a l t e r n a t i ve 2
Fig. 4- Q-T Curve Showing the Fixed and Switched capacitors network in Nigeria- Biu Shani
6. Calculation of Modeled components in PSCAD
The first approach taken towards simulation is the calculation of the parameters of the components of the Model. Care must be taken in calculating the parameters in order to achieve accuracy.
6.1 Calculation of the size capacitor banks.
The source is Y connected and the line Voltage is 11kv,
Phase Voltage, 635V
3 11kV
Vph = = .
Capacitor bank rating Qc = 600 kvar.
Capacitor bank rating per phase 200kvar
3 kvar 600
Qcph = = .
Impedance of capacitance per Phase, Ω =
=
= 20161
200kvar 35kv) (6 Q V X 2 cph ph 2 Cph . . F 78 15 C C f 2 1
Xcph => = µ
× × π
= . ,
Where f= 50 Hz, is the power system frequency.
Assuming severest conditions of switching the value of L in Henry is given by H 64 0 C f) (2 1
L 2 = .
× × π = . amps 59 44 0.64 10 78 15 10 35 6 2 Current Inrush 6 3 . . . × × × = × = − .
Line XL: Aerial line with Conductor of size 100mm2
Length of line = 5m. Line XL = 0.5Ω/ km.
6.2 Series reactor Rating and Selection
In order to avoid resonance at all odd harmonics the minimum value of series reactor reactance (XL) should to be from (1-12)% of the capacitive reactance (Xc). Moreover, to
keep the effective capacitive reactance same as ohms the 201.61 ohms capacitive reactance of capacitor bank should be increased by the same amount of the series rector reactance. The value of series reactor reactance is, assuming XL= 0.01×0.64=0.0064H,
the simulation rector values of 0.0064H, 0.0194H, 0.0384H, 0.0576, 0.0768H corresponding to 1, 3, 6, 9 and 12 percents respectively and where used with all these values, the next approach is to construct the model In PSCAD.
Fig. 5- Single line diagram of reactive power compensation using capacitor bank -The Biu-Shani network
7 77
7 Economic Economic Economic bEconomic bbbenefitsenefitsenefitsenefits
In Nigeria like all over the world, Electrification is carried out by the national or regional government, with the ongoing privatization of the sector voltage stability is being addressed by the utility companies.
Some the benefits from the installation of capacitor will result in.
7.1 Benefit due to release capacity
Assume load installation to of---5667 kW at peak period. Power factor @ Peak period---0.89
Required power factor with CB installation---0.98
Maximum load at @ 0 89 PF---6367.41 kVA Maximum load @ 0.98 PF---5553.68 kVA Reduction in Maximum load---813 kVA.
7.2 Benefits due to Voltage profile Improvement
The improvement on the voltage profile will reduce to a minimum the use of independent small private electric generators used by several industries. This will reduce noise and tones of CO2 emission from the environment, the estimated reduction of CO2
emissions will be about 246,506 tones.
Secondly the monthly running cost of these diesel Generators at a minimum of 12 hours daily is as indicated in table 4 below:
Component Unit cost (USD)
Quantity Yearly Cost (USD)
Present Value Of Life-Cycle (USD)
50kVA Engine $110,000 each
2 (rotation of 12 hours/day)
$220000
Maintenance and spare
parts(including engine oil and filters)
10% per year of initial capital cost.
$22000
$264000
Market Fuel Price
$1.19/liter, February 2011
14600 liters year**
$17,374
$193000
Total per kVA $13540 per annum
Table 4-Diesel Generator life cycle Cost Projection System Lifetime 12 years
*Addition of off-grid electricity supply generators, running on diesels or gasoline located at
the premises of industries or households. Generator power varied per KW as required by House-hold or Industries and Commercial, but equals or exceed the KW estimated Load.
8. Future work and Conclusion.
Loading, or voltage dip during first swing period, repeated operation of the switchgears and control may result in prohibitive wear and tear of the switching mechanism and contactors. For repeatedly switched on and off at precise times. The switching can be more reliably achieved with Thyristors switches than with conventional mechanical switchgears[25].
The Filters absorb harmonic generated by the Capacitor bank structure and large industrial loads. Equipments such as electric motors overheats when working under low voltage, several and had to be replaced, also incandescent lamps have to be replaced frequently this is also a direct increase in the running cost of such companies, an improve voltage profile will remove. The reduction in max load during Peak loading period implies capacity release on the network, this means additional revenue for the utility company and more homes will be provided with electricity. Secondly the removal of the running cost of these generators from the production line of the industries will reduce the production cost of the goods produced; the resultant effect will be a reduction in the production cost of such goods, and the multiplying effect on the reductions of price of goods and services provided by such industries. The used engine oil runs into 100 of tones of liters every year improper disposal of these used oil have led to several cases of water, crops and land pollution in these rural areas, vast piece of land have been known to be destroyed by waste oil from these generators.
References
[1] M. F. MaGranagham, R. M. Zavadil, G..Hensley, T. Singh, “impact of utility Switched capacitors on Customers Systems-Magnification at Low Voltage capacitors” IEEE PES Transmission and Distribution Exposition 1991
[2] Carlo Gemme, “Synchronous MV Circuit- Breaker with magnetic Drive and Electronic Control” ABB Review 6/1999
[3] S&C Electrical Company “Capacitor Switching Needs a Switch, Not a Circuit Breaker,” Electrical world, April 1996
[4] Rodger, E.J., Gillers D.A, “Shunt Capacitor Switching Emi Voltages, their Reduction in Bonneville power Administration Substations” Results from this study. Results from this study IEEE Transactions on Power Apparatus and Systems, Vol. 93, 1974, pp.1849-1860.
[5] Miller, D, F. “ Application guide for Shunt Capacitor On Industrial Distribution Systems at medium Voltage Levels”, IEEE Transaction on Industry Application, Vol. IA-12,no %, Sept-Oct 1976, pp 444-459.
[6] Frank Decesaro, John Barannoski, Micheal Dunk, “The SyncCap Power Quality Switch: Minimizing Switching Transients on power Systems During Capacitor Switching”, Cooper Power Systems.Specification Guide, Publication No.PSg-807-031904
[7] George V. Fantozzi, “ Selecting a capacitor- Switching OverVoltage Control Method Effective In Preventing Nuisance Tripping Of Adjustable-Speed Drive. EEI Committee Meeting Clearwater Beach Folrida, April 4, 1995
[9] Borka Milosevic, Miroslav Begovic, “Capacitor Placement for Conservative Voltage reduction on distribution feeders”, IEEE Transactions on Power Delivery, Vol.19, no 3, July 2004, page 1360. [10]M.M Abdel Aziz, Abou El-Zahab E .E.; “Power Factor and your Electrical Utility Bill in Egypt”.
IEEE Transactions on Power Delivery Vol. 18, no4, October 2003, page 1567.
[11]Salama M. A, Chikhani A.Y., N. Ng; “Capacitor Allocation by Approximate Reasoning: Fussy Capacitor Placement”, IEEE Transaction on Power Delivery Vol.15.no1, January 2000, page 393. [12]Trammel. R, Kent McCarthy D., “Capacitor Gives Voltage a lift”,Idaho Power Company, August
1999, page 64.
[13]R.G. Andrei, R.R Kaushik, Reinaker R.W., “Bridge Capacitor Bank Design and Operation”, IEEE Transaction on Power Delivery Vol.11, no1, January 1996, p227.
[14]Aldy A. Girgis, Christopher M. Fallon, Jay C. Rubino, Ray C Catoe ”Harmonics and transients overvoltage due to Capacitor Switching” IEEE Transactions on Industry Applications, Vol. 29 no 6, Nov/dec 1993, p.1184.
[15]Mendis S.R. Bishop M.T, McCall J.C., “Overcurrent Protection of Capacitors applied to Industrial Distribution Systems”, IEEE Transactions On industry Applications Vol.29,no 3, May/June 1993 p.51.
[16]Tyson J. Salewaske; “Fuseless Shunt Y Capacitor Bank Protection & Control Applying The BCD Per The IEEE C37.99”, ZIV USA Inc. Des Plaines, IL, 60018
[17]]Ajit Bapat, “ Application of Power Capacitors in Operation of Electrical Equipment and Systems” Epic Educational Program Inovations Center, Mississauga , ON. April 20-21, 2006 [18]“Power Capacitors- A method for Evaluation of Design Criteria and reliability”, Technical
Report, CPRI, Banglalore, Oct. 1996.
[19]ANSI C SS.1-1998, American National Standard : Shunt Power Capacitors
[20]Thomas Marx, “ The Why and How of Power Capacitor Switching”AG 001, Joslyn Hi-Voltage, Cleveland, OH. June 2003.
[21]El-Sharkawi, “Switch Gear and Surge Arresters” Draft, March 20, 2002
[22]Grainger, J.J., S. Civanlar, and S.H. Lee: “optimum Placement of Fixed and Switched Capacitor on Primary Distribution Feeder” IEEE Trans Power Appar.Syst., Vol.Pas-100, January 1981,pp.1105-1118
[23]Findings, “Rural Electrification Lessons Learned”, World Bank Reports, Knowledge and learning Center, February 2001.
[24]“The Projects for the Reinforcement Of electric Power Distribution Network in Kampala”, YaChiyo Engineering Co.,Ltd, Japan,.1993
[25] Miller T. J. E “ Reactive Power Control in Electric Systems” John Willey & Sons New York 1982.