www.nat-hazards-earth-syst-sci.net/10/2727/2010/ doi:10.5194/nhess-10-2727-2010
© Author(s) 2010. CC Attribution 3.0 License.
and Earth
System Sciences
Experimental spatial rogue patterns in an optical feedback system
V. Odent, M. Taki, and E. Louvergneaux
Universit´e Lille1, Laboratoire de Physique des Lasers, Atomes et Mol´ecules, CNRS UMR 8523, 59655 Villeneuve d’Ascq Cedex, France
Received: 30 September 2010 – Revised: 22 November 2010 – Accepted: 23 November 2010 – Published: 22 December 2010
Abstract. We study pattern formation in an optical system composed of a Kerr medium subjected to optical feedback but in a regime very far from the modulational instability threshold. In this highly nonlinear regime, the dynamics is turbulent and the associated one-dimensional patterns depict rare and intense localized optical peaks. We analyse numer-ically and experimentally the statistics and features of these intense optical peaks and show that their probability density functions (PDF) have a long tail indicating the occurrence of rogue events.
1 Introduction
Since the experimental evidence of temporal optical rogue waves in a fibre system by Solli and coworkers (Solli et al., 2007), rogue wave research activity has received a consid-erable attention in optics in general (Solli et al., 2008; Dud-ley et al., 2008; Hammani et al., 2008; Mussot et al., 2009; Montina et al., 2009). Such rare and intense events are origi-nally observed, e.g., in open ocean in form of rogue or freak waves (Kharif and Pelinovsky, 2003; Broad, 2006; Fedele, 2008) and more recently in, for example, capillary waves turbulence on water (Shats et al., 2010) and acoustic turbu-lence (Ganshin et al., 2008). They are characterised by long tails of their probability density functions (PDF) due to their very low probability of occurrence. The possibility to repro-duce such rogue waves in optical temporal systems (Ham-mani et al., 2008; Solli et al., 2008) with characteristics sim-ilar to those encountered in the ocean is not surprising since the self-focusing Nonlinear Shr¨odinger Equation (NLSE) re-flects the temporal nonlinear dynamics of waves propagating in both fibre optics (Agraval, 1995) and ocean surface
(Za-Correspondence to: E. Louvergneaux ([email protected])
kharov, 1968; Onorato et al., 2001; Kharif and Pelinovsky, 2003). These rogue events were also predicted and studied in spatially extended systems (Kim and Ott, 2003; Du et al., 2008) and discrete optical systems (Bludov et al., 2009) be-fore being experimentally evidenced very lately in an optical ring cavity (Montina et al., 2009) and in laser filamentation (Kasparian et al., 2009). This leads to one of the main and at-tractive research activity in optics. The study of their forma-tion in optical systems could provide, for example, inputs on mechanisms of their marine counterparts. Moreover, while the appearance of rogue waves in the ocean is a dreaded phe-nomenon, the formation and control of such pulses of very high energy in optics remains a challenge. Knowledge of the mechanisms of formation of these giant waves could, thefore, help to generate them deterministically rather than re-lying on random conditions.
2 The experimental optical system
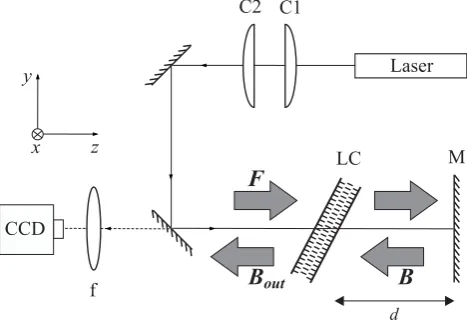
The experimental setup in which optical spatial rogue peaks of intensity occur is composed of a Kerr slice medium sub-jected to optical feedback (Fig. 1) (Louvergneaux., 2001). This system configuration allows the generating of a rich va-riety of transverse patterns (from rolls or hexagons to spa-tial solitons) and has been extensively investigated, see, for example, (D’Alessandro and Firth, 1992; Denz et al., 1998; Arecchi et al., 2000; Ackemann and Lange, 2001; Agez et al., 2006). Here, it essentially consists of a nematic liquid crys-tal (LC) layer irradiated by a strong laser beam which is re-flected back onto the sample by a plane mirrorM placed at a variable distance d from the LC layer (Fig. 1). R is the mirror intensity reflectivity. The nonlinear medium is a 50 µm thick layer of E7 LC homeotropically anchored.
The beam is delivered by a monomode frequency doubled Nd3+:YVO4laser (λ0=532 nm) which is shaped by means
of two cylindrical lensesC1 andC2 in order to achieve a
transverse quasi-monodimensional (1-D) pumping (beam di-ameters≈240µm×3200µm). The optical distancedmay be positive or negative with the help of an optical system made of two lenses in a 4f-arrangement. Note that the equivalent medium is self-focusing (resp. defocusing) ifd >0 (resp.
d <0) (Ciaramella et al., 1993). The transmitted backward beamBoutis monitored by CCD cameras. Near and far fields
are simultaneously recorded. The two control parameters are the maximum intensityI0of the incident laser beam and the
distanced between the mirror and the LC layer. The reori-entation of the LC director by the laser electric field leads to a nonlinear change of its refractive indexnwhich depicts pattern formation (Firth, 1990).
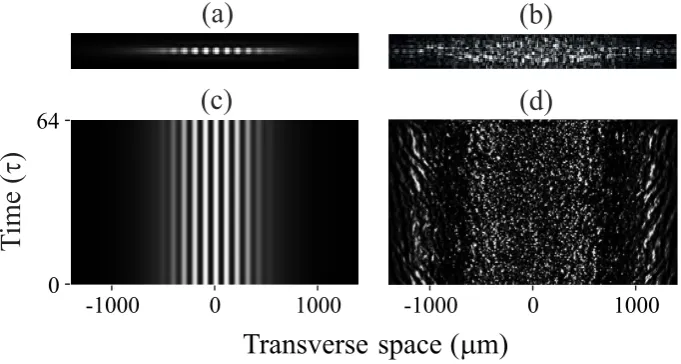
Typical 1-D transverse periodic pattern obtained at thresh-old for Turing instability is shown on Fig. 2a. It is the coun-terpart of modulational instability in temporal systems. In-deed, the optical Fourier transform of this near field pat-tern shows two spatial modes with critical wave numbers
k= ±2 √
λd. The temporal recording of the near field pro-file along the long axis of the pattern (horizontal on Fig. 2) shows that the dynamics is stationary (Fig. 2c). Below this threshold, the transmitted field through the mirrorMsimply reflects the overall Gaussian dependence of the laser input shape. On the other hand, as the input power is increased above the threshold, the periodic spots first destabilize via time pseudo-periodic dislocations associated with fringe cre-ation in the spatiotemporal diagram (Louvergneaux., 2001), then a regime of turbulence is reached for input laser field values very far above threshold (Fig. 2d). The associated pattern (Fig. 2b) is composed of a very large number of transverse modes and its spatiotemporal dynamics is rather chaotic (D’Alessandro and Firth, 1992).
No analytical studies of this strongly nonlinear regime (far beyond threshold) have been carried out, since the dynami-cal description in terms of amplitude equations fails. Indeed, these kind of studies are performed near threshold where
M Laser
LC
d
F
B
C1 C2
B
out CCDf y
z x
Fig. 1. Schematic sketch of the experimental set-up. LC liquid
crys-tal layer;Mfeedback mirror;Finput optical field;Bouttransmitted
backward optical field;Bbackward optical field;dfeedback length.
C1andC2cylindrical lenses.f near field imaging lens.
amplitude equations, mainly Ginzburg-Landau and Swift-Hohenberg equations, can be derived to describe weakly nonlinear dynamics above threshold (Cross and Hohenberg, 1993). To our knowledge, except the transition to this spa-tiotemporal chaotic regime using time-average patterns and correlation functions (Neubecker et al., 1999), and a charac-terisation of two different states based on correlation func-tions and on Karhunen-Loeve decomposition (Pastur et al., 2003), no other characterisation of this turbulent regime has been done up to now. Here, we adopt a different statistical approach in terms of PDF of pattern maxima for the anal-ysis of these highly nonlinear regimes. This evidence that rare and extreme peaks erratically appear in the pattern in the form of a very narrow spatial “pulse” with an amplitude far greater than the ones of the other intensity peaks of the transverse structure. In many aspects they are similar, and represent the spatial counterpart of what is known as rogue waves in hydrodynamics and very recently in optical tempo-ral fibre systems.
3 The model
The modelisation of the previous experimental setup is well described in the framework of a model introduced first by Akhmanov et al. (1988) and later adapted by Firth and d’Alessandro (Firth, 1990). The equation for refractive index
nof the nonlinear nematic LC layer which captures the dy-namics in the one-dimension case reads (D’Alessandro and Firth, 1992):
∂n ∂t −
∂2n
∂x2+n= |F|
2+ |B|2 (1)
T
ime (
)
t
0
1000
Transverse space (
m
m)
(a)
-1000
0
1000
-1000
0
64
(a)
(b)
(d)
(c)
Fig. 2. Near field transverse patterns observed at (a) threshold and (b) in the turbulent regime. (c, d) Spatiotemporal diagrams of the pattern
profile evolution taken along the horizontal axis and in the middle of the near field patterns (a) and (b), respectively. Transverse size of (a) and (b) pictures are 2800×350 µm. The numerical simulations have been performed following the model of Eqs. (1–3) for a Gaussian input wave pumping.w=1400 µm,χ=1,d=5 mm,R=0.9. (a, c)F0=0.92 and (b, d)F0=4.5.
lD, respectively. The diffusion lengthlD inside the crystal
is much larger than the optical wavelengthλ0, thus,
remov-ing the longitudinal interference effects. The small thickness of the Kerr medium allows neglecting light diffraction along the sample (Firth, 1990). F andB in Eq. (1) are the slowly varying amplitudes of the forward and backward fields inside the liquid crystal sample, respectively (Fig. 1).Bis obtained using the two following equations that govern the propaga-tion of F along the zoptical axis over the feedback loop. Equation (2) accounts for the phase modulation through the LC sample and Eq. (3) for the propagation through the free space (D’Alessandro and Firth, 1992):
∂F
∂z =iχ nF (2)
∂F ∂z =
i
2k0
∂2F
∂x2. (3)
χ parameterizes the Kerr effect (positive for a focusing medium,d >0) andk0is the laser field wave number. The
profile of the forward field at the entrance of the liquid crystal is assumed to be Gaussian so thatF (x)=F0exp(−x2/w2),
withwthe beam radius at sample.
Note that the quantity we can experimentally access is the backward output optical beam intensity that we have setI= |Bout|2 (see Fig. 1). This is our dynamical variable that is
monitored on the near field imaging CCD camera and that is used for the study of the probability density functions. It reads:
|Bout(x,t )|2= e
iχ n(x,t )B(x,t ) 2
(4)
4 Numerical rogue patterns
The numerical simulations carried out in the very nonlinear regime typically depict turbulent spatiotemporal dynamics of the near fieldBoutas can be seen on Fig. 2d. The
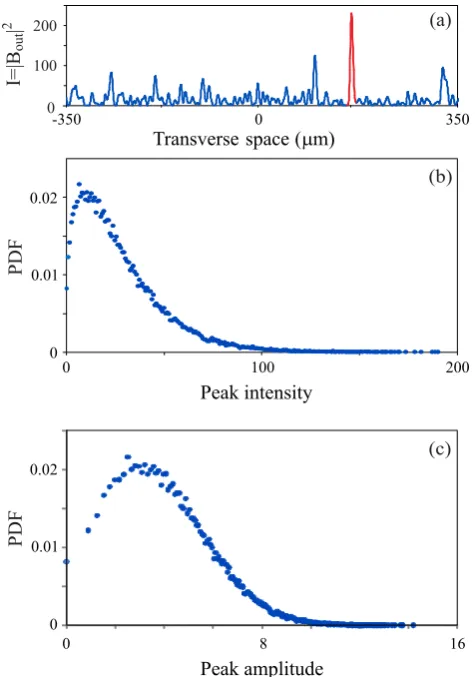
spatiotem-poral diagram is complex but a deeper look on the evolution of the transverse profile shows the existence of very intense spatial peaks as the one observed on Fig. 3a. It corresponds to a temporal snapshot of the transverse cross-section of the 1-D pattern (Fig. 2b) and representing a horizontal line of the corresponding spatiotemporal diagram in Fig. 2d. Such an intense peak is many times the intensity of the other sur-rounding peaks. To characterise these peaks, we proceed by a statistical approach using the probability density function (PDF) of the intensity of pattern peaks. We calculate the PDFs as the histograms of the intensity maxima along the 1-D spatial pattern for a given recording time (few hundreds of relaxation timeτ ). The PDFs must be plotted for uniform-like pumping conditions. So, we performed all our PDF cal-culations on a restricted spatial zone of the Gaussian input pump. This area is located in the central part and its exten-sion must be smaller than 0.5w(with 2wis the beam diam-eter) to keep the PDFs independent of the Gaussian shape.
A typical PDF profile associated with the turbulent regime is depicted in Fig 3b. It possesses a long tail that is char-acteristic of very strong events such as the one displayed in red in Fig 3a. To characterise these events as freak events, we use the criterion developed for the oceanic rogue waves and which states that their height must exceed 2 times the significant wave heightHs (Kharif and Pelinovsky, 2003).
In our system, the counterpart of the oceanic wave height is the optical near field peak amplitudeBout. Here the
I=|B
|
out
2
100
0 200
Peak intensity
100
(b)
-350 0 350
Transverse space (mm)
(a)
(c)
Peak amplitude
8 16
Fig. 3. (a) Transverse cross-section of 1-D pattern of Fig. 2b taken
along the horizontal axis showing a typical spatial rogue event (red peak). (b) Associated numerical probability density function (PDF) versus peak intensity. (c) PDF versus peak amplitude. The numer-ical simulations have been done following the model of Eq. (1) for a Gaussian input wave pumping. w=1400 µm,χ=1,d=5 mm,
F0=4.5,R=0.9.
slightly exceeds 2 timesBout,s (Fig. 3c). The percentage of
peaks of this PDF that have an amplitude 2 times larger than that of the significant peak amplitude is about 0.8%. Thus, all of them can be classified as rogue peaks.
Another characteristic of rogue events is that they appear and disappear in a very “short” time. Here, their lifetime are of the order of the relaxation timeτ of the system, namely, less than 0.5 timesτ which is the temporal resolution of our numerical simulations. Thus, the very intense spatial peaks of our system “appear from nowhere and disappear without a trace” which is one of the established signatures of the rogue waves in both the ocean and in the fibre supercontinuum gen-eration (Akhmediev et al., 2009).
Peak intensity (gray values) Transverse space (mm)
0 50 100 150 200 250
0
100 200
0 200 400 600
(a)
I=|B
|
out
2
(gray values)
0 0.01 0.03
0.04 (b)
PDF 0.02
Fig. 4. (a) Transverse cross-section of a 1-D experimental
pat-tern taken along the horizontal axis showing a typical experimental spatial rogue event (red peak). (b) Associated experimental prob-ability density function (PDF) versus peak intensity. d=5 mm,
w=1600 µm. Input intensity is 6 times intensity threshold for mod-ulational instability.
5 Experimental evidence of rogue patterns
The experimental study of the spatiotemporal chaotic regime is carried out in an optical system pumped by a transverse quasi-one-dimensional (1-D) laser beam. As was mentioned in the experimental setup description, only one roll is al-lowed in the vertical transverse direction. In these condi-tions, a line of spots similar to the one of Fig. 2a rises up at threshold of the modulational instability. Further increas-ing the laser pump power, the regime of spatial turbulence is reached. However, the liquid crystal slice can not be ap-proximated to a Kerr-like system for very high pump powers where spatial self-focusing starts (for typically pump powers larger than 6 to 8 times the threshold for modulation instabil-ity). The 1-D pattern then expands in the transverse orthogo-nal direction to the 1-D horizontal axis (Khoo, 1995) and can no more be considered as a 1-D pattern. Thus, a limitation on the maximum input pump intensity value exists restricting the spatiotemporal chaotic regime domain that can be studied experimentally. Even under these restrictions it is still suffi-cient to experimentally evidence the regime of spatial rogue events.
is completely similar to the one predicted in Fig. 3b and is a signature of spatial rogue peaks in the 1-D transverse pat-terns. Only a shift is observed on the horizontal axis due to the presence of the CCD zero intensity background. As for the numerical simulations, the experimental highest am-plitude value (Fig. 4b) exceeds 2 times ( 2.1) the significant peak amplitudeBout,s=7.14, so that the criterion for rogue
event is fulfilled. Thus, the occurrence of rogue spatial peaks in the turbulent regime of 1-D transverse patterns is experi-mentally evidenced.
6 Conclusions
Using a statistical approach, we have numerically and experimentally evidenced the generation of rogue spatial peaks in the one-dimensional transverse patterns of a liquid crystal slice subject to optical feedback. The regime in which they occur is highly nonlinear (far above the threshold for modulational instability also known as Turing instability) and corresponds to a turbulent spatiotemporal dynamics. The probability density function shows the very rare nature of these events. In addition, the spatiotemporal diagrams of the 1-D patterns demonstrate their very short lifetime. More importantly, the spatial rogue patterns evidenced here are similar to many aspects to the rogue waves encountered in open ocean and supercontinuum generation in photonic crystal fibres.
Edited by: E. Pelinovsky
Reviewed by: V. Konotop and another anonymous referee
The publication of this article is financed by CNRS-INSU.
References
Ackemann, T. and Lange, W.: Optical pattern formation in alkali metal vapors: Mechanism, phenomena and use, Appl. Phys. B, 72, 21–34, 2001.
Agez, G., Glorieux, P., Taki, M., and Louvergneaux, E.: Two-dimensional noise-sustained structures in optics: Theory and ex-periments, Phys. Rev. A, 74, 043814, 2006.
Agraval, G. P.: Nonlinear fibre optics, Academic Press, San Diego, California, 26 pp., 1995.
Akhmanov, S., Vorontsov, M., and Ivanov, V. Y.: Large-scale trans-verse nonlinear interactions in laser beams; new types of non-linear waves; onset of optical turbulence, JETP Lett., 47, 707, 1988.
Akhmediev, N., Ankiewicz, A., and Taki, M.: Waves that ap-pear from nowhere and disapap-pear without a trace, Phys. Lett. A, 373, 675–678, doi:10.1016/j.physleta.2008.12.036, http: //www.sciencedirect.com/science/article/B6TVM-4V74XJY-3/ 2/537aefb6736ea6c45fc2fa3a2420c39d, 2009.
Arecchi, F., Boccaletti, S., Ducci, S., Pampaloni, E., Ramazza, P., and Residori, S.: The liquid crystal light valve with optical feed-back: a case study in pattern formation, J. Nonlinear Opt. Phys., 9, 183, 2000.
Bludov, Y. V., Konotop, V. V., and Akhmediev, N.: Rogue waves as spatial energy concentrators in arrays of nonlinear waveguides, Opt. Lett., 34, 3015–3017, doi:10.1364/OL.34.003015, http://ol. osa.org/abstract.cfm?URI=ol-34-19-3015, 2009.
Broad, W.: Rogue giants at sea, The New York Times, http://www. nytimes.com/2006/07/11/science/11wave.html, July 11 2006. Ciaramella, E., Tamburini, M., and Santamato, E.: Talbot assisted
hexagonal beam pattening in a thin LC film with a single feed-back miror at negative distance, Appl. Phys. Lett., 63, 1604, 1993.
Cross, M. C. and Hohenberg, P. C.: Pattern formation outside equi-librium, Rev. Mod. Phys., 65, 851, 1993.
D’Alessandro, G. and Firth, W. J.: Hexagonal spatial patterns for a Kerr slice with a feedback mirror, Phys. Rev. A, 46, 537–548, 1992.
Denz, C., Schwab, M., Sedlatschek, M., Tschudi, T., and Honda, T.: Pattern dynamics and competition in a photorefractive feedback system, J. Opt. Soc. Am. B, 15, 2057–2064, http://josab.osa.org/ abstract.cfm?URI=josab-15-7-2057, 1998.
Du, L., Chen, Q., Lai, Y.-C., and Xu, W.: Observation-based control of rare intense events in the complex Ginzburg-Landau equation, Phys. Rev. E, 78, R015201, doi:10.1103/PhysRevE.78.015201, 2008.
Dudley, J., Genty, G., and Eggelton, B.: Harnessing and control of optical rogue waves in supercontinuum generation, Opt. Express, 16, 3644–3651, 2008.
Fedele, F.: Rogue waves in oceanic turbulence, Physica D: Nonlin-ear Phenomena, 237, 2127–2131, doi:10.1016/j.physd.2008.01. 022, euler Equations: 250 Years On – Proceedings of an interna-tional conference, 2008.
Firth, W. J.: Spatial instabilities in a Kerr medium with single feed-back mirror, J. Mod. Opt., 37, 151–153, 1990.
Ganshin, A. N., Efimov, V. B., Kolmakov, G. V., Mezhov-Deglin, L. P., and McClintock, P. V. E.: Observation of an Inverse Energy Cascade in Developed Acoustic Turbu-lence in Superfluid Helium, Phys. Rev. Lett., 101, 065303, doi:10.1103/PhysRevLett.101.065303, 2008.
Hammani, K., Finot, C., Dudley, J. M., and Millot, G.: Optical rogue-wave-like extreme value fluctuations in fibre Raman am-plifiers, Opt. Express, 16, 16467–16474, 2008.
Kasparian, J., B´ejot, P., Wolf, J., and Dudley, J.: Optical rogue wave statistics in laser filamentation, Opt. Express, 17, 12070–12075, 2009.
Kharif, C. and Pelinovsky, E.: Physical mechanisms of the rogue wave phenomenon, Eur. J. Mech. B/Fluids, 22, 603–634, 2003. Khoo, I.: Liquid crystals : physical properties and nonlinear optical
phenomena, John Wiley & Sons, 225 pp., 1995.
2003.
Louvergneaux, E.: Pattern dislocation-type dynamical insta-bility in 1-D optical feedback Kerr media with gaus-sian transverse pumping, Phys. Rev. Lett., 87, 244501, doi:10.1103/PhysRevLett.87.244501, 2001.
Montina, A., Bortolozzo, U., Residori, S., and Arecchi, F. T.: Non-Gaussian Statistics and ExtremeWaves in a Nonlinear Optical Cavity, Phys. Rev. Lett., 103, 173901, doi:10.1103/PhysRevLett.103.173901, 2009.
Mussot, A., Kudlinski, A., Kolobov, M., Louvergneaux, E., Douay, M., and Taki, M.: Observation of extreme temporal events in CW-pumped supercontinuum, Opt. Exp., 17, 17010, doi:10.1364/OE.17.017010, 2009.
Neubecker, R., Thuring, B., Kreuzer, M., and Tschudi, T.: Transition from Spatio-temporal Order to Disorder in a Single-feedback Experiment, Chaos, Solitons & Fractals, 10, 681–692, doi:10.1016/S0960-0779(98)00016-2, http: //www.sciencedirect.com/science/article/B6TJ4-41DJHY2-8/2/ aa02cad8d6a35dcafc75b506ba992c1b, 1999.
Onorato, M., Osborne, A. R., Serio, M., and Bertone, S.: Freak Waves in Random Oceanic Sea States, Phys. Rev. Lett., 86, 5831–5834, doi:10.1103/PhysRevLett.86.5831, 2001.
Pastur, L., Bortolozzo, U., and Ramazza, P.: Experimental charac-terization of space-time chaos in nonlinear optics, in: EXPER-IMENTAL CHAOS, edited by: In, V, Kocarev, L., and Carroll, T. L., Gluckman, B. J., Boccaletti, S., and Kurths, J., 676 of
AIP CONFERENCE PROCEEDINGS, 182–188, 7th
Experimen-tal Chaos Conference, SAN DIEGO, CA, 26–29 August 2002, 2003.
Shats, M., Punzmann, H., and Xia, H.: Capillary Rogue Waves, Phys. Rev. Lett., 104, 104503, doi:10.1103/PhysRevLett.104. 104503, 2010.
Solli, D. R., Ropers, C., Koonath, P., and Jalali, B.: Optical rogue waves, Nature, 450, 1054–1058, 2007.
Solli, D. R., Ropers, C., and Jalali, B.: Active Control of Rogue Waves for Stimulated Supercontinuum Generation, Phys. Rev. Lett., 101, 233902, doi:10.1103/PhysRevLett.101.233902, http: //link.aps.org/abstract/PRL/v101/e233902, 2008.