Themed Section: Science and Technology
Comparative Analysis of Signal Strength in South-South
Nigeria
Uzairue Stanley1, Akpamu Jean2, Olaitan Alashiri1
1Electrical and Information Engineering, Covenant University, Nigeria
2Department of Electrical and Electronic Engineering, Ambrose Alli University, Nigeria ABSTRACT
Losses has become the major drawback that is being faced by telecommunication sector in Nigeria and the world at large. Many researchers have carried out several researches in this area using different methods. Empirical method was adopted in this research work because it involves the measurement of field data, RF signal tracker was installed in a mobile phone called Samsung galaxy pocket, and this software gave us the distance to site (base station) and the signal strength level of the network provider at a particular distance, cell ID etc. From data obtained, it was noticed that the calculation of path loss using log – distance model which is deterministic is not as accurate as the generated empirical model, the generated model gave a better and more accurate result than the existing ones. Model was developed to calculate the received signal strength in Ujoelem, Ekpoma Nigeria and the model was named “Uzairue model”.
Keywords : Path-loss, Signal Strength, Distance, Location, Model
I.
INTRODUCTIONIn Nigeria, there has been more expectation rolled out in rural areas covering over 50 % government area and at least 5000 communities and villages. The result of this will be the availability of spares capacity that can be utilized by other interest for conveying data, video and voice. This advancement informs Nigeria‟s present rating as the fastest growing telecommunication market in Africa [5]. There is no doubt that the telecommunication sector has united the whole world within a second, business is on the wheel globally [6]. Nevertheless, considering the previous relationship existing questions are now; does this global system for mobile communication have impact on Nigeria economy? Does it contribute to job creation and crime reduction? [2]. As the world is increasing in population, developmental activities and technologies increase daily, also problems begins to arise in the communication services, like traffic in
Communication system is made up of three main systems: the transmitter (TX), the receiver (RX) and the transmission medium as shown in Fig.1. It is desirable to understand the medium‟s statistical characteristics in order to predict the medium behavior. The signal processing method then will be developed and used properly to ensure that the transmission medium between the transmitter and the receiver is as reliable as possible. Therefore, understanding the medium characteristics plays an important role in designing and optimizing communication system. The medium is exposed to noise, distortion and other disturbance sources leading to the variation of the received signal power [16, 7]. In wireless channels, the path loss exponent (PLE) has a strong impact on the quality of links, and hence, it needs to be accurately estimated for the efficient design and operation of wireless networks [11]. The wireless channel presents a formidable challenge as a medium for reliable high-rate communication. It is responsible not only for the attenuation of the propagated signal but also causes unpredictable spatial and temporal variations in this loss due to user movement and changes in the environment. In order to capture all these effects, the path loss for RF signals are commonly represented as the product of a deterministic distance component (large-scale path loss) [13].
Considering the losses during transmission of electrical, electronic, microwaves signal from the transmitter to the receiver in our communication industries, and also considering the importance of these industries in our social, physical life and in the growth of world economy, there are needs to
determine the path loss of the signal transmitted from the sending end to the receiving end and the penetration level in our home i.e. determining how our house appliances, buildings, trees and other factors affect the signals and with the view of providing the methods in which the losses (path loss) can be minimize [10]. The critical problems that are encountered by communication industries in Nigeria have contributed to the down fall of telecommunication industries worldwide and Nigeria inclusive, here are some of the highlighted problems [14].
a.
The GSM problems, which include call rejection.b.
Call fading during communication. Example; asituation whereby customer on call suddenly experiences reduction in speech volume from the person making the call to the person receiving the call [1].
c.
In the place of microwave links; A situation whereby the uplink and downlink suddenly send and receive at a lower rate or no transmission.Due to these effects and how the communication industries have been affected by these effects, there are needs to try as much as possible to eliminate or reduce these drawbacks that affect our communication industries [8].
II.
MATERIALS AND METHODOLOGYThe following steps were adopted in actualizing this research;
a.
Measurement of necessary data with software called RF signal tracker; this software gives the GSM signal strength of the network provider; in this work a particular network provider was put into consideration.c.
A fixed distance was taken from the base station to the receiver and in this research work a particular fixed reference distance was taken as 100m from the base station which will be represented as d0 and a variable distance which is represented as di.d.
The following parameters were recorded, distanceto site and the signal strength of the network, the distance was in kilometer and the signal strength was in decibel.
e.
The data was measured for six months; this period was taken in order to have a clear picture of the variation of the signal strength based on the distance to site and in order to have a clear analysis of the data measured.a. Measurement Procedure
The general approach was to measure the signal strength level of a particular GSM network provider‟s signal strength in Ujoelem Ekpoma, South-South, Nigeria. The chosen location attenuations were then computed. The Samsung galaxy pocket handset and A GSM network provider SIM card were used to conduct the measurement campaign. Readings were taken only when there was a change in the distance to site indicated by the RF signal tracker. And these readings were taken from the beginning of the chosen location and the readings were recorded, the corresponding distances to sites and their signal strengths were also recorded. The geographical location parameters and their descriptions were all recorded. These were taken from the beginning of the tested locations and the parameters included: mobile latitude, mobile longitude, mobile heading, site bearing, GPS accuracy and speed. The GPS function of the Samsung galaxy pocket must be switched ON before the RF signal tracker can work otherwise, it will fail to function.
b. Measurement Conditions
Measurements were taken five different times for each of the locations for a period of six months, the average of each of the month at the following distances; 1km,
2km, 3km, 4km and 5km were taken and recorded as shown in Table 1. This was to allow a clear picture of the variation of value.
III.
DATA PRESENTATIONMean of the Signal Strength/Received Power for the Different Months.
This portion of the research work shows the mean of the signal strength/received power at different distances. The mean of signal strength was calculated by adding the values of the signal strength received on each day of the month divided by the number of days in the particular month. The mean of the different months is as shown in the table below:
IV.
CALCULATION OF SIGNALThis portion of this research deals with determination of signal and it is based on classical theories and empirical data which were collected from measurements, the classical theory is on the log-distance path loss model. The mean value of the path loss exponent for a shadow urban cellular radio was taken for the outdoor calculation/computation. Empirical data gotten were used to derive the model. These data included;
1. The received signal strength denoted by Pr 2. The transmitter-receiver separation distance
which is taken as 100m denoted by d0
A.
Outdoor Calculations
22 2
4 log 10 log 10 ) ( d p p dB PL r t
(1) Operating frequency was taken as 1800MHzWavelength,
= speed of light/frequency m f c 167 . 0 10 1800 10 3 6 8 And d0 = 100m
(which is the fixed distance)
22 2
100 142 . 3 4 167 . 0 log 10 ) (dB PL
= 77.5 dB
0775 . 0 1000 5 . 77 )
(d0
PL dBm.
Note that,
Path loss, PL (dBm) = PL (d0) - 10nlog 0 d d (2)
This equation is based on theoretical calculation for outdoor (Longley, 1978).
Note that, value of n =
n2 (3) And n = 4 (the path loss exponent values for shadowed urban environment).B. Calculation of Path Loss Using Existing Equation (log-distance path loss model)
At distance d = 1km,
PL(dBm) = -40.02dBm. At distance d = 2km,
PL(dBm) = -52.02dBm. At distance d = 3km,
PL(dBm) = -59.12dBm. At distance d = 4km,
PL(dBm) = -64.12dBm. At distance d = 5km,
PL(dBm) = -67.92dBm.
C. Generation of Mathematical Model
This generated model was named Uzairue‟s modified log-distance model, which is written mathematically as; 0 0) 10 log
( ) ( d d n U d PL dBm PL i (4)
Where U(i-1) for i = distance to site, 1km,2km,3km,4km,5km…..nkm.
U = modelled loss constant =
power calculated power received measure
PL (dBm) = model or signal generated reception level for outdoor environment.
PL (d0) = path loss within the antenna distance i.e., 100 square meters around the transmitters (base station).
U = the loss constant, which is also known as the path loss exponent, which varies with the distance and mathematically represented as;
c m p p
U (5)
Pm = mean of the measured signal strength Pc = mean of the calculated signal strength
Calculation of U (modeled loss constant) For Each of the Locations for the Research Period
VI.
CALCULATION OF SIGNAL USING UZAIRUE‟S LOG-DISTANCE GENERATED MODEL ANDGENERATED LOSS CONSTANT
0
log 10
d d n U do PL dBm
PL i
And the loss constant for each of the locations for the
period tested has been calculated from Table 2-7. Recall that, PL (d0) = 0.0775 (which was gotten from this equation
Table 2 -7: Shows the Summary of the Comparison between Path Loss Values from Measurement and Using Model Equation
2 2 24 log 10
d dB
PL
.
di = variable distance of the base station d0 = fixed or reference distance
n = 4 (mean of the path loss exponent of a shadow urban environment) and U has been calculated which is the generated loss constant. Table 8-13 shows the comparison of the Results Obtained between the Path Loss Values from Measurement, Using
Deterministic/Theoretical Model (log-distance path loss model) and The Generated Empirical Model (Uzairue‟s modified log-distance model) For the Period Used „‟Ujoelen Ekpoma‟
Graphical Results Presentation
Figure 2. Graphical Representation of Ujoelen, Ekpoma Location For The Month Of October, 2016
Figure 3. Graphical Representation of Ujoelen, Ekpoma Location For The Month Of November, 2016
Figure 4. Graphical Representation of Ujoelen, Ekpoma Location For The Month Of December, 2016
Figure 5. Graphical Representation of Ujoelen, Ekpoma Location For The Month Of January, 2017
Figure 6. Graphical Representation of Ujoelen, Ekpoma Location For The Month Of February, 2017
-73.8 -73.4 -76.9 -75 -77.7
-40
-52
-59.1 -64.1
-67.9
-73.6 -73.4 -76.8 -75 -77.5
-100 -80 -60 -40 -20 0
1 2 3 4 5
PL(dBm) From Measurement
PL(dBm) From Existing Model Equation
PL(dBm) From Uzairue’s log-distance model
-71.4 -69 -67 -71.7 -71
-40
-52
-59.1 -64.1
-67.9
-72 -67.6 -66.7 -71.7 -70.7
-80 -60 -40 -20 0
1 2 3 4 5
PL(dBm) From Measurement
PL(dBm) From Existing Model Equation
PL(dBm) From Uzairue’s modified log-distance model
-74.2 -75.6 -75.8 -76.5 -74.8
-40
-52
-59.1 -64.1
-67.9
-74 -75.4 -76.8 -76.2 -74.7
-100 -80 -60 -40 -20 0
1 2 3 4 5
PL(dBm) From Measurement
PL(dBm) From Existing Model Equation
PL(dBm) From Uzairue’s modified log-distance model
-73.3 -69.5 -73.1 -73.3 -75
-40
-52
-59.1
-64.1 -67.9
-73.2 -69.2 -73.8 -73 -74.7
-80 -60 -40 -20 0
1 2 3 4 5
PL(dBm) From Measurement
PL(dBm) From Existing Model Equation
PL(dBm) From Uzairue’s modified log-distance model
-73.3 -69.5 -73.1 -73.3 -75
-40
-52 -59.1
-64.1 -67.9
-73.2 -69.2 -73.8 -73 -74.7
-100 -50 0
1 2 3 4 5
PL(dBm) From Measurement
PL(dBm) From Existing Model Equation
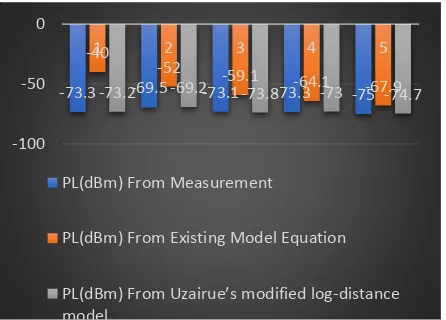
Figure 7. Graphical Representation of Ujoelen, Ekpoma Location For The Month Of March, 2017
VIII.
CONCLUSION
From the results obtained above from table 8 to 13, it was observed that the path loss values obtained using the existing model (which is the log-distance model) is deterministic and was totally far from the measured data from the network provider using RF signal tracker (the raw data from the telecommunication company). Now comparing the measured data (RF signal tracker) with the value from the generated model (uzairue‟s modified log-distance model), we can see from figure 2 to 7 that the values are almost the same with little or no variation.
Hence, the generated model (Uzairue‟s modified log-distance model) is more reliable and gives a better result than existing model (Log-Distance model) and that the generated model can be used in the calculation of path loss values for a particular location by inputting the necessary parameters.
IX.
REFERENCES
[1]. Anyasi Francis and Uzairue Stanley (2014) "Determination of GSM Signal Strength Level in Some Selected Location in EKPOMA‟‟ IOSR Journal of Electronics and Communication Engineering (IOSR-JECE) Volume 9, PP 08-15
[2]. Sharma, P.K. (2013) International journal of Engineering Science and Technology, Vol.2 (6), 2010, 2008-2013.
[3]. Sharma, H.K. Sahu, S. and Sharma, S. (2011) "Enhanced Cost231 W.I. Propagation Model in Wireless Network" International Journal of Computer Applications, volume 19- No 6. [4]. Thiago, H, (2001), "A System For Propagation
Analysis In Mobile Communication Environments" Institute Nacional De Telecommunicacoes, Voll. 04. No.2.
[5]. Armoogum.V, Soyjaudah.K.M.S, Fogarty T. and MohamudallyN. (2007) "Comparative study of Path loss using existing models for Digital Television Broadcasting for Summer, Mauritius Vol. 4, pp 34-38,May Season in the north of Mauritius", Proceeding of Third Advanced IEEE
International Conference on
Telecommunication.
[6]. Domazetovic, A. Greenstein, L. J. Mandayan, N. Seskar, I. (2002) "A New Modeling Approach for Wireless Channels With Predictable Path Geometries," IEEE Beh. Tech. Conf.
[7]. Arne Schmitz and Martin Wenig (2008) "The Effect of the Radio Wave Propagation Model in Mobile Ad Hoc Networks" Proceedings of World Academy of Science, Engineering And Technology Volume 36 December 2008 ISSN 2070-3740
[8]. Saunders, S. (2000) "Antennas and Propagation for Wireless Communication Systems", Wiley, 409
[9]. Balogun, J. (2000) "Impact of GSM on Economy and Development"
[10]. Rappaport, T. S. (2002)"Wireless Communications Principles and Practice", Prentice Hall
[11]. Andrea Goldsmiths (2005) "Wireless Communications," Cambridge University Press, vol. 7, pp. 43-67
[12]. Carlson, A. B. Crilly, P. B. Rutledge, J. C. (2002) "Communication Systems, An Introduction to
-73.3 -69.5 -73.1 -73.3 -75
-40
-52 -59.1
-64.1 -67.9
-73.2 -69.2 -73.8 -73 -74.7
-100 -50 0
1 2 3 4 5
PL(dBm) From Measurement
PL(dBm) From Existing Model Equation
Signal and Noise in Electrical Communication," 4th Edition, McGraw-Hill, 2002
[13]. Remley, K. A. Anderson, H. R. Weisshar, A. (2000) "Improving the Accuracy of Ray-Tracing Techniques for Indoor Propagation Modeling," IEEE Trans. Veh. Tech., pp.2350-2358
[14]. ITU (2009) "What Really is a Third Generation (3G) Mobile Technology" IEEE Vol.6,No 28 pp.57-87
[15]. International Engineering Consortium (2005). Global System for Mobile Communication (GSM), IEEE Vol.5,No 23 pp.56-70