Themed Section: Science and Technology
Comparative Analysis of Electrical Parameters for Three Phase
Busbar Trunking System
Shivraj P. Kalane, Prof. C. M. Bobade
Department of Electrical Engineering, G. H. Raisoni College of Engineering & Management, Amravati, Maharashtra, India
ABSTRACT
Busbar Trunking system is one of the most widely used in electrical power distribution in place of cable. The major reasons behind the popularity of the BBT is flexibility in design, on-site installation times are reduced, most efficient, safe and ideal system for electricity supply to industrial installations and high rise structures. Busbar Trunking system is the need of electrical power distribution for low voltage and high current system. Due to all reasons, basic design of Busbar Trunking System and effect of electrical parameters on design and operation of Busbar Trunking System must be studied and analyse. Larsen & Toubro is currently in the process of designing and testing of BBT for low or medium voltage and higher current ratings. For the design of busbar trunking system used the standard IEC 61439 part 1 and part 6. As a consequence they are undertaking considerable research into the design and operation of busbar and the factors affecting the busbar. This project was undertaken in order to comprehensively understand the effect of various phenomena such as skin effect, proximity effect, inductance, magnetic fields, electrodynamics forces, contact resistance and permittivity of insulation material on the performance of busbar trunking system and its significance in design in real time scenario. Another study that was undertaken for examine the temperature rise and its effects on a busbar trunking system under normal operating conditions. The approach to these tasks involved considerable research, the use of mathematical tools for the implementation and verification of any developed mathematical models, and in some cases the use of software such as FEMM to understand certain phenomena affecting busbars. Additionally, certain physical testing was also undertaken on a model at the Switchgear Testing Laboratories.
Keywords: Busbar, Skin Effect, Proximity Effect, Electrodynamic force, FEMM, Magnetic Field, Reactance.
I.
INTRODUCTIONBusbar Trunking System is an assembly comprising a system of conductors with one or more bars separated or supported by insulating material and contained in a conduit or similar casing. In electric power distribution, busbar is a metallic strip or bar that conducts electricity within switchgear, distribution board, substation, battery bank, or other electrical apparatus. BBT system performs the function of
operating conditions, the direct and indirect effects of these phenomena on the busbars and provide some standardized procedures and mathematical models to cross-check existing designs and put these all together in a user-friendly manner for use by the design engineer. The main objective of the work was to study and understand various electrical parameters and their effects on the design and operation of busbar trunking systems. Develop a mathematical model for the calculation of certain basic parameters of a busbar impedance and analysis with software result. A study of the impacts of fault currents was also required, especially the resulting electromagnetic forces, and a study of the mechanical strength of the enclosure based on these studies. Additionally, there was a requirement to study the temperature rise of the busbars under normal operating conditions. Finally tested the permittivity of insulating material by performing the high voltage test and suggest the new insulating material for BBT and also calculate the contact resistance between the joints of BBT system for two shapes of spring plate.
II.
LITERATURE REVIEWAccording to F.Delgado, C.Renedo, A.Ortiz, The thermal behaviour of an industrial Low Voltagenon-segregated three-phase Busbar Trunking is analyzed by means of the comparison of a 3D numerical model with experimental results. This model has been carried out using COMSOL Multiphysics, software based on finite element method. The numerical model replicates the short-circuit test, using the same geometry configuration and the boundary conditions of the laboratory in which this assay is carried out. The standard IEC 61439 is applied, both in test and model, in order to obtain the steady state temperatures in several parts of the busbar system. As a result of the data comparison can be concluded that the experimental testis replicated with sufficient accuracy by the numerical model. In fact, the average error of all the temperatures is smaller than 5%.As a
general conclusion, the numerical model developed can be considered accurate enough to use it in the first steps of the busbar design. A thermal model of a low voltage non-segregated three-phase assembly is developed in this article using COMSOL Multiphysics with the intention to obtain a computational prototype which eases us the design of this type of BBT. The model results are validated by means of the comparison with the results of a heating test. This test has been performed according IEC standard.
According to Agus Risdiyanto, Maulana Arifin, Umar Khayam, Suwarno, The measurement of temperature on busbar connection based on contact resistance and plating material in relation to the value of contact resistance. This study is intended to prevent failure when busbar connection is attached. The failure of the electrical connection can occur due to bad contact so that the contact resistance is increased, high losses, overheating, and it can even cause a fire hazard. There are three test samples of modeled: copper busbar connection without plating, copper busbar connection with nickel plating and copper busbar connection with silver plating. The contact resistance of each sample was measured at contact pressure of 12 MPa. Subsequently the samples loaded with the current of 350A and temperature at the connection was measured and simulated until steady state condition reached. The results show that the temperature at the contact area is higher than that of busbar appears caused by the contact resistance. Both measurement and simulation results show that busbar connection with silver plating having lower contact resistance and lower maximum temperature, followed by the connection with the nickel plating and busbar connection without plating.
development of the busbar technology. However, with increasingly demand in building applications, it is needed to be developed for the high-performance and multi-functional busbar. The materials used as busbars and then different busbar types are given. After that, the busbar model and parameters are discussed. Finally, some failure events of the busbar system happened in cities are introduced and the reasons are analyzed, as well as some solutions proposed In modern cities, there are lots of the high-rise buildings in different districts, the majority of these buildings adopted the busbar system for power transmission because of the limited space and reliability consideration. In generally, the building lifetime is more than 50 years, but the busbar lifetime is generally not as long as that. So it is very important to design, construct and maintain the busbar system for the buildings.
III.
PROPOSED WORK & IMPLEMENTATION3.1 Calculation of Total Impedance of BBT
This led to attempts to arrive at a mathematical model for the calculation of impedance of the busbars for various Current rating and available cross sectional area. Calculations have been carried out for standard three phase models of busbar conductors. These models were developed under the stipulation that they must be applicable to any material, frequency and current rating (i.e. to any dimensions considered for cross-section), and for any length of busbar. This model is based on the assumption that the proximity effect only extends to adjacent busbars (justified by the large distance between the two external conductors). As an industry standard, the impedance of the external phase conductor has been calculated. The values of resistance have been calculated at both 20 deg. Celsius and 80 deg. Celsius. The effect of the presence or absence of insulation was neglected. General calculations were done for a busbar conductor length of 1m. Any possible effect of or on neutral or earth conductor is also neglected entirely.
For the purposes of testing the models, developed several busbar dimensions, as specified in the catalogues of several companies were used. The following values for Aluminium and Copper conductor dimensions For Sandwich Insulated Busbar Trunking System.
Table 1:- Aluminium conductor dimensions For Sandwich Insulated Busbar
Trunking System.
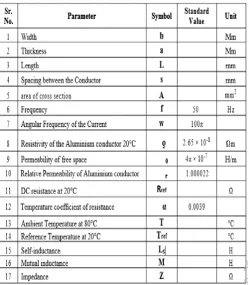
Table 2:- Basic Parameter For Calculate the Impedance of Busbar Trunking System.
The first step in this method is to calculate the DC resistance at 20°C using the standard formula,
When DC current flow through the conductor then Resistance of the conductor (Rref)
However the DC resistance at 80°C was required and thus the following standard formula was employed DC Resistance of the conductor at 80°C (RDC at 80°C)
Calculation of Reactance
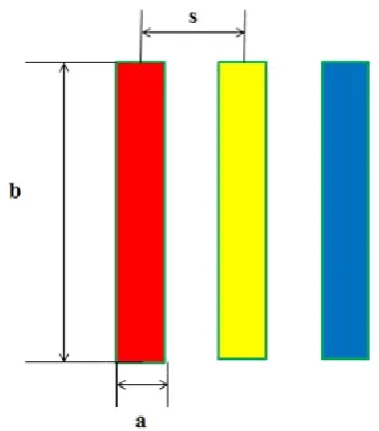
Upon examining several papers it becomes clear that industrial and academic researchers are alike in stating that for the calculation of reactance, proximity effect is, in general, universally ignored, and the reactance is determined using any number of available formulae for self and mutual inductance. After safely concluding that this was the accepted norm, and not just an anomalous assumption, it was considered useful to proceed with the calculation of reactance by finding the inductance of the conductor. The Three Phase Rectangular Busbar System as shown in figure3.1.Figure3.1 also indicates the width (b), thickness (a), Spacing between the conductors (s).
Figure 3.1: Three Phase Rectangular Busbar System.
For three phases R, Y and B, inductance may be calculated for each phase using the
Following method
Here Dm represents the geometric mean distance
Ds represents the geometric mean radius of the
conductor, unless each phase is made up of several conductors in which case it represents the distances between the conductors of the phase.
Geometric Mean Distance from Itself
Ds = 0.2235 (a + b) (3.8)
Reactance can be calculated using the following formula,
X = 2 ₓ π ₓ f ₓ L (3.9)
This technique provides a method for finding the Reactance aluminium conductor when alternating current flowing through the conductor.
Impedance for each Phase is given by,
Z = R+J X (3.10)
3.2 Electrodynamic Force Calculations
In the event of a fault in the system, short circuit currents may arise, and these currents lead to electrodynamic forces between the conductors of the low voltage busbar trunking system. Based on a prediction of these forces, sizing and design of the conductors, enclosures, accessories, support structures
etc. so that they are mechanically strong enough to withstand these forces. Generally these electrodynamic forces are considered to last for duration of one second for the purposes of calculation. In the case of two conductors that have currents flowing in the same direction, forces of attraction are experienced, and repulsion forces in the event of current flow in opposite direction. A tentative model was developed based on certain assumptions and these assumptions were validated through further study of available literature. The following are the formulae for the calculation of forces during occurrence of a three phase fault in the circuit [21]. The formula for the calculation of maximum force for one of the external conductors is as follows
(3.11)
The formula for the calculation of maximum force for the central conductor is as follows:
(3.12)
Where,
F1max, 3ph represents the force of the external conductors,
F2mx, 3ph represents the force of the central conductor,
Irms is the rms value of the short circuit current,
d represents the spacing between the two conductors under consideration
Therefore,
3.3 HV and Impulse Voltage Testing on Insulation Certain tests on the cross section of the busbar trunking system were also carried out. This model included four conductors of 6mm thickness (in keeping with the three phase, four wire system being designed where one bar each represents the three phases andone bar represents the neutral), wrapped in class F type insulation, surrounded by aluminium or galvanized iron enclosure. This model required assembly, and to this end the required length of bar was cut off a rectangular aluminium bar. The bars were then wrapped with insulation around each of the four aluminium bars and the model was assembled. As part of a joint project undertaken by the busbar trunking design team and the plastics team, thermal and high voltage testing were carried out on the model. Thermal testing was carried out by heating the model to various temperatures and for various durations in a high temperature oven. For high voltage testing (also known as dielectric withstand test), high voltages were applied between the conductors of various phases and the enclosure. These tests were carried out to test the resilience of the insulator.
As per IEC 60950, the basic test voltage for high voltage test is the 2 X (Operating Voltage) + 1000 V. The test duration must be in accordance with the safety standard being used. The test time for most standards, including products covered under IEC
60950, is 1 minute. In HV test, I will check the two insulating material for different temperature condition. These two materials are PET (polyethylene terephthalate) and mica polyester. Both the materials are class F type insulation. These tests are used to ensure, permittivity and dielectric strength of an insulating material.
3.4 Contact Resistance between the Joints
load.
IV.
RESULTThis Finite Element Magnetics Method (FEMM 4.2) software which has been used for analysis purpose. This also includes how to model a BBT system and perform different analysis on it using this software. Here the entire analysis is done in FEMM software which is capable of doing several types of analyses of linear/nonlinear magnetostatic problems, time harmonic magnetic problems, linear electrostatic problems, and steady-state heat flow problems. FEMM is a suite of programs for solving low frequency electromagnetic problems on two-dimensional planar and axi symmetric domains.
4.1 Finite Element Magnetics Method software
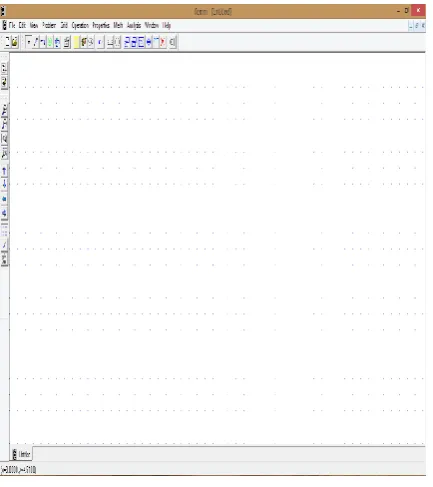
Figure 4.1: FEMM Home screen
FEMM is a suite of programs for solving low frequency electromagnetic problems on two-dimensional planar and axisymmetric domains. This program is a Multiple Document Interface pre-processor and a post-pre-processor for the various types of problems solved by FEMM. It contains a CAD like
interface for laying out the geometry of the problem to be solved and for defining material properties and boundary conditions. AutoCAD DXF files can be imported to facilitate the analysis of existing geometries. Field solutions can be displayed in the form of contour and density plots. The program also allows the user to inspect the field at arbitrary points, as well as evaluate a number of different integrals and plot various quantities of interest along user-defined contours.
4.2Reactance Calculation Using FEMM Software
This program is a Multiple Document Interface pre-processor and a post-pre-processor for the various types of problems solved by FEMM. Calculate the Reactance of busbar using FEMM software is very useful to compare the result with calculated value. The preprocessor is used for drawing the problems geometry, defining materials, and defining boundary conditions. The magnetics postprocessing functionality of FEMM is used to view solutions generated by the fkern solver. A magnetics postprocessor window can be opened either by loading some previously run analyses via File Open on the main menu, or by pressing the “big magnifying glass” icon from within a pre-processor window to view a newly generated solution. Magnetics postprocessor data files stored on disk have the .ans prefix.
4.2.1 Pre-processor Mode
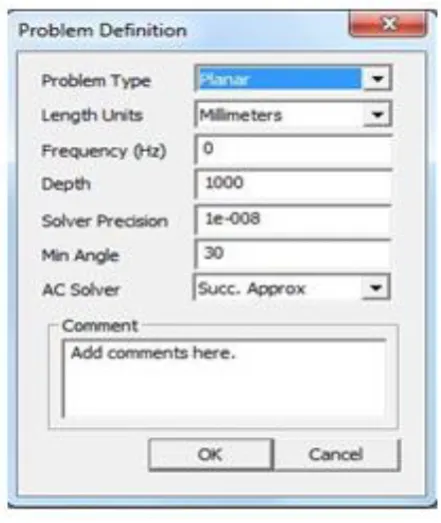
problem geometry. Specify the depth of problem geometry into page direction. All the input enters the window as shown in fig. 4.3.
Figure 4.2: Create a New Problem
Figure 4.3: Problem Definition Menu
Draw the geometry of three phase four wire
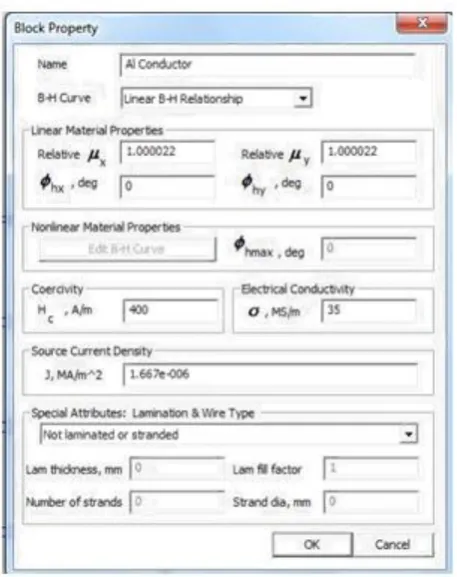
rectangular BBT system as per dimension given in table 3 by using drawing tool in pre-processor mode. Figure 4.4 show the geometry of three phase four wire rectangular BBT system as per given dimension. Enter the Material property in block property dialogue box and assign the material to the different parts in the geometry, also define the boundary condition for the problem. Figure 4.6 show the complete geometry in preprocessor mode for meshing the model, analysing the model, and viewing the results.
Figure 4.4: Busbar Trunking Geometry
Figure 4.5: Material Property Dialogue Box
Figure 4.6: Complete Geometry in Pre-processor Mode
4.2.2 Postprocessor Mode
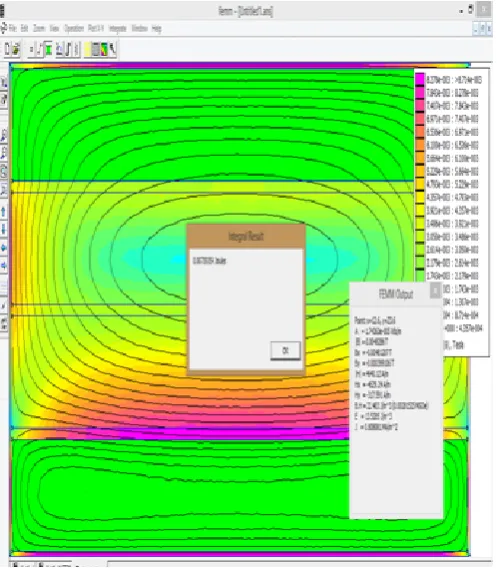
The magnetics post processing functionality of FEMM is used to view solutions generated by the fkern solver.. From the magnetic field energy, calculate the inductance stored in busbar.
Figure 4.8: Magnetic Field Energy in Busbar
Table 4:- Reactance Values of Aluminium Conductor for Various Current Rating Compared with calculated
and Simulated Values
These values have been calculated based on the final prepared FEMM model. The dimensions for cross-section of the busbar were obtained from the aluminium Bus way catalogue for aluminium busbars operating at 50 Hz. All values here have been
simulated for 1m length of the busbar. The simulated values have then been compared to the values given by mathematical model for reactance. The thickness has been assumed to be 6mm for busbars with one conductor per phase.
Table 5:- Electrodynamic Forces Calculated for Short Circuit Currents for Aluminium Busbar
These values have been calculated for aluminium busbars, based on the short time withstand current (1 second) presented by the engineers of the busbar trunking design team. These values have been calculated considering the variation in the forces affecting each phase. As is evident, the central phase conductor experiences a more powerful force than the two external phase conductors. These values have been calculated considering resistance, reactance, the spacing between two busbars, and the short time withstand current, i.e., the short circuit current the busbars can tolerate for 1 second. Based on these forces, sizing and design of the conductors, enclosures, accessories, support structures etc. so that they are mechanically strong enough to withstand these forces.
V.
CONCLUSIONFrom the mathematical model values have been calculated and compared to the values given in catalogue for resistance and reactance. Very small percentage of difference between the experimental and calculate value. The mathematical model result also verified by using FEMM software. The electrodynamics forces were to be calculated based on the short time withstand current (1 second) for the bus conductors in a three phase system. The available force data provided to the Mechanical Engineer. Based on these forces, sizing and design of the conductors, enclosures, accessories, and support structures should be design such as they are mechanically strong enough to withstand these forces and maintain normal operation.
As per the specific work undertaken, the model designed for the calculation of impedance is expected to be used for validation in upcoming design projects of the conductors in three phase busbar systems. The electrodynamic forces are to be used by a mechanical engineer for studies onto the mechanical withstand of the busbar enclosure. The practical experimentation on the insulation used for Aluminium busbar trunking systems was a step in the complete ad rigorous testing of the insulation. As the undertaken experiments were deemed successful it has since moved on to successive, more exhaustive stages in its testing. From the available theoretical data, we can easily designed and analyze, any range of BBT system for future modification.
VI.
REFERENCES[1] F.Delgado, C.Renedo, A.Ortiz, and I. Fernandez, “Numerical Model of a Three-Phase Busbar Trunking System”Electrical Insulation Conference (EIC), Montréal, Qc, Canada, 19 - 22 June 2016.
[2] Agus Risdiyanto, Maulana Arifin, Umar Khayam, Suwarno, “Study on Temperature Distribution at Busbar Connection Based on Contact Resistance of Different Plating Contact
Surface”Joint International Conference on Rural Information & Communication Technology and Electric-Vehicle Technology (rICT &
ICeV-T)November 26-28, 2016, Bandung-Bali,
Indonesia
[3] Y. J. Bao, K.W.E.Cheng, K. Ding, D.H.Wang, “The Study on the Busbar System and its Fault Analysis” Power Electronics Systems and
Applications (PESA), 5th International
Conference, Dec 2013
[4] E. T. CARLSON, “Enclosed Busbar Electrical Distribution System” IEEE Electrical Engineering, Volume: 60, June 1941
[5] M Chiampi, D Chiarabaglio, M Tartagli, “FEM ANALYSIS AND MODELLING OF BUSBAR SYSTEMS UNDER AC CONDITIONS” IEEE, International Conference on Computation in electromagnetics, August 2002.
[6] S. Schlegel, S. Grosmann, H. Lobl, “Joint resistance of bolted copper - copper busbar joints depending on joint force at temperatures beyond 105 °C” The 56th IEEE Conference on Electrical Contacts, November 2010
[7] Farhana Mohamad Yusop, Mohamad Kamarol Mohd Jamil, Dahaman Ishak and Syafrudin Masri, “Study on the Electromagnetic Force Affected by Short-Circuit Current in Vertical and Horizontal Arrangement of Busbar System”
International Conference on Electrical, Control and Computer Engineering Pahang, Malaysia, June 21-22, 2011
[8] S. W. Kim, H. H. Kim, S. C. Hahn, B. Y. Lee, K. Y. Park, Y. J. Shin, W. P. Song, J. B. Kim, and I. H. Shin, “Coupled Finite-Element–Analytic Technique for Prediction of Temperature Rise in Power Apparatus”, IEEE TRANSACTIONS ON MAGNETICS, VOL.38, NO. 2, MARCH 2002.
System” IEEE TRANSACTIONS ON
MAGNETICS, VOL. 42, NO. 4, APRIL 2006.
[10] David Meeker, “Finite Element Method Magnetics”, Version 4.2, User’s Manual, October 25, 2015 [email protected]
[11] Guide of Low Voltage Busduct System. (L and T manual)
[12] Switchgear and Substation Siemens Energy Sector Power Engineering Guide Edition7.0
[13] K.C. Agarwal, “Industrial Power Engineering Handbook”, Newnes, ISBN: 0-7506 - 351-6 Part 5 (Chapter No. 28)
[14] Hamdi Altayib Abdelbagi, “Skin and proximity effects in two parallel plates”, Wright State University School of Graduate Studies, 2007, 88
[15] Ducluzaux, André “Extra losses caused in high current conductors by skin and proximity effects”, Cahier Technique no. 83 (Schneider Electric), 1983, 22
[16] W. Hauschild and E. Lemke, “Basics of High-Voltage Test Techniques”, DOI: 10.1007/978-3-642-45352-6_2, Springer-Verlag Berlin Heidelberg 2014
[17] David Chapman, “Copper for Busbars, Jointing of Copper Busbars”, Chapter 6.
[18] Samarjit Bhattacharyya, Anandita Chowdhury, Hitesh R. Jariwala, M Sharaschandra Shetty, and Rajulkumar Engineer, “Maintaining Low Resistance in Conductive Joints”, International Journal of Computer and Electrical Engineering, Vol. 3, No. 6, December 2011.