SRef-ID: 1684-9981/nhess/2004-4-147
© European Geosciences Union 2004
and Earth
System Sciences
The evolution of slope failures: mechanisms of rupture propagation
D. N. Petley
Department of Geography, University of Durham, County Durham, UK
Received: 29 August 2003 – Revised: 9 December 2003 – Accepted: 19 December 2003 – Published: 9 March 2004 Part of Special Issue “Landslide and flood hazards assessment”
Abstract. Forecasting the occurrence of large, catastrophic slope failures remains very problematic. It is clear that in or-der advance this field a greater unor-derstanding is needed of the processes through which failure occurs. In particular, there is a need to comprehend the processes through which a rupture develops and propagates through the slope, and the nature of the inter-relationship between the stress and strain states of the landslide mass. To this end, a detailed analysis has been undertaken of the movement records for the Selborme Cut-ting slope failure, in which failure was deliberately triggered through pore pressure elevation. The data demonstrate that it is possible to determine the processes occurring in the basal region of the landslide, and thus controlling the movement of the mass, from the surface movement patterns. In particular, it is clear that the process of rupture development and prop-agation has a unique signature, allowing the development of the rupture to be traced from detailed surface monitoring. For landslides undergoing first time failure through rupture prop-agation, this allows the prediction of the time of failure as per the “Saito” approach. It is shown that for such predic-tions to be reliable, data from a number of points across the landslide mass are needed. Interestingly, due to the complex stress regime in that region, data from the crown may not be appropriate for failure prediction.
Based upon these results, the application of new tech-niques for the detailed assessment of spatial patterns of the development of strain may potentially allow a new insight into the development of rupture surfaces and may ultimately permit forecasting of the temporal occurrence of failure.
1 Introduction
At present our understanding of the processes occurring within the basal region of a landslide is relatively poor on both the macro- and micro-scale. These processes are impor-Correspondence to: D. N. Petley
tant as in most landslides occurring in intact materials (i.e. in the form of translation or rotational slides), it is the basal processes that control the surface movement patterns. Thus, the development of an understanding of the processes occur-ring within the basal zone might pave the way to models that allow prediction of the future patterns of movement of a land-slide.
This paper examines the development of one particular failure, based upon a detailed data set collected as part of the Selborne Cutting Slope experiment in 1989. Analysis has been conducted on the movement record as recorded by inclinometers located within the landslide mass. The manner in which the failure developed and propagated through the landslide mass is described using the velocity – time method of Petley et al. (2002). From this analysis, some general con-clusions may be drawn about the development of failure in landslide systems, and insight has been obtained into the op-timal monitoring approaches for the prediction of the time of failure of landslides.
2 Accelerating trends in landslides
In recent years there has been renewed interest in the un-derstanding of basal deformation processes. This has been spurred by a reassessment of the observations made initially by Saito (1988) and developed in more detail by Voight (1988, 1989) and Fukuzono (1990). Here, it was observed that failures in many landslides are preceded by an acceler-ating trend that, when plotted in3−t space, where3=1/v
Fig. 1. Cross section through the Selborne landslide, indicating the location of the inclinometers discussed in this paper (after Cooper et al., 1998). No vertical exaggeration.
of sliding on existing surfaces, they suggested that an asymp-totic trend might be expected to be observed in3−t space. This is borne out by the work of Petley et al. (2002), who demonstrated that an asymptotic trend is indeed displayed in non-brittle landslide systems. Further, Petley and Petley (2004) demonstrated that for the massive, catastrophic Vajont landslide in 1963 two periods of acceleration prior to the fi-nal failure were not characterised by linearity, whilst the fifi-nal failure did show a clear linear trend. This was taken to imply that the basal mechanisms evolved through time, changing from an essentially ductile process during the creeping phase to a brittle process at final failure. This concurs with the sug-gestions made on the basis of the deformation mechanics by Petley (1996) and Petley and Allison (1997).
However, there is much to learn about the evolution of failure in landslide systems and in particular about the ways in which fracture propagation through the basal zone of the landslide allows the development of the final failure. This is a key aspect in the understanding of the development of land-slides, and in particular in the prediction of the time of final failure and the evolution of the basal region of a landslide system.
3 Selborne Cutting Slope experiment
The remarkable Selborne Cutting Slope experiment of 1989, described in detail in Cooper et al. (1998), undoubtedly still provides the best available data set regarding the develop-ment of a first time failure. This landslide was intentionally triggered in a large slope cut into the side of an old brickpit in Hampshire, England. The failure was triggered in a 1:2 gradient benched slope in Gault Clay through careful and controlled increases in pore pressure generated through ar-tificial groundwater recharge using a network of specially-constructed wells and a constant head water tank system. The slope was instrumented with a comprehensive network
-400 -200 0 200
0
Day number (0 = 1st January 1989)
Fig. 2. Displacements of the landslide surface plotted against time, as determined from the inclinometer readings. Day 0 is the time at which pore pressure recharge was initiated.
of piezometers, inclinometers and extensometers, providing a full data set of the slope processes prior to and during the failure event.
The failure was triggered in a highly controlled manner. After the initial slope cutting the system was given a long period to equilibrate prior to groundwater recharge. Ground-water levels were elevated over a period of some 180 days until failure was triggered. The failure occurred in the form of a slump with a curved back scar. Movement developed in a sedate manner, with maximum recorded displacement rates of 58 mm/h (Cooper et al., 1998).
4 Displacement records
The full instrument data set from the Selborne experiment are publicly available in electronic form from the project team. In this study, detailed analysis has been undertaken of the surface displacements of the Selborne slope as determined from the inclinometer records. Twelve inclinometers were emplaced within the slope, of which six were situated within the landslide (Fig. 1). This study examines the records of these eight, plus one located immediately above the crown of the landslide, and one just below the toe (Fig. 1). An analysis of the movement pattern of the landslide as derived from the 24-h inclinometer data in the vicinity of the shear surface was presented by Cooper et al. (1998), who noted that:
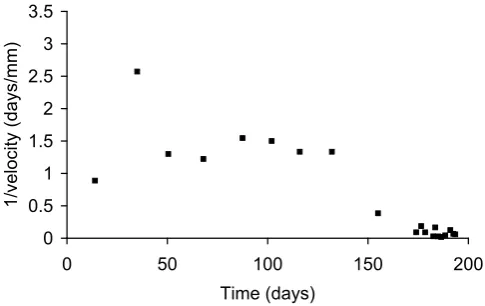
Fig. 3. Displacements of the landslide surface plotted in 3−t space: (a) Inclinometer 5; (b) Inclinometer 6; (c) Inclinometer 7; (d) Inclinometer 8.
• For the failure event, the inclinometers in the vicinity of the centre of the slope (inclinometers 5 and 6) showed very little movement prior to about day 160, but then showed a rapid and dramatic acceleration to final fail-ure.
• Inclinometer 4, which was situated close to the rear scarp, displayed a behaviour that is in considerable vari-ance to all of the other instruments. The causes of this were not discussed.
The nature of the accelerating trends for these inclinome-ters in the vicinity of the shear surface was analysed by Petley et al. (2002), who noted that when plotted in3−t space, in-clinometer 8 showed a clear linear trend in the 40 days prior to final failure. Whilst they acknowledged that there is the possibly of some late-stage steepening of the line, analysis of the data using the techniques of Fukuzono (1990) allows forecasting of the time of final failure to within+/−4 days. Similar linearity was also been noted for the inclinometers located upslope, although the early movements were slower and there is more scatter in the data. This was taken to imply that the early phases of movement were dominated by inter-nal deformations, whereas the late-stage rapid acceleration suggests the propagation of the fracture upslope.
Thus, Petley et al. (2002) provisionally concluded that the linear trend appears to represent movement in different
parts of the landslide associated with fracture propagation, which is in agreement with the post-failure analyses of the site and geotechnical investigations by Cooper et al. (1998), who clearly demonstrated that the final failure occurred as a result of the development of a discrete shear surface.
plotted in3−tspace.
Fig. 5. Displacements of the landslide surface for Inclinometer 9, plotted in3−tspace.
velocity increases so the data quality improves. More than a decade after the experiment it is probably now possible to install instruments with a much higher resolution, avoiding some of these issues.
The instrument that shows linearity from the very start of the experiment is Inclinometer 6 (Fig. 3b), located in the very middle of the landslide. Petley et al. (2002) and Petley and Petley (2004) demonstrated that the onset of linearity for any part of the landslide mass is associated with the effects of crack propagation affecting that zone. It is thus logical to suggest that crack initiation started in the vicinity of Incli-nometer 6 and then propagated outwards. It is difficult to determine when linearity occurs for the other instruments, but the greatest scatter occurs for inclinometer 7, perhaps suggesting that propagation was initially dominantly upslope (i.e. towards inclinometer 5), and then downslope (towards inclinometer 7 and 8) from about day 80. Note that high lev-els of scatter continue to occur in instrument 7 until about day 150.
The deformation data of inclinometer 4 are more difficult to interpret (Fig. 4). The displacement – time plot shows that
plotted in3−tspace.
this inclinometer indicates the most rapid surface movements of any of the instruments, and that these movements were ini-tiated very early in the experiment and then accelerated in an unpredictable manner (Fig. 2). The final rapid movements do coincide with the rapid movements of the other instruments. When pore pressure recharge was initiated this area under-went an abrupt acceleration, followed by a period of gradual deceleration. Very late on this area accelerated abruptly once again. Unsurprisingly this yields essentially uninterpretable data in 3−t space (Fig. 4). Some semblance of linearity is possibly indicated late on, but this may just be an arte-fact. The reasons why this point should show such differ-ent behaviour are unclear at this point. Although Cooper et al. (1998) do not suggest this, it is possible that this section was behaving initially as a separate system. Alternatively, perhaps the proximity of the steep back-scarp, and the re-sultant tensile stresses that occur in this region, mean that the deformation pattern is quite different. Either way, the movement data for this point suggest that monitoring in the vicinity of the back scarp may not allow an analysis of the behaviour of the basal materials or the prediction of the time of final failure where appropriate.
Inclinometer 9 was located in the vicinity of the toe of the landslide, but just within the mobile mass. Interestingly, in the early phases of the experiment, soon after cutting, quite substantial movements were noted. It is notable however that the accelerating phase occurred later than for the parts of the landslide situated upslope (Fig. 2). This is reflected in the plot is space (Fig. 5), with an initial high level of scatter, set-tling down to an approximately constant value of3, before a late stage acceleration at about day 135. Thus, although some early deformation occurred in this area, propagation of the fracture to this point appears to have occurred late in the experiment.
Fig. 7. Displacements of the landslide surface for Inclinometer 3, plotted in3−tspace.
showing that off the landslide very different effects are seen. Similar results are seen for Inclinometer 3 (Fig. 7), located above the back scarp of the failure, which although display-ing some sort of acceleratdisplay-ing trend, does not produce a sta-tistically valid result.
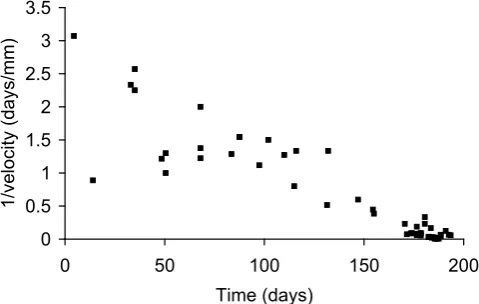
Thus, in general the inclinometers in the main body of the landslide indicate that linearity can be determined in this area. However, there is considerable scatter in the data. Sub-stantial improvements in this are noted by combining the data from a number of instruments in this area (Fig. 8). This com-bined data set clearly shows the linear trend, with relatively low levels of data scatter in the final 70 days or so. The time of the final failure could have been predicted with a rea-sonable level of confidence (i.e.+/−5 days) approximately 50 days in advance of its actual occurrence.
Thus, it appears that a monitoring programme for the in-terpretation of landslide movement mechanisms and the pre-diction of the time of final failure should attempt to examine the movement patterns of a range of points within the po-tential landslide mass, rather than just one. Thus, combined readings from a number of extensometers or inclinometers would appear to be ideal. Alternatively, the application of interferometric techniques, which measure the deformation of many points on the ground surface (Bulmer et al., 2002; Tarchi et al., 2003) or total station techniques (Mantovani et al., 2000) would appear to be ideal, although in the latter case the technology has yet to mature fully.
5 Discussion
The excellent Selborne data set collected by Cooper et al. (1998) provides important insights into the process by which first time failures develop. The data show that the development of failure is initiated in the midslope area and then propagates both up and downslope to allow final failure to occur. However, the Selborne experiment should be con-sidered to be an artificial landslide that was relatively small
Fig. 8. Displacements of the landslide surface for Inclinometers 6, 8 and 9 combined, plotted in3−tspace.
in extent. Therefore, a critical question is to what degree the processes observed in this slope can be extrapolated to large, natural systems? In fact there is quite good evidence that these process do indeed occur in natural first time fail-ures. There are several pieces of evidence to support this. First, Petley and Petley (2004) have demonstrated that the extremely large Vajont landslide displayed linearity prior to the catastrophic failure. Second, many other natural land-slides over a wide range of scales have also shown the linear trend (see for example Petley et al., 2002). Thirdly, Kilburn and Petley (2003) showed using first principles that linear-ity is a fundamental process associated with crack growth in natural systems. Finally, it should be noted that whilst the Selborne failure was an artificially induced landslide, the project team tried to replicate natural processes as much as possible by, for example, inducing failure through controlled pore pressure increases and by ensuring that the slope was formed from undisturbed materials.
6 Conclusions
Ven Landslide, Dorset 2001, in: Geomorphology: From Expert Opinion to Modelling, European Centre on Geomorphological Hazards, edited by Delahaye, D., Levoy, F., and Maquaire, O., Strasbourg, France, 21–27, 2002.
Cooper, M. R., Bromhead, E. N., Petley, D. J., and Grant, D. I.: The Selborne cutting stability experiment, Geotechniq., 48, 83–101, 1998.
Fukuzono, T.: Recent studies on time prediction of slope failure, Landslide News, 4, 9–12, 1990.
Hutchinson, J.: Landslide risk – to know, to foresee, to prevent, Geologia Tecnica and Ambientale, 9, 3–24, 2001.
Kilburn, C. R. J. and Petley, D. N.: Forecasting giant, catastrophic slope collapse: Lessons from Vajont, northern Italy, Geomor-pho., 54, 49–62, 2003.
failure, Proceedings of the International Symposium on Land-slides, 1, 321–324, 1980.
Tarchi, D., Casagli, N., Fanti, R., Leva, D. D., Luzi, G., Pasuto, A., Pieraccini, M., and Silvano, S.: Landslide monitoring by using ground-based SAR interferometry: an example of application to the Tessina landslide in Italy, Eng. Geol., 68, 15–30, 2003 Voight, B.: A relation to describe rate-dependent material failure,
Science, 243, 200–203, 1988.