© 2017 IJSRST | Volume 3 | Issue 8 | Print ISSN: 2395-6011 | Online ISSN: 2395-602X Themed Section: Science and Technology
Quality Circle : A Conceptual Review
Lalit Kumar Biban, Arun , Deepak Dhounchak
Mechanical Engineering Department, UIET, MDU Rohtak, Haryana, India
ABSTRACT
This paper presents an overview of the philosophy and Quality Circle. Quality circle structure and various features of Quality Circle are very important for any organization. Quality Circle is a Quality Improvement Group and Work Group/Project Team. Successful implementation of QC makes an organization profitable. Quality Circle is an important method which involves the development of skills, capabilities, confidence & creativity of the people through cumulative process of education, training of employees in any organization. In modern era, Development of new management techniques has taken place all over the world which led to formation of complex production management system. Thus industry has to face many challenges due to increase in the product complexity. Quality Circles are small groups of employees and usually their supervisor who volunteer to meet regularly on company time to identify, analyze, and solve problems in their work area.
Keywords: Quality Circle, improvements in quality, Implementation of QC, Employees training, Tools, , Function of Quality Circles, Quality improvement, Quality control.
I.
INTRODUCTION
Quality Circles are small groups of employees and usually their supervisor who volunteer to meet regularly on company time to identify, analyze, and solve problems in their work area (Sharma, 2013a). They present solutions to management and whenever possible, they implement their solutions. The Quality leader is normally the group’s supervisor, who although he leads the circle, must act as peer in the process as decisions are made by consensus. The objectives of the quality circles are to reduce error, to enhance the quality of goods and services provided by the members of the circle, and to improve the working environment. Problem for a Quality Circle to work on may be identified by anyone; circle members, management, other organization, etc.
II.
QUALITY DEFINITIONS
Quality can be doing the right thing, in the right way on right time as well as doing it right the first time and doing it right every time. The word 'quality' has several definitions. Quality is concerning about craze and satisfaction (Sharma, 2012). In these days’ era, mostly in every organisation, concept of quality and quality improving are almost certainly the most vital mission
(Sharma, 2013b). Screening the vast literature review on the meaning of quality, till date it is mystifying to describe and measure the term quality. Starting from the early days, quality definition always fits in two common categorizations (Kanji & Yui, 1997):
It is about to manufacturing the product as per their specified specifications that is to produce a product with pre-defined dimensions (Sharma & Kadyan, 2016b).
Secondly, It is about to produce the quality product or services which will satisfy the customer and go well with the user requirement.
standard in producing products and providing quality services.
III.
QUALITY CIRCLE
The concept of Quality Circle was originated in 1940’s in Japan during war in industry world. Prof. Ishikawa, who believed in Quality Circle movement to give Japanese industry that extra edge in creativity by the creative potential of workers in the organization, W.E Deming is the first, who explains that the standard action, where only the managers can solve the problems, is wrong. He suggests another way of operation, respectively a qualitative analysis of problems, called Quality Circles. Even though this idea was initially derived from W.E. Deming, the largest contribution to further development and adaptation of Quality Circles has been given by Kaori Ishikawa.
According to American Society for Quality Control, in the book QC Circles: Application, Tools and Theory, the most used goals in majority cases are:
Quality
Efficiency
Costs
Equipment.
According to Professor Bobek Shuklevit, Quality Circle represents a technique, according to which, a group of employees regularly meet in order to identify and resolve the problems that affect the scope of their work.
According to William Mohr, Quality Circles can be Participatory form of Management, a technique for the development of human resources and a forum for solving the problems.
Form of Participatory Management – Quality Circles are the best tools which enable the implementation of participative management. If the employees have the opportunity to solve the problems by themselves, further implementation of these solutions contribute to the strategies of the companies, in order to set the goals in the position from bottom to top.
IV.
CHARACTERS OF QUALITY CIRCLE
Circle membership
Circle size:
Voluntary participation
QC meetings
Autonomy.
V.
ASSUMPTIONS OF QUALITY CIRCLES
1. Workman should be intelligence, experience and attitudes for active in job.
2. Employees must be creative ideas imagination to organizational processes.
3. The employees can make every valuable suggestion on many small things that go wrong, or are not fully utilized.
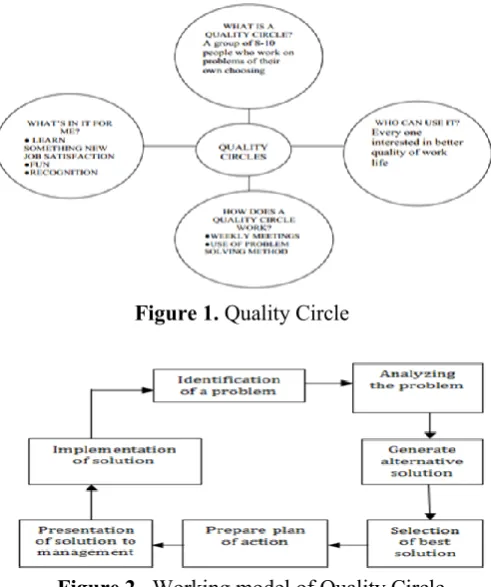
Figure 1. Quality Circle
Figure 2. Working model of Quality Circle
VI.
FACTORS AFFECTING IMPLEMENTATION
OF QUALITY CIRCLE
There are some factor which effects Quality Circle which given below:
Strategic planning.
Training and education
Flexibility
Employee involvement
Communication
Motivation and empowerment
Strategic planning
Continuous improvement
Leadership
Culture change
Customer satisfaction
Research and development
VII.
SEVEN BASIC TOOLS
The seven tools were developed by Prof. Kaoru Ishikawa these tools are the basic fundamental means of achieving quality improvement and fundamental instrument to improve product quality these tools are basic to monitoring and improvement activities at the process level these are used in analyze data for variation (Corbett & Rastrick, 2000).
1. Pareto – chart
2. Cause - effect diagram 3. Check sheet
4. Histogram 5. Scatter diagram 6. Control chart 7. Graphs.
VIII.
PROBLEM IDENTIFICATION
Problem identification is concern with identification of problem in manufacturing industry where Quality control system is remarkable. Several checks and tests are done after each manufacturing process. Hence rejection level of company is decreasing constantly. Still there are some problems which occurred often in the company and cause rejection. The problem identifies as Non-Conformity (Irani, Beskese, & Love, 2004). The term Non-Conformity is basically known as NC. It specifies those products which does not meet the customer expectation during manufacturing. NC can be covered into good product by the process of sorting or rework. There are those NC are discussed which can’t converted into good product (OK-Product) by any of the
process and rejected as scrap which increase the cost of manufacturing industry. The problems of higher PPM (parts per million) are identified by using following steps.
Compilation of Final Inspection Data of Problems (Non-conformities): Final Inspection is the area where In house rejection and customer rejection is recorded for each product and process. It is the last stage of thoroughly inspection of every product. A record of product inspected and rejected to scrap is maintained to know PPM level. The higher PPM of any product mean higher the qualify cost to the manufacturing industry that can be identified as problem.
Pareto Chart to identify severe problems: There are many problems found in random state in Final Inspection area. These problems contribute to the total problem to a certain percentage. Percentage of each problem must be known which contributed to the higher cost of the quality. This percentage contribution can be obtained by using Pareto Chart. One or two highly contributed problems can be selected to solve.
Mark the Identified Problem: Once the highly contributed problem gets selected, mark the problems which need to be solved by Quality Circle Team through the process of finding best economic solution among all possible solution provided by the team through Brainstorming Process. Mark the problems which are highly contributed to the total cost of the quality to manufacturing industry.
IX.
QUALITY CIRCLE FORMATION
respective areas. These people go around in their respective areas collect data analyze the problems and reaches to a solution or to a solving technique. This process is called brainstorming. So the main Quality Control Tools that we used to solve the problems.
X.
BRAIN STORMING SESSION
In the next step after quality circle formation, a brain storming session was conducted to find out the views of the quality circle members about the problem they had faced in their daily routine. In the brain storming session each member is free to talk about the problems in the industry which affect the production badly. These problems were listed. From every section responsible persons are called and solutions related to problems are discussed. In this process of brainstorming we find that many problems can be solved just by adding some checkpoints and tests. Like problem of cracks in pressing section can be solved just by checking temperature of manufactured pads kept in storage area. In this session of brainstorming involvement of workers, supervisors, engineers and higher management is necessary so that steps can be taken at every level to reduce rejection and achieve better productivity (D Dhounchak & L K Biban, 2017).
XI.
DATA COMPILATION
It’s a survey or evaluation answers, gathering them into a database, improvements, and/or recommendations and analyzing the results for further suggestions. For the above mentioned problems data collection was the initial step, because to gain better output it’s necessary to have correct input. And data from several sources and of a definite time taken in certain condition represents the better picture of problem than any other method.
XII.
IMPLEMENTATION
Implement the feasible ideas to minimize or eliminate the problem which are highly contributed to the total no. of problem. The implementation is done on the basis of Quality Circle.
XIII.
CONCLUSION
Quality circle is rapidly spread in variety of organization. It is use for group based solution of work related problem. In the present research work, an initiative has been taken to apply Quality Circle Methodology is applicable in any type of organization like factories, hospital, automobile industry, banks, institute etc. After introducing quality circle technique in organization scenario is totally changed. Now accessibility is improved and enhanced. There is also need to generate awareness about the quality circle so that more and more employees use it for their benefits. The results of the study showed that empower employee to achieve zero defects in all possible ways and has a lot of potential to pioneer quality system by use of Quality Circle. It provided platform to manpower to give suggestions in improvement in concern areas. It found reliable and suitable in regards to reduce the cost of training to new or existing employees by providing permanent data that can be used in repetitive manner to understand training topics.
XIV.
FUTURE SCOPE
It is applicable in different type of organization like factories, hospital, automobile industry, banks, institute etc. It is successful implementation of Quality Circle Methodology has been carried out also used in manufacturing industry at small scale. It is a very good technique to reduce the waste materials to the smallest level that is possible. This method recorded elimination of major problem related to product by successful and effective implementation of Quality Circle between the employees. This technique can be successfully applied to large scale industry to improve their quality and less wastage. Since this approach is related to team work, therefore it will goes towards the better development. That’s why due to competitive age this technique may be applied successfully to the maximum industries.
XV.
REFERENCES
[1]. Bohoris, G. A. (1995). A comparative assessment of
some major quality awards. International Journal of Quality and Reliability Management, 12(7), 30–43. [2]. Corbett, L. M., & Rastrick, K. N. (2000). Quality
performance and organizational culture.
Management, 17(1), 14–26. http://doi.org/10.1108/02656710010300126
[3]. Irani, Z., Beskese, A., & Love, P. E. D. (2004). Total quality management and corporate culture:
Constructs of organisational excellence.
Technovation, 24(8), 643–650.
http://doi.org/10.1016/S0166-4972(02)00128-1 [4]. Kanji, G. K., & Yui, H. (1997). Total quality culture.
Total Quality Management, 8(6), 417–428. http://doi.org/10.1080/0954412979424
[5]. Sharma, C. (2012). Six Sigma Reflections in the
Direction of Librarie: An Organization Outlook. International Journal of Management, IT and Engineering, 2(12), 521–528.
[6]. Sharma, C. (2013a). Begining of diverse quality
management methodologies in libraries:An outline. International Journal of Management, IT and Engineering, 3(8), 322–346.
[7]. Sharma, C. (2013b). Quality Management in
Libraries: An Outline. International Journal of Enhanced Research in Management & Computer Application, 2(8), 01–04.
[8]. Sharma, C. (2017a). Initiating and Linking Total
Quality Management in Libraries. World Wide Journal of Multidiscipl Inary Research and Development, 3(10), 119–122.
[9]. Sharma, C. (2017b). Quality Management in
Relation with Library Services. International Journal of Research in Engineering, IT and Social Sciences, 7(10), 11–14.
[10]. Sharma, C., & Kadyan, S. (2015a). Analyzing
quality management move towards quality service in libraries. Research Journal of Library Sciences, 3(4), 08–11.
[11]. Sharma, C., & Kadyan, S. (2015b). Performance Evaluation through Quality Index Model: A Case Study of an Institute Library Chitra Sharma. International Research: Journal of Library & Information Science, 5(4), 625–641.
[12]. Sharma, C., & Kadyan, S. (2016a). Examine Total Quality Management in Engineering College Libraries : An Evaluative Study. Pearl-I Journal of Library and Information Science, 10(4), 215–223. [13]. Sharma, C., & Kadyan, S. (2016b). Road Plan to
Enterprise TQM from Manufacturing to Library Services. International Journal of Information Dissemination and Technology, 6(3), 165–169.
[14]. Deepak Dhounchak, Review of 6S Methodology,
International Journal of Development Research, Volume 07, Issue 08, pp.14455-14457, August, 2017.
[15]. Deepak Dhounchak. Implementation of 6S
Methodology in a Manufacturing Plant, Research & Reviews: Journal of Engineering and Technology, Volume 6, Issue 3, September, 2017.
[16]. Deepak Dhounchak and Sandeep Kumar,
Application of 6S Approach in Manufacturing Industry – A Case Study, International Journal of
Scientific Research in Computer Science,
Engineering and Information Technology, Volume 2, Issue 5, pp. 432-435, September – October, 2017.
[17]. Shakti and Deepak Dhounchak, Role of Supply
Chain Management in Industries – A case study, International Journal of Scientific Research in Science, Engineering and Technology, Volume 3, Issue 6, pp. 531-534, September – October, 2017.
[18]. Deepak Dhounchak and Lalit Kumar Biban,
Applications of Safety in Manufacturing Industries, International Journal of Scientific Research in Science, Engineering and Technology, Volume 3, Issue 6, pp. 498-500, September – October, 2017.
[19]. Lalit Kumar Biban, Deepak Dhounchak and Shakti,
8D Methodology: From Concept to Application Across Manufacturing Industries, International Journal of Scientific Research in Science, Engineering and Technology, Volume 3, Issue 6, pp. 558-563, September – October, 2017.
[20]. Deepak Dhounchak and Sandeep Kumar, A Review
Article of 6S Approach, Journal of Scientific Research in Science and Technology, Volume 3, Issue 7, pp. 504-507, September – October, 2017.
[21]. Lalit Kumar Biban and Deepak Dhounchak,
Relevance of 8D Methodology, Journal of Emerging Technologies and Innovative Research, Volume 4, Issue 10, pp. 415-419, October, 2017.
[22]. Lalit Kumar Biban and Deepak Dhounchak, 8D
Methodology and Its Application, Journal of Emerging Technologies and Innovative Research, Volume 4, Issue 10, pp. 533-540, November- 2017.
[23]. Deepak Dhounchak and Lalit Kumar Biban, A